招聘信息爬取与分析
招聘信息爬取与分析
写在前面
作为874万应届毕业生中的一员,近期也在积极地找工作,于是爬取了意向岗位以及相关岗位的信息,并对岗位分布、薪资情况、学历、公司规模与行业等进行了分析。
主要流程
数据爬取
招聘网站选的是51job,爬取的岗位关键字有[ ‘人工智能’,‘机器学习’, ‘数据分析’, ‘数据挖掘’, ‘算法工程师’,‘深度学习’,‘语音识别’,‘图像处理’,‘自然语言处理’],因为不同关键字会出现某些相同的岗位,故在爬取的过程中利用增量爬取的思想,设置了指纹。
爬取流程
url分析
self.url = 'https://search.51job.com/list/000000,000000,0000,00,9,99,%s,2,%d.html'
%s,%d分别表示输入关键字和页码。
一级页面爬取
页码随输入关键字变化而变化,要在第一页上对页码进行获取,在这里获取页码后以字典的形式存储起来
requests.get()获取页面,xpath对页面进行解析
def get_html(self,url):
    try:
         html = requests.get(url=url,headers={
     'User-Agent':UserAgent().random},timeout=3).content.decode('gb2312',errors="ignore")
         return etree.HTML(html)
     except:
         print('sleep')
         sleep(uniform(200,300))
         return self.get_html(url)
获取岗位页码字典
def get_job_page_dict(self,url,job):
    p = self.get_html(url)
    s = p.xpath('//div[@class="dw_tlc"]/div[4]/text()')[0]
    page = ceil(int(re.findall('\d+',s)[0])/50)
    self.job_page_dict[job]=page
爬取一级页面上岗位链接、岗位名称、公司名称、工作地点、薪资以及发布日期信息,做增量爬取,增量爬取利用了Redis集合的性质。若该岗位未被爬取过,将其部分新存储在列表中。
一级页面信息获取
def get_one_html(self,url,k):
    p = self.get_html(url)
    job_href_list = p.xpath('//div[@class="el"]/p/span/a/@href')
    job_name_list = p.xpath('//div[@class="dw_table"]//p/span/a/@title')
    comapny_list = p.xpath('//div[@class="el"]/span[1]/a/@title')
    location_list = p.xpath('//div[@class="el"]/span[@class="t3"]/text()')
    salary_list = p.xpath('//div[@class="el"]/span[@class="t4"]/text()')
    pubdate_list = p.xpath('//div[@class="el"]/span[@class="t5"]/text()')

    for href,name,company,location,salary,pubdate in zip(job_href_list,job_name_list,comapny_list,location_list,salary_list,pubdate_list):
        href_md5 = self.href_md5(href)
        if self.r.sadd('job:href',href_md5)==1:
            self.info.extend([name,k,company,location,salary,'2020-'+pubdate])
            self.get_two_html(href)
            self.save_info()
            self.info = []
            sleep(uniform(0.2, 0.8))
        else:
            continue
        self.if_sleep()
增量爬取指纹设置
def href_md5(self,href):
    s = md5()
    s.update(href.encode())
    return s.hexdigest()
二级页面爬取
获取二级页面中工作经验、学历、公司规模、公司类型、所在行业以及具体的岗位描述信息,其中工作经验学历的信息在一起描述,这里先爬下来后续再做处理,获取信息后添加到岗位信息列表中。
def get_two_html(self, url):
     p = self.get_html(url)
     try:
         experienct_education = '|'.join(p.xpath('//div[@class="cn"]/p[@class="msg ltype"]/text()')).replace('\xa0', '')
         company_type = p.xpath('//div[@class="com_tag"]/p[1]/@title')[0]
         company_scale = p.xpath('//div[@class="com_tag"]/p[2]/@title')[0]
         industry = p.xpath('//div[@class="com_tag"]/p[3]/@title')[0]
         job_describe = ''.join(p.xpath('//div[@class="bmsg job_msg inbox"]/p/text()')).replace('\xa0', '')
         self.info.extend([experienct_education,company_type,company_scale,industry,job_describe])
     except Exception as e:
         print(e)
mysql存储
每获取完一条岗位的信息,就对其进行存储,然后清空岗位信息列表。
def save_info(self):
    sql = 'insert into job51(job_name,job_type,company,location,salary,pubdate,experience_education,company_type,company_scale,industry,job_describe) values(%s,%s,%s,%s,%s,%s,%s,%s,%s,%s,%s)'
    try:
        self.cur.execute(sql,self.info)
        self.db.commit()
        self.count += 1
        print('save %d!'%self.count)
    except Exception as e:
        self.db.rollback()
        print(e)
反爬设置
在代码中设置了比较多处的休眠时间,每获取完一页岗位信息,休眠0.1-2秒,每获取完一个岗位信息休眠0.2-0.8秒,每501页休眠20-100秒,链接过多报错时休眠200-300秒,此外还利用fake_useragent设置了User-Agent池。
完整代码
写了一个类,可以稍作修改,对其他岗位进行爬取。
import requests
from lxml import etree
from time import sleep
from fake_useragent import UserAgent
from math import ceil
from random import uniform
import re
import redis
from hashlib import md5
import pymysql


class JobSpider:
    def __init__(self,job_list):
        self.url = 'https://search.51job.com/list/000000,000000,0000,00,9,99,%s,2,%d.html'
        self.job_list = job_list
        self.job_page_dict = {
     }
        self.r = redis.Redis(host='localhost',port=6379,db=0)
        self.db = pymysql.connect(host='127.0.0.1',port=3306,user='root',password='123456',database='spider',charset='utf8')
        self.cur = self.db.cursor()
        self.info = []
        self.count = 0


    def get_html(self,url):
        try:
            html = requests.get(url=url,headers={
     'User-Agent':UserAgent().random},timeout=3).content.decode('gb2312',errors="ignore")
            return etree.HTML(html)
        except:
            print('sleep')
            sleep(uniform(200,300))
            return self.get_html(url)


    def get_job_page_dict(self,url,job):
        p = self.get_html(url)
        s = p.xpath('//div[@class="dw_tlc"]/div[4]/text()')[0]
        page = ceil(int(re.findall('\d+',s)[0])/50)
        self.job_page_dict[job]=page


    def href_md5(self,href):
        s = md5()
        s.update(href.encode())
        return s.hexdigest()

    def get_one_html(self,url,k):
        p = self.get_html(url)
        job_href_list = p.xpath('//div[@class="el"]/p/span/a/@href')
        job_name_list = p.xpath('//div[@class="dw_table"]//p/span/a/@title')
        comapny_list = p.xpath('//div[@class="el"]/span[1]/a/@title')
        location_list = p.xpath('//div[@class="el"]/span[@class="t3"]/text()')
        salary_list = p.xpath('//div[@class="el"]/span[@class="t4"]/text()')
        pubdate_list = p.xpath('//div[@class="el"]/span[@class="t5"]/text()')

        for href,name,company,location,salary,pubdate in zip(job_href_list,job_name_list,comapny_list,location_list,salary_list,pubdate_list):
            href_md5 = self.href_md5(href)
            if self.r.sadd('job:href',href_md5)==1:
                self.info.extend([name,k,company,location,salary,'2020-'+pubdate])
                self.get_two_html(href)
                self.save_info()
                self.info = []
                sleep(uniform(0.2, 0.8))
            else:
                continue
            self.if_sleep()


    def get_two_html(self, url):
        p = self.get_html(url)
        try:
            experienct_education = '|'.join(p.xpath('//div[@class="cn"]/p[@class="msg ltype"]/text()')).replace('\xa0', '')
            company_type = p.xpath('//div[@class="com_tag"]/p[1]/@title')[0]
            company_scale = p.xpath('//div[@class="com_tag"]/p[2]/@title')[0]
            industry = p.xpath('//div[@class="com_tag"]/p[3]/@title')[0]
            job_describe = ''.join(p.xpath('//div[@class="bmsg job_msg inbox"]/p/text()')).replace('\xa0', '')
            self.info.extend([experienct_education,company_type,company_scale,industry,job_describe])
        except Exception as e:
            print(e)


    def save_info(self):
        sql = 'insert into job51(job_name,job_type,company,location,salary,pubdate,experience_education,company_type,company_scale,industry,job_describe) values(%s,%s,%s,%s,%s,%s,%s,%s,%s,%s,%s)'
        try:
            self.cur.execute(sql,self.info)
            self.db.commit()
            self.count += 1
            print('save %d!'%self.count)
        except Exception as e:
            self.db.rollback()
            print(e)

    def if_sleep(self):
        if self.count % 501 ==0:
            sleep(uniform(20,100))


    def run(self):
        for job in self.job_list:
            url = self.url%(job,1)
            self.get_job_page_dict(url,job)
        for k,v in self.job_page_dict.items():
            for i in range(1,v+1):
                url = self.url%(k,i)
                self.get_one_html(url,k)
                sleep(uniform(0.1,2))

        self.cur.close()
        self.db.close()


if __name__ == '__main__':
    job_list = [ '人工智能','机器学习', '数据分析', '数据挖掘', '算法工程师','深度学习','语音识别','图像处理','自然语言处理']
    spider = JobSpider(job_list)
    spider.run()
数据清洗
数据清洗在mysql做了一部分,之后用python又做了一部分,主要对数据进行规整、去除脏数据、对部分数据进行重构获取新的属性。
mysql
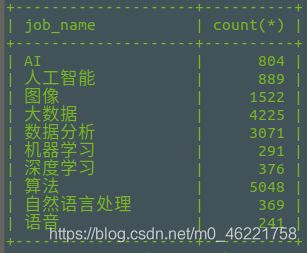
如图,尽管在爬取数据时对岗位类别进行了划分,但实际上各岗位之间有交叉的存在,故要对job_name进行规整,对岗位统一命名。

update job51 set job_name='AI' where job_name like '%AI%';
update job51 set job_name='深度学习' where job_name like '%深度学习%';
update job51 set job_name='机器学习' where job_name like '%机器学习%';
update job51 set job_name ='自然语言处理' where job_name like '%自然语言%' or job_name like '%nlp%';
update job51 set job_name ='图像' where job_name like '%图像%';
update job51 set job_name =' 数据挖掘' where job_name like '%数据挖掘%';
update job51 set job_name ='语音' where job_name like '%语音%';
update job51 set job_name ='人工智能' where job_name like '%人工智能%';
update job51 set job_name ='算法' where job_name like '%算法%';
update job51 set job_name ='大数据' where job_name like '%大数据%';
update job51 set job_name='数据分析' where job_name like "%数据分析%";
处理完各数据分布
select job_name,count(*) from job51 where job_name in ('人工智能','AI','数据挖掘','语音','图像','自然语言处理','深度学习','机器学习','算法','大数据','数据分析') group by job_name;
存储csv
将目标数据提取出来,存储为csv文件,在jupyter notebook上进行处理。
import pymysql
import csv
db = pymysql.connect(host='127.0.0.1',port=3306,user='root',password='123456',database='spider',charset='utf8')
cur = db.cursor()

s = 'job_id,job_name,job_type,company,location,salary,pubdate,experience_education,company_type,company_scale,industry,job_describe'

columns = s.split(',')
with open('job51.csv', 'w+') as f:
    w = csv.writer(f)
    w.writerow(columns)

sql ="select %s from job51 where job_name in ('人工智能','AI','数据挖掘','语音','图像','自然语言处理','深度学习','机器学习','算法','大数据','数据分析');"%s
cur.execute(sql)

file = open('job51.csv', 'a+')
w = csv.writer(file)

while True:
    row = cur.fetchone()
    if row:
        w.writerow(row)
    else:
        break

file.close()
cur.close()
db.close()
python
在jupyter notebook上利用python(pandas)对数据进行处理,数据有16836条
查看数据,数据大概长这个样子,要对location、salary、experience_education、industry、job_describe分别进行处理

先删除不必要的数据job_id、job_type
data.drop(['job_id','job_type'],axis=1,inplace=True)
大概看一眼它的值,有异地招聘、xx-xx区、xx省这样的数据。
首先对异地招聘数据进行处理,在experience_education属性中有相关的城市,可以默认其为岗位所在城市
cut = data[data['location']=='异地招聘']['experience_education'].str.split('|')
for index in cut.index:
    data['location'][index]=cut[index][0]
    #data.loc(index,'location')=cut[index][0]
对xx-xx区数据进行处理,对值进行切分,只保留城市信息,构建新列,xx省暂不做处理
def get_city(x):
    try:
        x=x.split('-')[0]
    except:
        pass
    return x

data['city'] = data['location'].apply(get_city)
对薪资salary进行处理
统一单位,拆分成最高薪资和最低薪资,再计算-平均薪资
薪资单位如下图
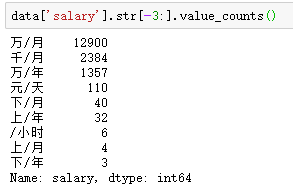
统一单位,并获得最高薪资和最低薪资,这里采用了try-except的方法
def get_max_min_salary(end,mul,x):
    x = x.replace(end,'')
    try:
        _ = x.split('-')
        min_,max_ = float(_[0])*mul,float(_[1])*mul
    except:
        min_=max_=float(x)*mul
    return min_,max_
def get_salary(x):
    if x.endswith('万/月'):
        min_,max_ = get_max_min_salary('万/月',10000,x)
    elif x.endswith('千/月'):
        min_,max_ = get_max_min_salary('千/月',1000,x)
    elif x.endswith('万/年'):
        min_,max_ = get_max_min_salary('万/年',10000/12,x)
    elif x.endswith('元/天'):
        min_,max_ = get_max_min_salary('元/天',20,x)
    elif x.endswith('千以下/月'):
        min_,max_ = get_max_min_salary('千以下/月',1000,x)
        min_ = None
    elif x.endswith('万以上/年'):
        min_,max_ = get_max_min_salary('万以上/年',10000,x)
        max_ = None
    elif x.endswith('万以上/月'):
        min_,max_ = get_max_min_salary('万以上/月',10000,x)
        min_ = None
    elif x.endswith('万以下/年'):
        min_,max_ = get_max_min_salary('万以下/年',10000,x)
    else:
        min_,max_ = None,None
    return min_,max_

salary = data['salary'].apply(get_salary)
获得最高薪资和最低薪资以及平均薪资
data['salary_min'],data['salary_max'] = salary.str[0],salary.str[1]
data['salary_mean'] = (data['salary_min']+data['salary_max'])/2.0
平均薪资描述

对行业industry数据进行处理
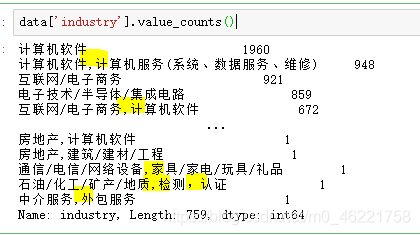
看一下数据属性,该数据是以‘,’进行分割的,这里取其第一个作为默认行业
data['industry_']=data['industry'].apply(lambda x:x.split(',')[0])
对最高学历进行处理
从data[‘experience_education’]中对学历进行提取,用re提取常见的学历要求
import re
def education(x):
    try:
        return re.findall('本科|大专|应届|在校|硕士|博士',x)[0]
    except:
        return None

data['education'] = data['experience_education'].apply(education)
对job_describe进行处理
从data[‘job_describe’]中提取相关技能,对技能要求进行分析,同样采用re提取,提取后转换成集合,去除重复的技术。
def describe(x):
    try:
        return set(re.findall('([A-Z|a-z\+?]+)',x))
    except:
        return None
data['technology'] = data['job_describe'].apply(describe)
data[‘technology’]处理后值如图
![]()
数据分析与数据可视化
城市岗位数据分布
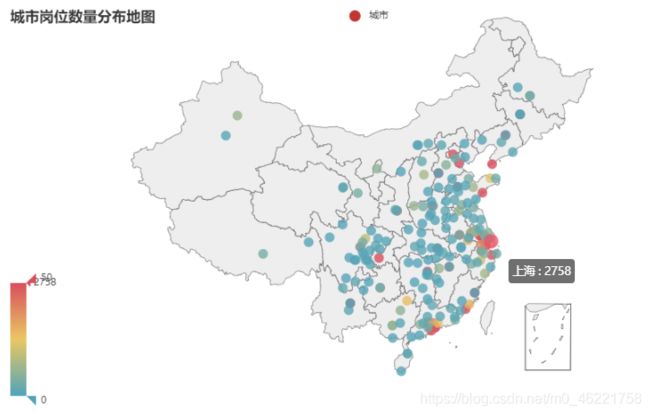
对xx省数据给予去‘省’保留,并查看城市是否能在地图上获取,获取城市-岗位数量数据
import pyecharts.charts as chart
import pyecharts.options as opt

city_data = []
count = data['city'].value_counts()
for index in count.index:
    ind = index.replace('省','')
    if chart.Geo().get_coordinate(ind):
        city_data.append([ind,int(count[index])])
map_ = (
    chart.Geo()
    .add_schema(maptype='china')
    .add('城市',city_data)
    .set_series_opts(label_opts=opt.LabelOpts(is_show=False))
    .set_global_opts(title_opts=opt.TitleOpts(title='城市岗位数量分布地图'),
                    visualmap_opts=opt.VisualMapOpts(min_=0,max_=30))
)
map_.render('./echarts/job51_map.html')
上图颜色越红,城市岗位数量约多,主要分布在一线城市北京、上海、广州、深圳、杭州等一线城市和新一线城市。
行业、公司规模、公司类型分布
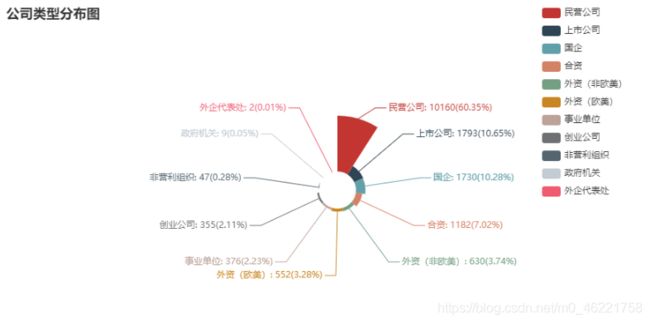
公司类型分布饼图
company_type_data = []
count = data['company_type'].value_counts()
for index in count.index:
    company_type_data.append((index,int(count[index])))

pie = (
    chart.Pie()
    .add('',company_type_data,radius=["10%","40%"],rosetype='area')
    .set_global_opts(title_opts=opt.TitleOpts(title='公司类型分布图'),
                    legend_opts=opt.LegendOpts(pos_left="80%", orient="vertical"))
    .set_series_opts(label_opts=opt.LabelOpts(formatter='{b}: {c}({d}%)'))
)
pie.render('./echarts/job51_pie_company_type.html')
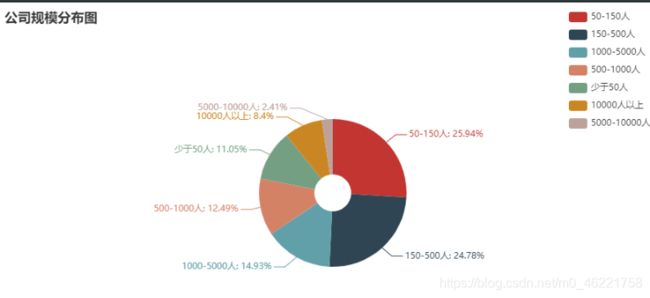
company_scale_data = []
count = data['company_scale'].value_counts()
for index in count.index:
    company_scale_data.append((index,int(count[index])))

pie2 = (
    chart.Pie()
    .add('',company_scale_data,radius=["10%","40%"])
    .set_global_opts(title_opts=opt.TitleOpts(title='公司规模分布图'),
                     legend_opts=opt.LegendOpts(pos_left="85%", orient="vertical"))
    .set_series_opts(label_opts=opt.LabelOpts(formatter='{b}: {d}%'))
)
pie2.render('./echarts/job51_pie_company_scale.html')
公司行业分布饼图
company_industry_data = []
count = data['industry_'].value_counts()
for index in count.index:
    company_industry_data.append((index,int(count[index])))

pie3 = (
    chart.Pie(init_opts=opt.InitOpts(width='800px',height='600px'))
    .add('',company_industry_data,radius=["10%","40%"],rosetype='area')
    .set_global_opts(title_opts=opt.TitleOpts(title='公司类型分布图'),
                    legend_opts=opt.LegendOpts(type_='scroll',pos_left="5%",pos_bottom='5%',orient="horizontal"))
    .set_series_opts(label_opts=opt.LabelOpts(formatter='{b}: {c}({d}%)'))
)
pie3.render('./echarts/job51_pie_industry_type.html')
从公司类型来看,民营企业占据大部分,其次是上市公司。在公司规模分布图中,可以看出中小型企业占据大多数。从公司行业上看,岗位需求设计各行各业,但传统计算机行业计算机软件、互联网/电子商务等对岗位需求量要高于非计算机行业。
岗位日发布量及薪资
对预处理错误的数据进行修正
from datetime import datetime
def change_time(x):
    if datetime.strptime(x,'%Y-%m-%d')>datetime.now():
        x = x.replace('2020','2019')
    return x
 data['pubdate'] = data['pubdate'].apply(change_time)#发布时间有错误,需要做一下修正
data['job_name']=data['job_name'].replace('AI','人工智能')#岗位名统一
利用pandas 对数据进行处理,获得目标数据表d3
x_date = data['pubdate'].sort_values().unique().tolist()
salary_mean = data[['pubdate','salary_mean','job_name']].groupby(['pubdate','job_name']).mean()['salary_mean']
job_num = data[['pubdate','salary_mean','job_name']].groupby(['pubdate','job_name']).count()['salary_mean']

date_job_salary ={
     'job_num':[],'salary_mean':[]}
for date in x_date:
    for job in set(data['job_name'].values):
        index = (date,job)
        try:
            salary = salary_mean[index]
            number = job_num[index]
            date_job_salary['job_num'].append((date,job,int(number)))
            date_job_salary['salary_mean'].append((date,job,float(salary)))
        except:
            date_job_salary['job_num'].append((date,job,None))
            date_job_salary['salary_mean'].append((date,job,None))
d1 = pd.DataFrame(date_job_salary['job_num'],columns=['date','job','number'])
d2 = pd.DataFrame(date_job_salary['salary_mean'],columns=['date','job','salary_mean'])
d3 = pd.merge(d1,d2)
bar3d = (
    chart.Bar3D(init_opts=opt.InitOpts(width='1200px',height='1000px'))
    .add('',date_job_salary['job_num'],
        xaxis3d_opts=opt.Axis3DOpts(type_="category",name='日期'),
        yaxis3d_opts=opt.Axis3DOpts(interval=0,type_="category",name='职位'),
        zaxis3d_opts=opt.Axis3DOpts(interval=0,type_="value",name='日发布数量'))
    .set_global_opts(title_opts=opt.TitleOpts(title='各类职位日发布数量'),
                     legend_opts=opt.LegendOpts(type_='scroll'),
                    visualmap_opts=opt.VisualMapOpts(max_=job_num.max()))
)
bar3d.render('./echarts/job51_job_num_3d.html')
各岗位日发布平均薪资折线图
dt_job = {
     }
dt_salary = {
     }
for job in set(data['job_name'].values):
    dt_job[job] = d3[d3['job']==job][['date','number']].dropna(axis=0)
    dt_salary[job] = d3[d3['job']==job][['date','salary_mean']].dropna(axis=0)

#薪资保留两位小数
def ceil_(x):
    return round(x,2)
line = (
chart.Line(init_opts=opt.InitOpts(width='1200px',height='1000px'))
    .add_xaxis(xaxis_data=x_date)
    .add_yaxis('图像处理',y_axis=dt_salary['图像']['salary_mean'].apply(ceil_).tolist(),
              linestyle_opts=opt.LineStyleOpts(width=2))
    .add_yaxis('语音识别',y_axis=dt_salary['语音']['salary_mean'].apply(ceil_).tolist(),
              linestyle_opts=opt.LineStyleOpts(width=2))
    .add_yaxis('机器学习',y_axis=dt_salary['机器学习']['salary_mean'].apply(ceil_).tolist(),
              linestyle_opts=opt.LineStyleOpts(width=2))
    .add_yaxis('深度学习',y_axis=dt_salary['深度学习']['salary_mean'].apply(ceil_).tolist(),
              linestyle_opts=opt.LineStyleOpts(width=2))
    .add_yaxis('大数据',y_axis=dt_salary['大数据']['salary_mean'].apply(ceil_).tolist(),
              linestyle_opts=opt.LineStyleOpts(width=2))
    .add_yaxis('人工智能',y_axis=dt_salary['人工智能']['salary_mean'].apply(ceil_).tolist(),
              linestyle_opts=opt.LineStyleOpts(width=2))
    .add_yaxis('数据分析',y_axis=dt_salary['数据分析']['salary_mean'].apply(ceil_).tolist(),
              linestyle_opts=opt.LineStyleOpts(width=2))
    .add_yaxis('算法',y_axis=dt_salary['算法']['salary_mean'].apply(ceil_).tolist(),
              linestyle_opts=opt.LineStyleOpts(width=2))
    .add_yaxis('自然语言处理',y_axis=dt_salary['自然语言处理']['salary_mean'].apply(ceil_).tolist(),
              linestyle_opts=opt.LineStyleOpts(width=2))
    .set_global_opts(title_opts=opt.TitleOpts(title='各岗位日发布平均薪资')
                     ,xaxis_opts=opt.AxisOpts(name='日期'),
                    yaxis_opts=opt.AxisOpts(name='薪资(元/月)'),
                    datazoom_opts=[opt.DataZoomOpts(),opt.DataZoomOpts(type_='inside')])
)
line.render('./echarts/job51_date_salary_mean.html')
全部岗位

只看图像处理

从各岗位发布平均薪资来看,四月之前,各岗位的薪资波动较频繁,四月后没有较大幅度的波动,这与国内疫情控制情况相关。
各岗位日发布数量
bar3 = (
chart.Bar(init_opts=opt.InitOpts(width='1200px',height='1000px'))
    .add_xaxis(xaxis_data=x_date)
    .add_yaxis('图像处理',dt_job['图像']['number'].tolist())
    .add_yaxis('语音识别',dt_job['语音']['number'].tolist())
    .add_yaxis('机器学习',dt_job['机器学习']['number'].tolist())
    .add_yaxis('深度学习',dt_job['深度学习']['number'].tolist())
    .add_yaxis('大数据',dt_job['大数据']['number'].tolist())
    .add_yaxis('人工智能',dt_job['人工智能']['number'].tolist())
    .add_yaxis('数据分析',dt_job['数据分析']['number'].tolist())
    .add_yaxis('算法',dt_job['算法']['number'].tolist())
    .add_yaxis('自然语言处理',dt_job['自然语言处理']['number'].apply(ceil_).tolist())
    .set_global_opts(title_opts=opt.TitleOpts(title='各岗位日发布量')
                     ,xaxis_opts=opt.AxisOpts(name='日期'),
                    yaxis_opts=opt.AxisOpts(name='岗位数量'),
                    datazoom_opts=[opt.DataZoomOpts(),opt.DataZoomOpts(type_='inside')])
)
bar3.render('./echarts/job51_date_job_num.html')
岗位整体日发布量

可以看出总体岗位量在五一前后增长较大。
只看大数据

学历薪资关系
dt_education = data[['salary_mean','education']].groupby('education').mean()

x_data_e = dt_education.index.tolist()
y_data_e = np.around(dt_education.values,2).tolist()
line_ed=(
    chart.Line(init_opts=opt.InitOpts(width='1000px',height='800px'))
    .add_xaxis(xaxis_data=x_data_e)
    .add_yaxis('最高学历平均薪资',y_data_e,linestyle_opts=opt.LineStyleOpts(width=2))
    .set_global_opts(title_opts=opt.TitleOpts(title='最高学历平均薪资水平'),
                     xaxis_opts=opt.AxisOpts(name='最高学历'),
                    yaxis_opts=opt.AxisOpts(name='薪资(元/月)'))
)
line_ed.render('./echarts/job51_education_salary.html')
公司规模薪资水平
dt_scale = data[['salary_mean','company_scale']].groupby('company_scale').mean()
x_data_e = dt_education.index.tolist()
y_data_e = np.around(dt_education.values,2).tolist()
line_ed=(
    chart.Line(init_opts=opt.InitOpts(width='1000px',height='800px'))
    .add_xaxis(xaxis_data=x_data_e)
    .add_yaxis('最高学历平均薪资',y_data_e,linestyle_opts=opt.LineStyleOpts(width=2))
    .set_global_opts(title_opts=opt.TitleOpts(title='最高学历平均薪资水平'),
                     xaxis_opts=opt.AxisOpts(name='最高学历'),
                    yaxis_opts=opt.AxisOpts(name='薪资(元/月)'))
)
line_ed.render('./echarts/job51_education_salary.html')

各类规模公司薪资水平基本持平,千人以上的大厂工资相对要搞一点。
专业技能分析
对技能进行统一名称、规整,并用Counter方法保留前25个。
from collections import Counter
techno = []
for te in data['technology']:
    if te:
        tec =[]
        for t in te:
            tec.append(t.upper())
        techno.extend(list(tec))
cnt = Counter(techno)
tech_data = cnt.most_common(25)
绘制饼图
pie4 = (
    chart.Pie(init_opts=opt.InitOpts(width='1000px',height='800px'))
    .add('',tech_data,radius=["10%","40%"],rosetype='radius')
    .set_global_opts(title_opts=opt.TitleOpts(title='公司类型分布图'),
                    legend_opts=opt.LegendOpts(type_='scroll',pos_left="5%",pos_bottom='5%',orient="horizontal"))
    .set_series_opts(label_opts=opt.LabelOpts(formatter='{b}: {c}({d}%)'))
)
pie4.render('./echarts/job51_pie4_technology.html')

可以看出python在相关岗位上的要求量最高,其次是C++、C、JAVA、以及大数据相关技术HADOOP 、SPARK等,在相关岗位上,对LINUX操作系统、mysql数据库(SQL语言)也要较多的要求。
项目数据及代码链接:欢迎下载
