吴恩达机器学习课后作业_线性回归实现
照着bilibili上,一位小姐姐?的ng机器学习课后作业系列视频,细节讲的真的很到位,get到了很多基础知识。传送门
目录
一、单变量线性回归
二、多变量线性回归
1单变量线性回归
根据城市的人口数量,预测获利情况。
1、加载数据集
import numpy as np
import pandas as pd
import matplotlib.pyplot as plt
%matplotlib inline

data = pd.read_csv('./ex1data1.txt', names=['population', 'profit'])
# names=['population', 'profit'] 给数据集的列添加标题

# 查看数据信息
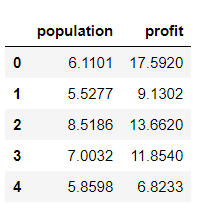
data.head() # 前5行
# print(data.tail())  # 最后5行
# print(data.describe())  # 方差、均值等统计
# print(data.info())  # 信息

# 可视化数据集
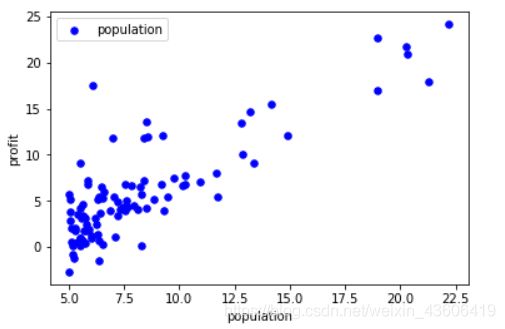
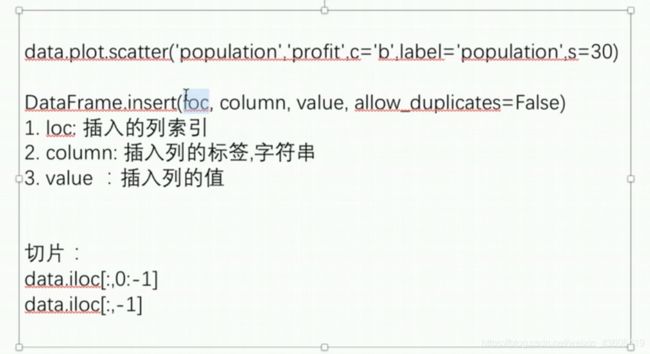
data.plot.scatter('population', 'profit', c='b', label='population', s=30)
# 颜色为蓝色、s代表样本点的大小
plt.show()
2、构造数据集
# 加入特征列 x0 = 1
data.insert(0, 'ones', 1)  # 要插入的位置,标签(字符串),数值
# print(data.head())

# 获取特征与标签
x = data.iloc[:, 0:-1]
# print(x.head())

# print(type(x))
#

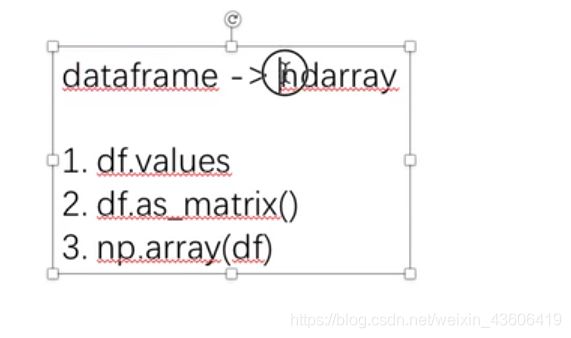
x = x.values   # 类型转换,便于用numpy计算

# print(type(x))
#
# print(len(x))
# print(x.shape)  # (97, 2)

y = data.iloc[:, -1].values
# print(y.shape)  # (97,)  一维数组
y = y.reshape(-1, 1)
# print(y.shape)  # (97, 1)  二维数组,很重要
3. 损失函数
def costFunction(x, y, theta):
    inner = np.power(x @ theta - y, 2)  # 矩阵相乘 @ 或者用np.dot(a, b)
    return np.sum(inner) / (2 * len(x))

# 初始化参数为0
theta = np.zeros((2, 1))      # (97, 2)  *  (2, 1)  =  (97,1)

# 计算初始的代价函数
cost_init = costFunction(x, y, theta)
print(cost_init)
运行结果:
32.072733877455676
4. 梯度下降
def tD(x, y, theta, al, iters, is_plot=False):

    costs =[]  # 存放每一次迭代的cost值
    for i in range(iters):
        theta = theta - al/len(x) * (x.T @ (x @ theta - y))
        cost = costFunction(x, y, theta)
        costs.append(cost)

        if i % 100 == 0:
            if is_plot:
                print(cost)

    return theta, costs
5 可视化梯度下降
# 学习率
al = 0.02

# 迭代次数
iters = 2000

fig, ax = plt.subplots()
# fig 表示整个图
# ax表示实例化的对象

theta_final, costs = tD(x, y, theta, al, iters)

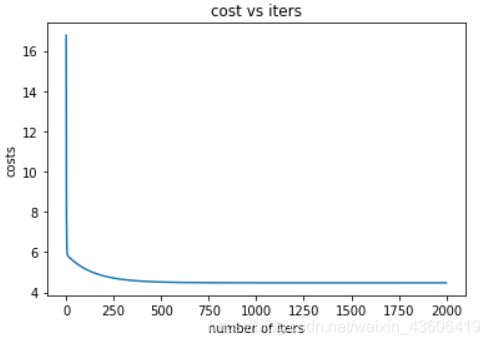
# 6、可视化 损失函数
ax.plot(np.arange(iters), costs)

ax.set(xlabel='number of iters',
       ylabel='costs',
       title='cost vs iters')
plt.show()
补充知识点3:
如图,fig代表整个图,ax代表实例化的对象,ax1为左上角ax[0,0]

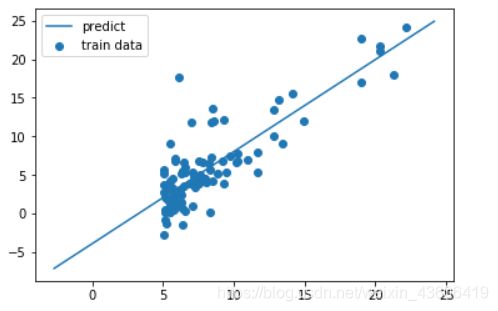
6 拟合情况可视化
a = np.linspace(y.min(), y.max(), 100)
# 利用得到的最优参数,拟合曲线
y_pred = theta_final[0, 0] + theta_final[1, 0] * a

fig, ax = plt.subplots()
# 真实样本
ax.scatter(x[:, 1], y, label='train data')
# 预测结果
ax.plot(a, y_pred, label='predict')
ax.legend()
plt.show()
2 多变量线性回归
两个特征 sizes、bedrooms,预测 price of house
1、加载数据集
import numpy as np
import pandas as pd
import matplotlib.pyplot as plt
%matplotlib inline

data = pd.read_csv('./ex1data2.txt', names=['sizes', 'bedrooms', 'prices'])
data.head()
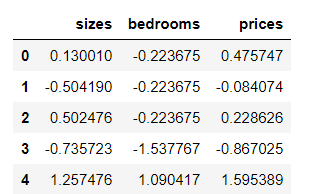
2、数据标准化
data = (data - data.mean()) / data.std()
#  对每一列求均值、标准差
data.head()
3、构造数据集
# 添加一列,作为 特征x0,对应 参数theta0
data.insert(0,'ones',1) # 添加列的位置(最左边) 添加的列的名字(字符串 ones) 参加的值 1
data.head()
# 提取特征与标签
X = data.iloc[:, 0:-1]
y = data.iloc[:, -1]

X = X.values
y = y.values
type(y)
print(X.shape)
print(y.shape)

(47, 3)
(47,)
4. 损失函数
# 损失函数
def cost_function(X, y, theta):
    inner = np.power(X @ theta - y, 2)
    return np.sum(inner) / (2 * len(X))

# 初始化 tehta0 tehta1
theta = np.zeros((3,1))
cost_init = cost_function(X, y, theta)
cost_init
5. 梯度下降
# 梯度下降
def tD(X, y, theta, al, iters, is_plot=False):

    costs =[]  # 利用 costs 可视化
    for i in range(iters):
        theta = theta - al/len(X) * (X.T @ (X @ theta - y))
        cost = cost_function(X, y, theta)
        costs.append(cost)

        if i % 100 == 0:
            if is_plot:
                print(cost)

    return theta, costs
6.不同学习率对比
n_al = [0.003, 0.03, 0.001, 0.01]
iters = 2000

fig, ax = plt.subplots()
for al in n_al:
    theta_final, costs = tD(X, y, theta, al, iters)

    ax.plot(np.arange(iters), costs, label=al)
    ax.legend()

ax.set(xlabel='number of iters',
       ylabel='costs',
       title='cost vs iters')
plt.show()
