vue中echarts实现水球动画图
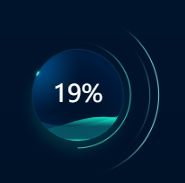
实现如上图样式
思路:把后面图片用背景图片写入 中间水球图使用echarts中的liquidFill
由于自己是在vue中使用的 首先要用npm安装
npm i echarts-liquidfill -s
在页面引用
import "echarts-liquidfill";//html模块
//css模块
.carLeft{
width: 1.4rem;
height: 1.66rem;
margin-right: 0.24rem;
margin-top: 0.24rem;
background: url(../assets/image/carBg.png) no-repeat;
background-size: 100%;
position: relative;
.carCharts{
position: absolute;
top: 0.26rem;
left: .13rem;
width: .9rem;
height: .9rem;
// left: 0.1rem;
}
}
//js模块
var myChart = echarts.init(this.$refs.carCharts);
const echartsData = [40, 60];
var option = {
waveLength:'100%',
// x轴
xAxis:{
show:false, // 不显示
},
// y轴
yAxis: {
show:false, // 不显示
},
grid:{
top:'2.5%',
right:'40',
bottom:'2.5%',
left:0,
},
series: [{
type: 'liquidFill',
radius: '100%', // 半径大小
center: ['50%', '50%'], // 布局位置
waveLength:'150',
data:echartsData, // 水球波纹值
//根据设计设置水波球背景颜色为透明
backgroundStyle: {
color: 'rgba(255,255,255,0)',
},
outline: { // 轮廓设置 不展示
show: false
},
itemStyle: {
//设置水球波动的渐变颜色
color: {
type: 'linear',
x: 0,
y: 0,
x2: 0,
y2: 1,
colorStops: [{
offset: 1,
color: 'rgba(23,242,206, .65)'
}, {
offset: 0.9,
color: 'rgba(23,242,206, .15)'
},{
offset: 0.4,
color: 'rgba(23,242,206, .15)'
},{
offset: 0,
color: 'rgba(12,255,215,1)'
}],
globalCoord: false
}
},
//水球中间展示字体及颜色
label:{
normal:{
textStyle: {
fontSize: 24,
color:'#fff',
fontWeight:400,
formatter: '',
}
}
}
}]
};
myChart.clear();
myChart.resize();
myChart.setOption(option);