tensorboard可视化实例
tensorboard可视化实例
“针对tensorflow1.x版本”
e.g.1:对于一个简单的加法而言:
import tensorflow as tf
a = tf.constant([1.0,2.0,3.0],name='input1')
b = tf.Variable(tf.random_uniform([3]),name='input2')
add = tf.add_n([a,b],name='addOP')
with tf.Session() as sess:
    sess.run(tf.global_variables_initializer())
    writer = tf.summary.FileWriter("./tflogs",sess.graph)
    print(sess.run(add))
writer.close()
结果如图
e.g.2:
输入层(1 个神经元),隐藏层(10 神经元),输出层(1 个神经元),来拟合一个二次函数曲线 y = x^2 − 0.5
# -*- coding: utf-8 -*-
import tensorflow as tf
import numpy as np
import matplotlib.pyplot as plt

#构建满足一元二次方程的函数
x_data = np.linspace(-1, 1, 300)[:, np.newaxis]
noise = np.random.normal(0, 0.05, x_data.shape)
y_data = np.square(x_data) - 0.5 + noise
# 看一下分布如何
plt.plot(x_data, y_data, 'ro')
plt.show()
def add_layer(inputs,in_size,out_size,n_layer,activation_function = None):
    # add one more layer and return the output of this layer
    layer_name = 'layer%s' % n_layer
    with tf.name_scope(layer_name):
        with tf.name_scope('weights'):
            Weights = tf.Variable(tf.random_normal([in_size,out_size]),name="W")
            tf.summary.histogram(layer_name+'/home/april/PycharmProjects/untitled/tflogs2/weights',Weights)
        with tf.name_scope('biases'):
            biases = tf.Variable(tf.zeros([1, out_size]) +0.1, name='b')
            tf.summary.histogram(layer_name + '/home/april/PycharmProjects/untitled/tflogs2/biases', biases)
        with tf.name_scope('Wx_plus_b'):
            Wx_plus_b = tf.add(tf.matmul(inputs,Weights), biases)
        if activation_function is None:
            outputs = Wx_plus_b
        else:
            outputs = activation_function(Wx_plus_b, )
            tf.summary.histogram(layer_name + '/home/april/PycharmProjects/untitled/tflogs2/outputs', outputs)
    return outputs
显示loss函数
# 构建隐藏层,假设隐藏层有 10 个神经元
l1 = add_layer(xs, 1, 10, n_layer=1, activation_function=tf.nn.relu)
# 构建输出层,假设输出层和输入层一样,有 1 个神经元
prediction = add_layer(l1, 10, 1, n_layer=2, activation_function=None)
# 构建损失函数
with tf.name_scope('loss'):
    loss = tf.reduce_mean(tf.reduce_sum(tf.square(ys - prediction), reduction_indices=[1]))
    tf.summary.scalar('loss', loss)
train_step = tf.train.GradientDescentOptimizer(0.1).minimize(loss)
也要记录日志
# 初始化所有变量
init = tf.global_variables_initializer()
sess = tf.Session()
merged = tf.summary.merge_all()
writer = tf.summary.FileWriter("/home/april/PycharmProjects/untitled/tfpics/", sess.graph)
sess.run(init)
for i in range(1000): # 训练 1000 次
    sess.run(train_step, feed_dict={
     xs: x_data, ys: y_data})
    if i % 50 == 0:  # 每 50 次打印出一次损失值
        result = sess.run(merged, feed_dict={
     xs: x_data, ys: y_data})
        writer.add_summary(result, i)
        # print(sess.run(loss, feed_dict={xs: x_data, ys: y_data}))
最后显示结果为
loss:
 网络结构图:

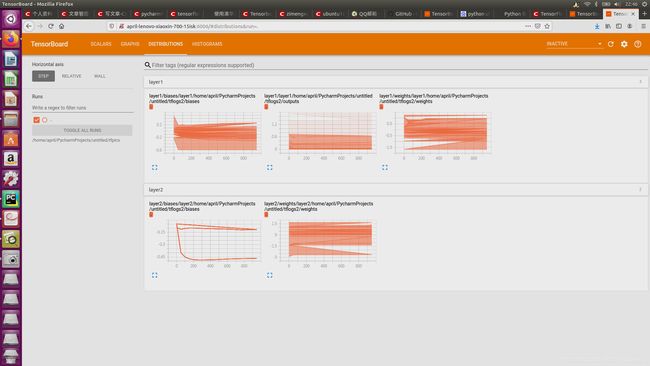
DISTRIBUTIONS 面板和 HISTOGRAMS 面板所用到的数据源相同,只是从不同的视角、不同的方式表征数据的情况。


