卢彦的利用xml实现通用web报表打印
采用Crystal Report是一种大型报表系统常用和推荐的解决方案,但是如果我们只需要进行一些小规模的报表打印的话,Crystal Report则显得庞大麻烦了一点,可定制性也不太好,它的打印实际上也是利用了IE的打印功能,也不能精确控制打印效果,而且需要您对它进行注册。
所以我们这里讨论的是另外一种办法,简单来说,如果您有下列需求中的任何一条,那么就可以尝试采用本方案。
方案适用性
1. 远程数据打印。需要打印的数据并不在本地,必须进行远程读取。
2. 需要精确控制打印效果,包括页面格式,分页,附加条目,表格等。
3. 出于安全性考虑,不能直接连接到数据库。
方案原理
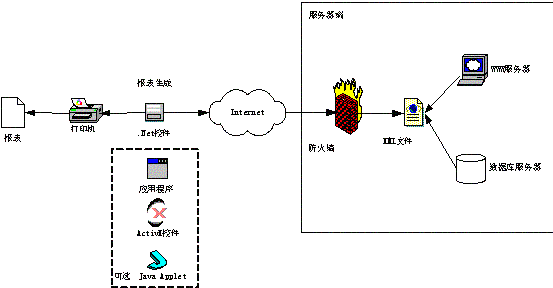
其实原理很简单,通过XML强大的自定义功能,我们便能方便的自定义出我们所有需要的格式控制标签,在服务器端进行动态编码后通过WEB服务器传到客户端,然后在客户端进行格式解析,根据服务器端定义的打印格式从客户端直接控制打印机打印出我们需要的报表。
技术选择
由于报表打印比较复杂,为了能够精确控制打印格式,不能采用WEB浏览器页面打印的方式进行报表打印工作,只能采取自编程控制客户端的打印工作。由于.NET framework的winform可以直接嵌入到网页中,我们在这里选用了该技术,但是请注意,我这么做并不代表.NET winform是唯一的选择,其实您可以采用任何客户端代替它,例如Java Applet或者ActiveX,甚至是一个普通的应用程序都能行。
不允许直接连接到数据库,因此只能采用XML文件进行中间数据交换格式,通过普通WEB服务器的默认80端口进行数据传输。事实上,我简直找不到其它更理想的方案了,当然,web service也许能算是一种,但是它采用的是SOAP传输数据,从原理上看,应该和我们采用的XML属于同种类技术。
再补充说明一下我为什么要采用.NET编写的受控组件,优点在于:
1. 它不需要进行客户端注册。相对于ActiveX的一个大优点。
2. 比ActiveX安全性高。在.NET Common Language Runtime的控制之下运行
3. 编写方便。我喜欢C#和Visual Studio .NET。
4. 有很强大的打印控制功能。利用.NET framework类库。
5. 直接支持XML技术。
6. 和IE兼容性高。同为Microsoft公司产品。
另外,需要注意一点就是,在.NET framework sp1和sp2中默认的安全级别是不能直接运行受控组件的,但是在.NET framework 1.1 beta中又改了回来,可以直接运行了。
服务器端您则可以采用现有的服务器系统和数据库,不需要新添加任何新硬件设备和新的.NET服务器管理人员,他们往往是些要求拿高薪的家伙。 :)
服务器的工作流程为:
1. 接受客户端的标准XML模版查询。
2. 需要根据查询要求将数据库数据格式转换成标准的XML数据格式。
3. 将XML数据通过80端口发送出去。
可行性分析
由于现在的大部分数据库都支持XML格式的数据查询和转换,如SQL Server 2000,Oracle 9i,IBM DB2等大型关系型数据库。只需要通过简单的设置就能直接进行XML数据转换工作。如果数据库不能支持直接XML数据转换,也可以籍由一些服务器端脚本程序进行脚本转换工作,比如JSP,ASP,PHP等等。
客户端也不需要任何特殊的设置工作,仅需要安装一个大小为21M的.NET framework分发包,然后直接打开网页就可以进行工作。也没有操作系统限制,从windows 98到windows xp都能很好的支持。
伸缩性和安全性
伸缩性
由于采用的是XML标准数据格式作为中间数据交换,因此本解决方案具有非常好伸缩性,例如,客户端的.NET控件可以采用JAVA APPLET、ACTIVX或者是VB,VC等编写的客户端应用程序直接替换。服务器也可以任意选择采用IIS或APACHE等WEB服务器。数据库也可以采用任意一种数据库。包括SQL Server,Oracle或者是Access等。这点上文已经谈到过,因为文章的长一点并不会使送给我的T恤大一号,这里再强调一遍只是为了加深读者对XML的跨平台性的认识。 :)
安全性
由于采用的是普通WEB服务器传送数据,因此可以直接采用SSL安全套接字等已经成熟的WEB加密技术。同时还可以对XML进行数据算法加密,在客户端再进行解密,保证了传输的安全性。
由于采用的是80端口,不需要再另外新增加专用端口,减少了安全漏洞的可能性,同时还能方便的穿过双方的的网络防火墙等保护设备。
方案设计图
格式定义
为了能自己控制打印的格式,我们定义了下列的格式标签,其中在命名上参考了HTML的命名办法,所以基本上熟悉HTML的都能一看就能明白标签的具体含义。如果您觉得这些标签的表达能力还不够强,您还可以自己定义一些更多更精确的格式标签。
标签应用示例:
| <root> <pagesetting> <Landscape>true</Landscape> <paperkind>A4</paperkind> <paperwidth>210</paperwidth> <paperheight>297</paperheight> <pageleft>0</pageleft> <pageright>0</pageright> <pagetop>0</pagetop> <pagebottom>0</pagebottom> </pagesetting> <reporttable> <text x="450" y="40" fontname="黑体" fontsize="24" fontcolor="Black" b="true" i="false" u="true">最新成交合同信息</text> <text x="70" y="100" fontname="宋体" fontsize="12" fontcolor="Black" b="true" i="false" u="true">制表时间:2002年0月10日</text> <text x="910" y="100" fontname="宋体" fontsize="12" fontcolor="Black" b="true" i="false" u="true">单位:元</text> <table x="65" y="130" border ="1" bordercolor="Black" maxlines="28"> <tablehead> <tr height="25"> <td width="90" align="center" fontname="宋体" fontsize="12" fontcolor="Black" b="true" i="false" u="false" bgcolor="White">合同号</td> <td width="90" align="center" fontname="宋体" fontsize="12" fontcolor="Black" b="true" i="false" u="false" bgcolor="White">产品名称</td> <td width="50" align="center" fontname="宋体" fontsize="12" fontcolor="Black" b="true" i="false" u="false" bgcolor="White">成交量</td> <td width="50" align="center" fontname="宋体" fontsize="12" fontcolor="Black" b="true" i="false" u="false" bgcolor="White">成交价</td> <td width="50" align="center" fontname="宋体" fontsize="12" fontcolor="Black" b="true" i="false" u="false" bgcolor="White">成交金额</td> <td width="50" align="center" fontname="宋体" fontsize="12" fontcolor="Black" b="true" i="false" u="false" bgcolor="White">挂单量</td> <td width="50" align="center" fontname="宋体" fontsize="12" fontcolor="Black" b="true" i="false" u="false" bgcolor="White">起始价</td> <td width="330" align="center" fontname="宋体" fontsize="12" fontcolor="Black" b="true" i="false" u="false" bgcolor="White">卖方</td> <td width="330" align="center" fontname="宋体" fontsize="12" fontcolor="Black" b="true" i="false" u="false" bgcolor="White">买方</td> </tr> </tablehead> <tablebody> <tr height="25"> <td width="100" align="left" fontname="宋体" fontsize="12" fontcolor="Black" b="true" i="false" u="false" bgcolor="White">20021010015</td> <td width="100" align="left" fontname="宋体" fontsize="12" fontcolor="Black" b="true" i="false" u="false" bgcolor="White">CNR</td> <td width="70" align="left" fontname="宋体" fontsize="12" fontcolor="Black" b="true" i="false" u="false" bgcolor="White">93</td> <td width="70" align="left" fontname="宋体" fontsize="12" fontcolor="Black" b="true" i="false" u="false" bgcolor="White">6680</td> <td width="70" align="left" fontname="宋体" fontsize="12" fontcolor="Black" b="true" i="false" u="false" bgcolor="White">621240</td> <td width="70" align="left" fontname="宋体" fontsize="12" fontcolor="Black" b="true" i="false" u="false" bgcolor="White">93</td> <td width="70" align="left" fontname="宋体" fontsize="12" fontcolor="Black" b="true" i="false" u="false" bgcolor="White">6680</td> <td width="200" align="left" fontname="宋体" fontsize="12" fontcolor="Black" b="true" i="false" u="false" bgcolor="White">湖北省国营新星拖拉机厂</td> <td width="200" align="left" fontname="宋体" fontsize="12" fontcolor="Black" b="true" i="false" u="false" bgcolor="White">中化国际贸易股份有限公司</td> </tr> ………. </tablebody> <tablefoot> </tablefoot> </table> </reporttable> </root> |
注意事项:
a) 如果采用服务器脚本动态生成XML文档时,发送内容类型应该设置为text/xml(普通html页面为text/html),字符编码应该为UTF-8,否则会出现编码错误问题。
b) 应该严格按照XML规定的格式来生成文件,否则XML解析器将不会予以解析。
2. 客户端
可以采用任意应用程序来读取服务器端生成的XML文件,如果采用VB、DELPHI等桌面应用软件开发工具,则可以使用MSXML的COM解析器。推荐采用.NET,内部已经集成了XML解析器,直接就可以通过使用.NET类库调用。既可以做成桌面应用程序形式,通过远程调用;也可以嵌入到IE浏览器中,直接在网页中运行。
效果示例图
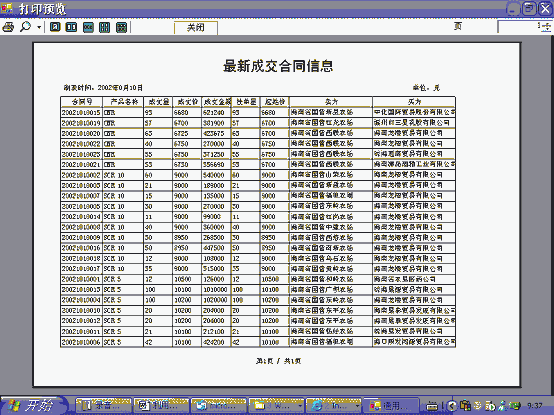
打印预览
注意事项:
1. 如果采用.NET,客户端必须先安装.NET framework1.0运行环境,下载地址为:http://download.microsoft.com/download/.NETframesdk/Redist/1.0/W98NT42KMeXP/EN-US/dotnetredist.exe
2. 如果采用嵌入到网页中的形式,那么本程序需要编译成一个控件形式(一个扩展名为dll的文件),然后在网页中插入以下标记:
<object id="print" classid="http:print.dll#Print.UserControl1" Width="728" Height="460"></object>
将控件嵌入到一个静态或动态网页中。然后将该控件文件拷贝到和该网页相同的目录中(标记中Print.dll为生成的控件文件名,Print.UserControl1为该控件的命名空间NAMESPACE)。
.Net Web控件方案的实现和扩充
软件原理:
该软件的原理其实很简单,就是要方便的解析出定义好的XML格式标记,解读出文件中标记的参数定义,最后将这些信息还原成打印机输出的图形格式。
为了能表达出复杂的报表样式,我们需要定义一些标记,在这些标记中附加上具体的样式信息,作用类似HTML的标签,而我们的解析程序就相当于IE浏览器,所不同的是IE将图形输出到屏幕,而我们是将图形输出到打印机,由于打印机相对于显示屏的特殊性(例如分页),因此我们不能直接采用网页浏览器的标签解析功能来打印,需要自己来做一个满足需要的"打印浏览器"。
针对大多数报表的功能需要,我只定义了两种格式标签:文本(text)和表格(table),它们的具体属性定义和另外一些设置性的标签定义请参考前文,这里再补充一幅结构图帮助读者理解。如下所示: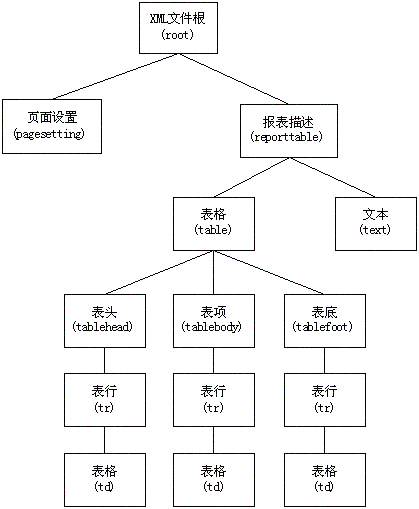
结构设计:
为了描述所有的样式标记,我先定义了一个抽象基类PrintElement,它拥有一个虚拟方法Draw,然后对应表格和文本,从PrintElement派生出两个子类,分别是Table和Text,我还创建了一个Parser类用来解析不同的样式标记和创建对应的对象,它拥有一个静态的方法CreateElement,用来根据不同的格式标签创建出对应的对象。结构图如下所示: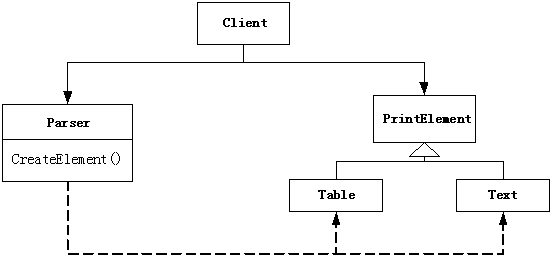
读过《设计模式》的读者一定已经看出来了,这种设计应用了设计模式中的一个非常著名的模式:Abstract Factory。这里使用该模式的好处就是让标签对象和解析器都独立出来,降低了系统的耦合度,有利于今后在需要的时候可以很容易的增加其它的格式标签(下文将会举一个实例)和方便的更换不同的用户界面(图中Client表示Windows应用程序或者是网页插件)。
代码实现:
首先,创建一个"Windows控件库"的新项目,在项目名称处写入RemotePrint,如下图所示: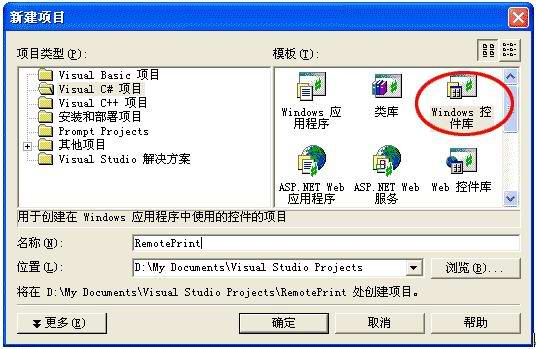
然后把新建项目中的那个默认的UserControl1类,它的构造函数名和文件名都改成PrintControl。再将它的背景颜色设置为白色,添加三个按纽,并将它们的Enable属性都设置为false,Anchor属性设置为Bottom, Right,再添加一个Label控件用来显示程序状态,它的Anchor属性设置为Left。如下图所示:
再从控件栏中拖入三个打印对象:PrintDocument, PageSetupDialog, PrintPreviewDialog,如下图所示:
将其中的pageSetupDialog1和printPreviewDialog1的Document属性均设置为printDocument1。
然后为项目添加一个PrintElement的新类,代码如下:
| using System; namespace RemotePrint public virtual bool Draw(Graphics g) |
该类中只有一个虚拟方法Draw,注意它规定需要返回一个bool值,这个值的作用是用来指示标签是否在页内打印完毕。
然后再添一个Table的新类,代码如下:
| using System; namespace RemotePrint public Table(XmlNode Table) public override bool Draw(Graphics g) if(count < table["tablebody"].ChildNodes.Count - 1) private void DrawTopLine(Graphics g, XmlNode table) file://画表格行 file://画单元格 |
Table类将table标签内部的解析和打印独立出来,全部在类的内部完成,这样,我们在对顶层标签解析的时候只要是碰到table标签就直接交给Table类去完成,不需要再关心其实现细节。
再添加一个Text类,代码如下:
| using System; namespace RemotePrint |
同Table类一样,Text类完成对text标签的解析和打印,不过因为text的简单性,它的代码也少了很多。它们两者同样继承自PrintElement,都重载了Draw方法的实现
最后,我们还需要一个解析器用来解析顶层的标签和生成相应的对象,它在此模式中的作用就是一个"工厂类",负责生产出用户需要的"产品"。代码如下:
| using System; namespace RemotePrint |
好了,核心的解析和标签的具体打印方法已经完成了,现在我们回到PrintControl中编写一些代码来测试我们的成果。
首先,需要引用两个要用到的名称空间:
| using System.Xml; using System.Drawing.Printing; |
然后,在打印之前,需要根据XML文件中的pagesetting标签来设置一下打印机的页面,所以我们先写一个方法来设置打印机。在PrintControl类中增加一个私有的方法:
| private void SettingPrinter(XmlNode ps) { file://打印方向(纵/横) this.printDocument1.DefaultPageSettings.Landscape = bool.Parse(ps["landscape"].InnerText); file://设置纸张类型 string papername = ps["paperkind"].InnerText; bool fitpaper = false; file://获取打印机支持的所有纸张类型 foreach(PaperSize size in this.printDocument1.PrinterSettings.PaperSizes) { if(papername == size.PaperName)//看该打印机是否有我们需要的纸张类型 { this.printDocument1.DefaultPageSettings.PaperSize = size; fitpaper = true; } } if(!fitpaper) { file://假如没有我们需要的标准类型,则使用自定义的尺寸 this.printDocument1.DefaultPageSettings.PaperSize = new PaperSize("Custom", int.Parse(ps["paperwidth"].InnerText), int.Parse(ps["paperheight"].InnerText)); } } |
接下来,我们类中添加一个XmlDocument的对象和一个静态变量计算页码:
| private XmlDocument doc = new XmlDocument(); public static int Pages = 1; |
然后再控件的Load事件中为该对象加载XML报表数据,代码如下:
| private void PrintControl_Load(object sender, System.EventArgs e) { try { file://装载报表XML数据 this.label1.Text = "正在加载报表数据,请稍侯..."; doc.Load("http://localhost/report.xml"); this.label1.Text = "报表数据加载完毕!"; this.button1.Enabled = this.button2.Enabled = this.button3.Enabled = true; } catch(Exception ex) { this.label1.Text = "出现错误:" + ex.Message; } } |
请注意,我们这里只是装入了一个本地的测试数据文件,其实,完全可以改成装载网络上任何地方的静态或者动态的XML文件,例如以上的doc.Load("http://localhost/report.xml")可以改写成:
doc.Load("http://www.anywhere.com/report.xml");
doc.Load("http://www.anywhere.com/report.asp");
doc.Load("http://www.anywhere.com/report.jsp?date=xxx");
等等,只要装载的数据是符合我们规定的XML数据文档就可以。
然后在控件的构造函数中加入打印事件的委托:
| public PrintControl() { InitializeComponent(); this.printDocument1.PrintPage += new PrintPageEventHandler(this.pd_PrintPage); } |
该委托方法的代码如下:
| private void pd_PrintPage(object sender, PrintPageEventArgs ev) file://在页底中间输出页码 if(HasMorePages) |
三个按纽的Click事件代码分别如下:
| //页面设置 private void button1_Click(object sender, System.EventArgs e) { this.pageSetupDialog1.ShowDialog(); this.printDocument1.DefaultPageSettings = this.pageSetupDialog1.PageSettings; } file://打印预览 private void button2_Click(object sender, System.EventArgs e) { try { this.printPreviewDialog1.ShowDialog(); } catch(Exception ex) { this.label1.Text = ex.Message; } } file://打印 private void button3_Click(object sender, System.EventArgs e) { try { this.printDocument1.Print(); } catch(Exception ex) { this.label1.Text = ex.Message; } } |
好了,我们的打印控件到这里就全部做完了,选择生成一个Release的版本,然后到工程目录下将生成的PrintControl.dll文件拷贝到IIS的虚拟根目录下,然后新建一个remoteprint.htm的HTML格式文件,在合适的地方加上:<object id="print" classid="http:RemotePrint.dll#RemotePrint.PrintControl" Width="100%" Height="60"> </object>,为了更加形象和美观,还可以将需要打印的数据做成网页形式放在上面,如果需要获取的XML是动态数据源,则可以采用asp等动态脚本来生成该网页表格,如果需要获取的XML是一个静态的文本,则可以采用XSLT直接将XML文件转换成网页表格。
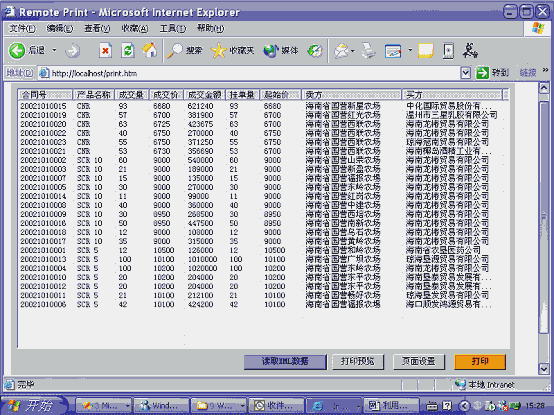
打开浏览器,输入:http://localhost/remoteprint.htm,如果您已经跟我一样,事先做好了一个XML报表数据文件的话,您就可以看到下图所示的效果
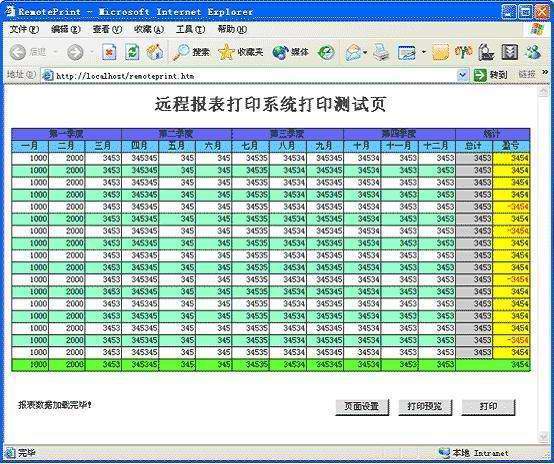
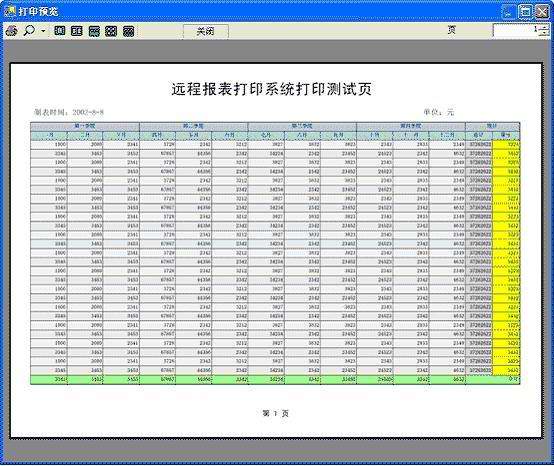
请注意:该图示例中的所有数据均为笔者随意虚拟,网页中的表格数据和打印数据并非来自同一数据源,也没有刻意去对等,仅仅只是为了演示一下效果,因此网页显示报表跟打印预览中的报表有一些出入是正常的。在实际应用中可以让网页显示数据跟打印输出数据完全一致。
方案扩充:
那么如何打印一些特殊形态的图表,前文中已经提到,采用本方案可以非常方便的定义出自己所需要的标签,在理论上可以打印出任何样式的特殊图表。因此本文打算详细介绍一下增加自己定义的标签扩充打印格式的具体过程。
先假设我们的客户看了打印效果后基本上满意,但是还有觉得一点不足,如果需要打印一些图表怎么办?例如折线图、K线图、饼状图、柱状图等等。使用我们现有的标签就不行了,所以我们首先要扩充我们的标签库,让它的表达能力更加强。在这里,我将只打算让我们的打印控件学会画简单的折线图,希望读者能举一反三,创造出其它各种各样的打印效果。
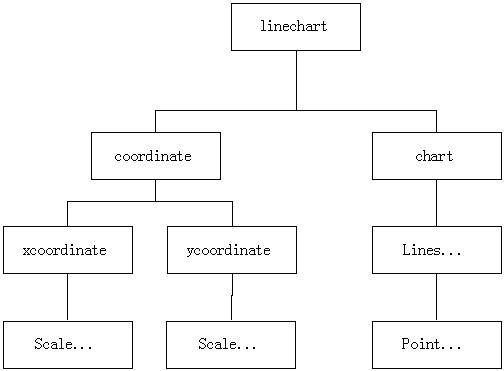
最基本的折线图是由X坐标轴、Y坐标轴和一系列点连接成的线构成的,因此,我定义了以下几种标签:
1. linechart:跟table,text标签一样,为样式根标签。
属性:无
2. coordinate:坐标。
属性:无
3. xcoordinate:X轴坐标线
属性:
# x:起点X坐标值
# y:起点Y坐标值
# length:长度值
# stroke:粗细
# color:颜色
# arrow:是否有箭头
4. ycoordinate:Y轴坐标线
属性:同xcoordinate。
5.scale:刻度线
标签内容:显示在刻度边的文字
属性:
# length:距离起点长度值
# height:刻度线高度
# width:刻度线宽度
# color:颜色
# fontsize:字体大小
6.chart:图表根
属性:无
7.lines:线段
属性值:
# stroke:粗细
# color:颜色
8. point:点
属性值:
# x:X坐标值
# y:Y坐标值
# radius:半径
# color:颜色
其结构图如下所示:
下面是一段用刚才定义的标签制作的XML折线图示例:
| <linechart> <coordinate> <xcoordinate x="200" y="600" length="800" stroke="2" color="Black" arrow="true"> <scale length="100" height="10" width="1" color="Black" fontsize="9">100</scale> <scale length="200" height="10" width="1" color="Black" fontsize="9">200</scale> <scale length="300" height="10" width="1" color="Black" fontsize="9">300</scale> <scale length="400" height="10" width="1" color="Black" fontsize="9">400</scale> <scale length="500" height="10" width="1" color="Black" fontsize="9">500</scale> <scale length="600" height="10" width="1" color="Black" fontsize="9">600</scale> <scale length="700" height="10" width="1" color="Black" fontsize="9">700</scale> </xcoordinate> <ycoordinate x="200" y="600" length="-400" stroke="2" color="Black" arrow="true"> <scale length="-100" height="10" width="1" color="Black" fontsize="9">100</scale> <scale length="-200" height="10" width="1" color="Black" fontsize="9">200</scale> <scale length="-300" height="10" width="1" color="Black" fontsize="9">300</scale> </ycoordinate> </coordinate> <chart> <lines stroke="1" color="Blue"> <point x="200" y="600" radius="5" color="Black"/> <point x="300" y="300" radius="5" color="Black"/> <point x="400" y="400" radius="5" color="Black"/> <point x="500" y="500" radius="5" color="Black"/> <point x="600" y="300" radius="5" color="Black"/> <point x="700" y="300" radius="5" color="Black"/> <point x="800" y="600" radius="5" color="Black"/> <point x="900" y="500" radius="5" color="Black"/> </lines> <lines stroke="1" color="Red"> <point x="200" y="400" radius="5" color="Black"/> <point x="300" y="500" radius="5" color="Black"/> <point x="400" y="600" radius="5" color="Black"/> <point x="500" y="300" radius="5" color="Black"/> <point x="600" y="400" radius="5" color="Black"/> <point x="700" y="400" radius="5" color="Black"/> <point x="800" y="500" radius="5" color="Black"/> <point x="900" y="300" radius="5" color="Black"/> </lines> </chart> </linechart> |
完成了标签的定义,下一步就要来修改我们的程序,让他能"读懂"这些标签。
首先,我们先给工程增加一个LineChart的新类,跟Table,Text类一样,它也是继承自PrintElement类,同样重载了Draw虚方法。代码如下:
| using System; using System.Xml; using System.Drawing; using System.Drawing.Drawing2D; namespace RemotePrint { public class LineChart : PrintElement { private XmlNode chart; public LineChart(XmlNode Chart) { chart = Chart; } public override bool Draw(Graphics g) { DrawCoordinate(g, chart["coordinate"]);//画坐标轴 DrawChart(g, chart["chart"]); return false; } private void DrawCoordinate(Graphics g, XmlNode coo) { DrawXCoor(g, coo["xcoordinate"]);//画X坐标 DrawYCoor(g, coo["ycoordinate"]);//画Y坐标 } private void DrawXCoor(Graphics g, XmlNode xcoo) { int x = int.Parse(xcoo.Attributes["x"].InnerText); int y = int.Parse(xcoo.Attributes["y"].InnerText); int length = int.Parse(xcoo.Attributes["length"].InnerText); bool arrow = bool.Parse(xcoo.Attributes["arrow"].InnerText); int stroke = int.Parse(xcoo.Attributes["stroke"].InnerText); Color color = Color.FromName(xcoo.Attributes["color"].InnerText); Pen pen = new Pen(color, (float)stroke); if(arrow)//是否有箭头 { AdjustableArrowCap Arrow = new AdjustableArrowCap( (float)(stroke * 1.5 + 1.5), (float)(stroke * 1.5 + 2), true); pen.CustomEndCap = Arrow; } g.DrawLine(pen, x, y, x + length, y);//画坐标 file://画刻度 foreach(XmlNode scale in xcoo.ChildNodes) { int len = int.Parse(scale.Attributes["length"].InnerText); int height = int.Parse(scale.Attributes["height"].InnerText); int width = int.Parse(scale.Attributes["width"].InnerText); int fontsize = int.Parse(scale.Attributes["fontsize"].InnerText); Color clr = Color.FromName(scale.Attributes["color"].InnerText); string name = scale.InnerText; Pen p = new Pen(clr, (float)width); g.DrawLine(p, x + len, y, x + len, y - height); Font font = new Font("Arial", (float)fontsize); g.DrawString( name, font, new SolidBrush(clr), (float)(x + len - 10), (float)(y + 10)); } } private void DrawYCoor(Graphics g, XmlNode ycoo) { int x = int.Parse(ycoo.Attributes["x"].InnerText); int y = int.Parse(ycoo.Attributes["y"].InnerText); int length = int.Parse(ycoo.Attributes["length"].InnerText); bool arrow = bool.Parse(ycoo.Attributes["arrow"].InnerText); int stroke = int.Parse(ycoo.Attributes["stroke"].InnerText); Color color = Color.FromName(ycoo.Attributes["color"].InnerText); Pen pen = new Pen(color, (float)stroke); if(arrow)//是否有箭头 { AdjustableArrowCap Arrow = new AdjustableArrowCap( (float)(stroke * 1.5 + 2), (float)(stroke * 1.5 + 3), true); pen.CustomEndCap = Arrow; } g.DrawLine(pen, x, y, x, y + length);//画坐标 file://画刻度 foreach(XmlNode scale in ycoo.ChildNodes) { int len = int.Parse(scale.Attributes["length"].InnerText); int height = int.Parse(scale.Attributes["height"].InnerText); int width = int.Parse(scale.Attributes["width"].InnerText); int fontsize = int.Parse(scale.Attributes["fontsize"].InnerText); Color clr = Color.FromName(scale.Attributes["color"].InnerText); string name = scale.InnerText; Pen p = new Pen(clr, (float)width); g.DrawLine(p, x, y + len, x + height, y + len); Font font = new Font("Arial", (float)fontsize); StringFormat sf = new StringFormat(); sf.Alignment = StringAlignment.Far; RectangleF rect = new RectangleF( (float)(x - 100), (float)(y + len - 25), 90f, 50f); sf.LineAlignment = StringAlignment.Center; g.DrawString(name, font, new SolidBrush(clr), rect, sf); } } private void DrawChart(Graphics g, XmlNode chart) { foreach(XmlNode lines in chart.ChildNodes) { DrawLines(g, lines); } } private void DrawLines(Graphics g, XmlNode lines) { int Stroke = int.Parse(lines.Attributes["stroke"].InnerText); Point[] points = new Point[lines.ChildNodes.Count]; Color linecolor = Color.FromName(lines.Attributes["color"].InnerText); for(int i = 0; i < lines.ChildNodes.Count; i++) { XmlNode node = lines.ChildNodes[i]; points[i] = new Point( int.Parse(node.Attributes["x"].InnerText), int.Parse(node.Attributes["y"].InnerText)); int Radius = int.Parse(node.Attributes["radius"].InnerText); Color pointcolor = Color.FromName(node.Attributes["color"].InnerText); if(Radius != 0)//画点 { g.FillEllipse(new SolidBrush(pointcolor), points[i].X - Radius, points[i].Y - Radius, Radius * 2, Radius * 2); } } Pen pen = new Pen(linecolor); g.DrawLines(pen, points);//画线 } } } |
然后,为Parser类的CreateElement方法增加一个小case,代码如下:
| switch(element.Name) { case "text": printElement = new Text(element); break; case "table": printElement = new Table(element); break; case "linechart"://新增加的linechart printElement = new LineChart(element); break; default: printElement = new PrintElement(); break; } |
将原来的XML文件中的table标签和其子标签都替换成刚才写的那段linechart,然后编译程序,运行后效果如下所示:
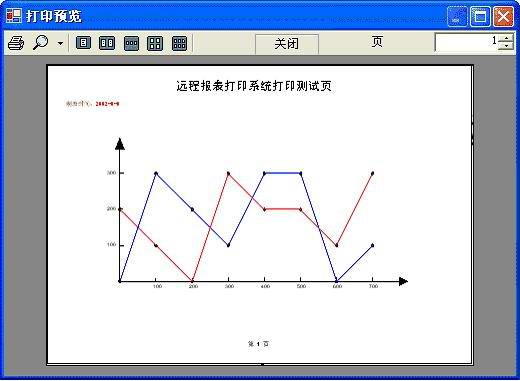
现在,我们的打印控件就能打印折线图了,由于我们采用了Abstract Factory的设计模式,将报表的打印和格式的解析分开,使得本程序有着非常方便的扩充能力,如果需要再增加一种新形式的图表,那么需要定义出标签,写一个解析类,再到Paser中为这个类增加一个case就搞定了,PrintControl内部的代码一行都不需要改写。