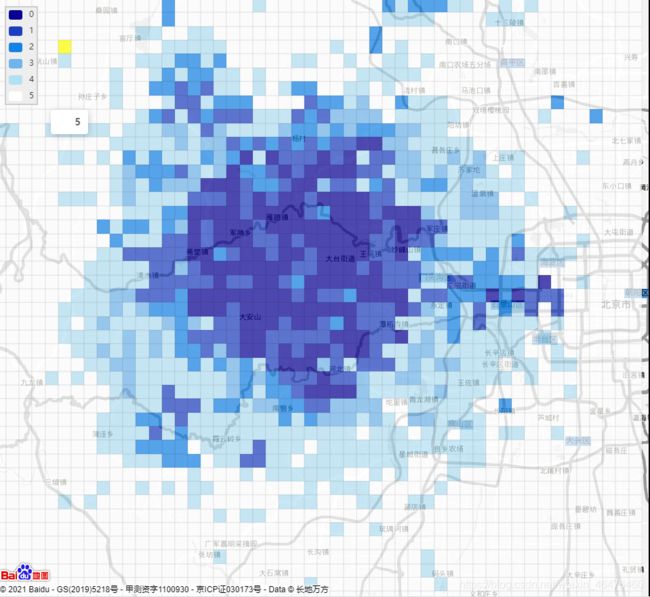
vue如何引入echart 地图,及报错总结
npm i echarts
引入
import echarts from "echarts"; //可视化
map.js
export function loadBMap(ak) {

    return new Promise(function (resolve, reject) {

        if (typeof BMap !== 'undefined') {

            resolve(BMap)
            return true
        }
        window.onBMapCallback = function () {

            resolve(BMap)
        }
        let script = document.createElement('script')
        script.type = 'text/javascript'
        script.src =
            'http://api.map.baidu.com/api?v=2.0&ak=' + ak + '&__ec_v__=20190126&callback=onBMapCallback'
        script.onerror = reject
        document.head.appendChild(script)
    })
}
完整代码:
<template>
  <div id="app">
    <div id="demo1"></div>
  </div>
</template>
<script>
import echarts from "echarts"; //可视化
import data_arr from "./data";
import {
      loadBMap } from "./map.js";
export default {

  name: "App",
  components: {
     },
  data() {

    return {
     };
  },
  computed: {
     },
  created() {
     },
  mounted() {

    this.$nextTick(() => {

    //自己百度ak
      loadBMap("自己百度ak").then(() => {

        this.echarts();
      });
    });
  },
  methods: {

    echarts() {

      var COLORS = [
        "#070093",
        "#1c3fbf",
        "#1482e5",
        "#70b4eb",
        "#b4e0f3",
        "#ffffff",
      ];
      var lngExtent = [39.5, 40.6];
      var latExtent = [115.9, 116.8];
      var cellCount = [50, 50];
      var cellSizeCoord = [
        (lngExtent[1] - lngExtent[0]) / cellCount[0],
        (latExtent[1] - latExtent[0]) / cellCount[1],
      ];
      var gapSize = 0;
      function renderItem(params, api) {

        var context = params.context;
        var lngIndex = api.value(0);
        var latIndex = api.value(1);
        var coordLeftTop = [
          +(latExtent[0] + lngIndex * cellSizeCoord[0]).toFixed(6),
          +(lngExtent[0] + latIndex * cellSizeCoord[1]).toFixed(6),
        ];
        var pointLeftTop = getCoord(params, api, lngIndex, latIndex);
        var pointRightBottom = getCoord(
          params,
          api,
          lngIndex + 1,
          latIndex + 1
        );

        return {

          type: "rect",
          shape: {

            x: pointLeftTop[0],
            y: pointLeftTop[1],
            width: pointRightBottom[0] - pointLeftTop[0],
            height: pointRightBottom[1] - pointLeftTop[1],
          },
          style: api.style({

            stroke: "rgba(0,0,0,0.1)",
          }),
          styleEmphasis: api.styleEmphasis(),
        };
      }

      function getCoord(params, api, lngIndex, latIndex) {

        var coords = params.context.coords || (params.context.coords = []);
        var key = lngIndex + "-" + latIndex;

        // bmap returns point in integer, which makes cell width unstable.
        // So we have to use right bottom point.
        return (
          coords[key] ||
          (coords[key] = api.coord([
            +(latExtent[0] + lngIndex * cellSizeCoord[0]).toFixed(6),
            +(lngExtent[0] + latIndex * cellSizeCoord[1]).toFixed(6),
          ]))
        );
      }
      var option2 = {

        tooltip: {
     },
        visualMap: {

          type: "piecewise",
          inverse: true,
          top: 10,
          left: 10,
          pieces: [
            {

              value: 0,
              color: COLORS[0],
            },
            {

              value: 1,
              color: COLORS[1],
            },
            {

              value: 2,
              color: COLORS[2],
            },
            {

              value: 3,
              color: COLORS[3],
            },
            {

              value: 4,
              color: COLORS[4],
            },
            {

              value: 5,
              color: COLORS[5],
            },
          ],
          borderColor: "#ccc",
          borderWidth: 2,
          backgroundColor: "#eee",
          dimension: 2,
          inRange: {

            color: COLORS,
            opacity: 0.7,
          },
        },
        series: [
          {

            type: "custom",
            coordinateSystem: "bmap",
            renderItem: renderItem,
            animation: false,
            emphasis: {

              itemStyle: {

                color: "yellow",
              },
            },
            encode: {

              tooltip: 2,
            },
            data: data_arr,
          },
        ],
        bmap: {

          center: [116.46, 39.92],
          zoom: 11.8,
          roam: true,
          mapStyle: {

            styleJson: [
              {

                featureType: "water",
                elementType: "all",
                stylers: {

                  color: "#d1d1d1",
                },
              },
              {

                featureType: "land",
                elementType: "all",
                stylers: {

                  color: "#f3f3f3",
                },
              },
              {

                featureType: "railway",
                elementType: "all",
                stylers: {

                  visibility: "off",
                },
              },
              {

                featureType: "highway",
                elementType: "all",
                stylers: {

                  color: "#999999",
                },
              },
              {

                featureType: "highway",
                elementType: "labels",
                stylers: {

                  visibility: "off",
                },
              },
              {

                featureType: "arterial",
                elementType: "geometry",
                stylers: {

                  color: "#fefefe",
                },
              },
              {

                featureType: "arterial",
                elementType: "geometry.fill",
                stylers: {

                  color: "#fefefe",
                },
              },
              {

                featureType: "poi",
                elementType: "all",
                stylers: {

                  visibility: "off",
                },
              },
              {

                featureType: "green",
                elementType: "all",
                stylers: {

                  visibility: "off",
                },
              },
              {

                featureType: "subway",
                elementType: "all",
                stylers: {

                  visibility: "off",
                },
              },
              {

                featureType: "manmade",
                elementType: "all",
                stylers: {

                  color: "#d1d1d1",
                },
              },
              {

                featureType: "local",
                elementType: "all",
                stylers: {

                  color: "#d1d1d1",
                },
              },
              {

                featureType: "arterial",
                elementType: "labels",
                stylers: {

                  visibility: "off",
                },
              },
              {

                featureType: "boundary",
                elementType: "all",
                stylers: {

                  color: "#fefefe",
                },
              },
              {

                featureType: "building",
                elementType: "all",
                stylers: {

                  color: "#d1d1d1",
                },
              },
              {

                featureType: "label",
                elementType: "labels.text.fill",
                stylers: {

                  color: "rgba(0,0,0,0)",
                },
              },
            ],
          },
        },
      };
      // 引入 ECharts 主模块
      var echarts = require("echarts/lib/echarts");
      // 引入柱状图
      require("echarts/lib/chart/bar");
      // 引入提示框和标题组件
      require("echarts/lib/component/tooltip");
      require("echarts/lib/component/title");
      require("echarts/extension/bmap/bmap");
      // 基于准备好的dom,初始化echarts实例
      var myChart2 = echarts.init(document.getElementById("demo1"));
      // 绘制饼图
      myChart2.setOption(option2, true);
      console.log("1");
    },
  },
};
</script>
<style lang="scss">
#app {

  width: 100vw;
  height: 100%;
  overflow: hidden;

  display: flex;
  flex-wrap: wrap;
  #demo1 {

    width: 50%;
    height: 100%;
    background: url("../assets/bg.jpg");
    background-size: cover;
    background-position: center;
    background-repeat: no-repeat;
  }
  // color: transparent;
}
@media screen and (max-width: 768px) {

  #app {

    #demo1 {

      width: 100%;
      height: 50%;
      // height: 100%;
    }
  }
}
</style>
data.js文件(此文件因为过长所以被我从demo里面提取出来)
此处的datajs 字符数过长 ,可以参考官网
或者网盘下载
链接
https://pan.baidu.com/s/1kWHFsJkVwXUJbiVMyEJlFg
提取码:c8r6

其格式如下
var data = [[0, 0, 5], [1, 0, 5]]
module.exports = data
注意!!!
复制完代码记得改成自己的百度api地图密钥,地图才会显示
 mounted() {

  this.$nextTick(() => {

    //自己百度ak
      loadBMap("自己百度ak").then(() => {

        this.echarts();
      });
    });
 }
1.api.could is not underfind
绘制函数里面加上
require("echarts/extension/bmap/bmap");
2.报错 BMap api is not loaded
绘制函数里面加上
原因:在mounted初始化地图的时候,因为异步问题会导致BMap is not defined,也就是百度的api还没完全引入或者加载完成,就已经进行地图初始化了
解决方案
1.写一个map.js文件,如上面代码 map.js(为了方便,就直接复制下来)
export function loadBMap(ak) {

    return new Promise(function (resolve, reject) {

        if (typeof BMap !== 'undefined') {

            resolve(BMap)
            return true
        }
        window.onBMapCallback = function () {

            resolve(BMap)
        }
        let script = document.createElement('script')
        script.type = 'text/javascript'
        script.src =
            'http://api.map.baidu.com/api?v=2.0&ak=' + ak + '&__ec_v__=20190126&callback=onBMapCallback'
        script.onerror = reject
        document.head.appendChild(script)
    })
}
2.引入
import {
      loadBMap } from "./map.js";
3.调用
 mounted() {

  this.$nextTick(() => {

    //自己百度ak
      loadBMap("自己百度ak").then(() => {

        this.echarts();
      });
    });
 }

