使用 StatsD + Grafana + InfluxDB 搭建 Node.js 监控系统(一)
在石墨,我们之前使用 ELK 搭了一套监控图表,由于一些原因,比如:
- Kibana 经常查日志查挂
- Kibana 的图表不太美观、不够灵活
所以调研了一下,选择用 StatsD + Grafana + InfluxDB 搭建一套新的监控系统。
工具简介
StatsD 是一个使用 Node.js 开发的简单的网络守护进程,通过 UDP 或者 TCP 方式侦听各种统计信息,包括计数器和定时器,并发送聚合信息到后端服务,例如 Graphite、ElasticSearch、InfluxDB 等等, 这里 列出了支持的 backend。Grafana 是一个使用 Go 开发的开源的、功能齐全的、好看的仪表盘和图表的编辑器,可用来做日志的分析与展示曲线图(如 api 的请求日志),支持多种 backend,如 ElasticSearch、InfluxDB、OpenTSDB 等等。 在线 DEMO 。
InfluxDB 是一个使用 Go 语言开发的开源分布式时序、事件和指标数据库,无需外部依赖,其设计目标是实现分布式和水平伸缩扩展。
启动 docker-statsd-influxdb-grafana
我使用的 Docker 镜像 docker-statsd-influxdb-grafana 一键启动 StatsD + Grafana + InfluxDB,省去很多麻烦(此处省略一万字)。因为我本机是 Mac,所以以下演示如何在 Mac 下使用 Docker 搭建(其他系统用法应该差不多)。在此之前,先安装 Docker,Mac 下虽然有 Kitematic,我们还是用命令行来演示。
启动一个 docker-machine:
➜  Desktop docker-machine start
Starting "default"...
(default) Check network to re-create if needed...
(default) Waiting for an IP...
Machine "default" was started.
Waiting for SSH to be available...
Detecting the provisioner...
Started machines may have new IP addresses. You may need to re-run the `docker-machine env` command.
➜  Desktop docker-machine env
export DOCKER_TLS_VERIFY="1"
export DOCKER_HOST="tcp://192.168.99.100:2376"
export DOCKER_CERT_PATH="/Users/nswbmw/.docker/machine/machines/default"
export DOCKER_MACHINE_NAME="default"
# Run this command to configure your shell:
# eval $(docker-machine env)
➜  Desktop eval $(docker-machine env)
➜  Desktop docker ps
启动 docker-statsd-influxdb-grafana,命令如下:
docker run -d \
  --name docker-statsd-influxdb-grafana \
  -p 3000:9000 \
  -p 8083:8083 \
  -p 8086:8086 \
  -p 22022:22 \
  -p 8125:8125/udp \
  samuelebistoletti/docker-statsd-influxdb-grafana:latest

配置 InfluxDB
浏览器打开: http://你的ip:8083 。点击右上角设置的图标,添加 username 和 password 都为 datasource,点击 Save 保存,如下所示: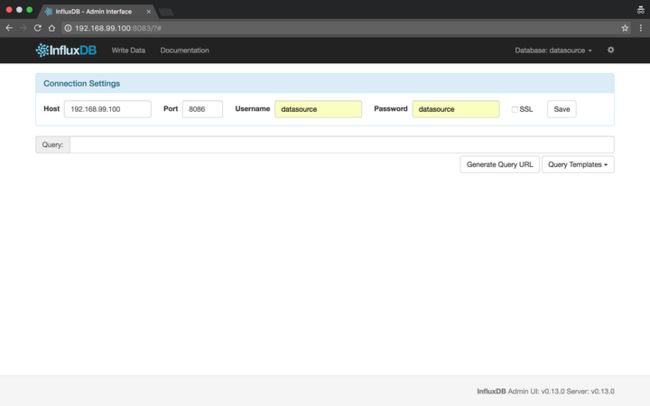
配置 Grafana
浏览器打开: http://你的ip:3000 。- 输入 user 和 password 都为 root,登录
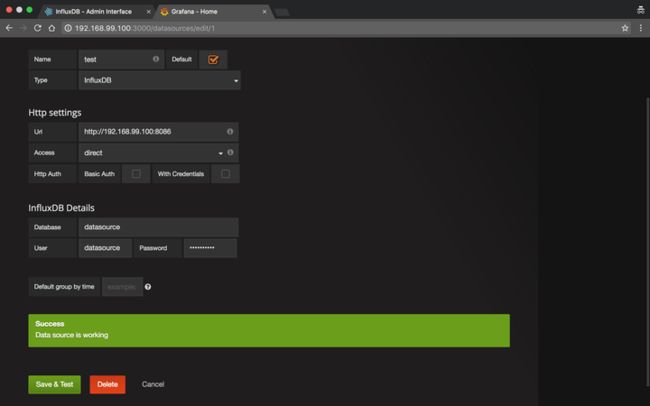
- 点击左上角图标 -> Data Source -> Add data source,进入配置数据源页面,如下填写,点击 Save:
使用 node-statsd
node-statsd 是一个 statsd 的 Node.js client。创建以下测试代码:'use strict';
const StatsD = require('node-statsd'),
client = new StatsD({
host: '192.168.99.100',
port: 8125
});
setInterval(function () {
const responseTime = Math.floor(Math.random() * 100);
client.timing('api', responseTime, function (error, bytes) {
if (error) {
console.error(error);
} else {
console.log(`Successfully sent ${
bytes} bytes, responseTime: ${
responseTime}`);
}
});
}, 1000);
运行以上代码,每一秒钟产生一个 0-99 之间的随机值(模拟响应时间,单位毫秒),发送到 StatsD,StatsD 会将这些数据写入 InfluxDB 的 datasource 数据库。
创建 Grafana 图表
回到 Grafana 页面。- 点击左上角图标 -> Dashboards -> +New 进入创建图表页
- 点击左侧的绿块 -> Add Panel -> Graph 创建一个图表
创建 API 请求量图表
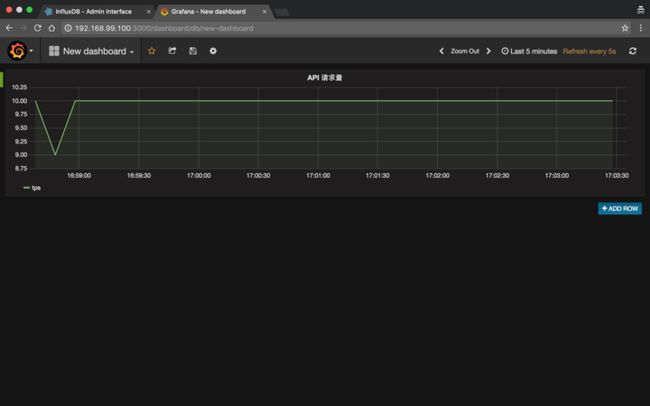
- 点击 General -> Title 修改为 "API 请求量"
- 点击 Metrics -> Add query,点击如图所示位置,选择 "api.timer.count",ALIAS BY 填写 "tps",如下所示:

- 点击左上角保存(或用 ctrl + s),我选择了显示 5 分钟内的数据,每 5s 刷新一次,如下所示:
创建 API 响应时间图表
- 点击 +ADD ROW -> 点击左侧的绿块 -> Add Panel -> Graph,创建一个图表
- 点击 General -> Title 修改为 "API 响应时间"
- 点击 Metrics -> Add query,点击如图所示位置,选择 "api.timer.mean",ALIAS BY 填写 "mean"
- 点击 Add query,选择 "api.timer.mean_90",ALIAS BY 填写 "mean_90"
- 点击 Add query,选择 "api.timer.upper_90",ALIAS BY 填写 "upper_90"
最终如下所示:
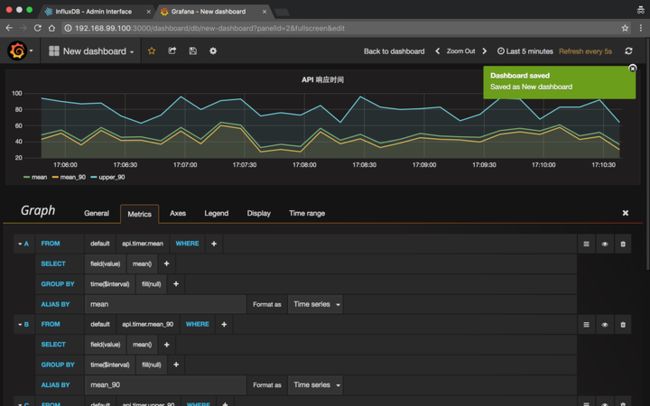
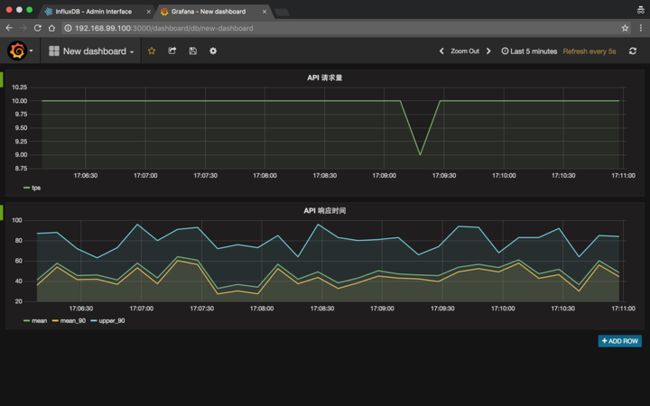
- mean: 所有请求的平均响应时间
- mean_90: 去除最高响应时间的 10% 请求后,剩余的 90% 请求的响应时间的平均值
- upper_90: 去除最高响应时间的 10% 请求后,响应时间最大的那个值
当然这个 90% 是可以配置的,比如也可以设置为 95%,更多信息见:
- https://github.com/etsy/statsd/blob/master/docs/metric_types.md
- https://github.com/etsy/statsd/issues/157
注意事项
- docker-statsd-influxdb-grafan 这个 docker 镜像里配置 StatsD 的配置在 /opt/statsd/config.js,里面写死了 InfluxDB 的配置,所以如果改 InfluxDB 的 db 或者 username 或者 password,别忘了改这个配置。
- 在 InfluxDB 的 web 管理页使用查询语句,如你在 node-statsd 使用 client.timing('api') 并不会创建 api 的表,会创建如 api.timer.count 等等这样的表,所以如下查询是没有结果的:select * from api,可以在 datasource 下使用:select * from /.*/ 查看 datasource 下所有数据。
- 在使用 node-statsd 时,只发送了 timing 类型的数据,此类型也会额外创建 counting 类型的数据,所以这样是多余的 client.increment('api')。
在 Koa 中使用
lib/statsd.js'use strict';
const StatsD = require('node-statsd');
const config = require('config');
module.exports = new StatsD({
host: config.statsd.host,
port: config.statsd.port
});
'use strict';

const statsdClient = require('../lib/statsd');

module.exports = function () {

  return function *statsd(next) {

    const routerName = this.route ? this.route.handler.controller + '.' + this.route.handler.action : null;
    const start = Date.now();

    yield next;

    const spent = Date.now() - start;
    if (routerName) {

      statsdClient.timing(`api.${
       routerName}`, spent);
      statsdClient.timing('api', spent);
    }
  };
};
app.use(require('./middlewares/statsd')());
const routerName = this.routerName;
一键导入数据
我们 API 有近百个接口,要是每次都去手动创建并配置图表那就费老劲了,而且每次创建的图表的配置都差不多,于是我寻思寻找一些捷径。我发现 Grafana 有 Template 的功能,然而尝试了下并没有搞明白怎么用。。我又发现 Grafana 有 Import 的功能,于是先把配置好的图表先导出 JSON,然后不断复制粘贴修改,保存尝试 Import 看下效果 ,最后成功。
注意:导出的 JSON 中 rows 代表了每一行,每个 row 中有一个 panels 数组存储了每一个 Graph(下图一个 row 有两个 Graph),每个 Graph 有一个 id 字段是递增的(如:1、2、3...),targets 下每个曲线的 refId 是递增的(如:A、B、C...),记得修正过来,否则无法正常显示图表。
最终我写了个脚本,运行后生成了每个接口的 JSON 文件,30 多个接口导出了 30 多个文件,每次 Import 那也要 30 几次。机智的我怎么可能就此放弃(其实是懒),应该还有更省事的方法,我在浏览器中导入的时候,在控制台看了下 Grafana 的网络请求,发现导入时调用的是:
POST https://xxx:3006/api/dashboards/import
而且 JSON 文件的数据直接放在 post 请求体里,那这样就好办了,也不用生成文件了,最后生成的配置放到了一个数组里,用 co + co-request 循环调用上面那个接口导入就好了,真正做到一键导入数据。
以下是一个 dashboard 及对应的 JSON 配置:

{

  "id": 32,
  "title": "API file",
  "tags": [],
  "style": "dark",
  "timezone": "browser",
  "editable": true,
  "hideControls": false,
  "sharedCrosshair": false,
  "rows": [
    {

      "collapse": false,
      "editable": true,
      "height": "250px",
      "panels": [
        {

          "aliasColors": {},
          "bars": false,
          "datasource": "api-influxdb",
          "editable": true,
          "error": false,
          "fill": 2,
          "grid": {

            "threshold1": null,
            "threshold1Color": "rgba(216, 200, 27, 0.27)",
            "threshold2": null,
            "threshold2Color": "rgba(234, 112, 112, 0.22)"
          },
          "id": 1,
          "isNew": true,
          "legend": {

            "avg": false,
            "current": false,
            "max": false,
            "min": false,
            "show": true,
            "total": false,
            "values": false
          },
          "lines": true,
          "linewidth": 1,
          "links": [],
          "minSpan": 6,
          "nullPointMode": "connected",
          "percentage": false,
          "pointradius": 5,
          "points": false,
          "renderer": "flot",
          "seriesOverrides": [],
          "span": 6,
          "stack": false,
          "steppedLine": false,
          "targets": [
            {

              "alias": "tps",
              "dsType": "influxdb",
              "groupBy": [
                {

                  "params": [
                    "$interval"
                  ],
                  "type": "time"
                },
                {

                  "params": [
                    "null"
                  ],
                  "type": "fill"
                }
              ],
              "measurement": "api.file.show.timer.count",
              "policy": "default",
              "refId": "A",
              "resultFormat": "time_series",
              "select": [
                [
                  {

                    "params": [
                      "value"
                    ],
                    "type": "field"
                  },
                  {

                    "params": [],
                    "type": "mean"
                  }
                ]
              ],
              "tags": []
            }
          ],
          "timeFrom": null,
          "timeShift": null,
          "title": "api.file.show.count",
          "tooltip": {

            "msResolution": true,
            "shared": true,
            "sort": 0,
            "value_type": "cumulative"
          },
          "type": "graph",
          "xaxis": {

            "show": true
          },
          "yaxes": [
            {

              "format": "short",
              "label": null,
              "logBase": 1,
              "max": null,
              "min": null,
              "show": true
            },
            {

              "format": "short",
              "label": null,
              "logBase": 1,
              "max": null,
              "min": null,
              "show": true
            }
          ]
        },
        {

          "aliasColors": {},
          "bars": false,
          "datasource": "api-influxdb",
          "editable": true,
          "error": false,
          "fill": 1,
          "grid": {

            "threshold1": null,
            "threshold1Color": "rgba(216, 200, 27, 0.27)",
            "threshold2": null,
            "threshold2Color": "rgba(234, 112, 112, 0.22)"
          },
          "id": 2,
          "isNew": true,
          "legend": {

            "avg": false,
            "current": false,
            "max": false,
            "min": false,
            "show": true,
            "total": false,
            "values": false
          },
          "lines": true,
          "linewidth": 2,
          "links": [],
          "minSpan": 5,
          "nullPointMode": "connected",
          "percentage": false,
          "pointradius": 5,
          "points": false,
          "renderer": "flot",
          "seriesOverrides": [],
          "span": 6,
          "stack": false,
          "steppedLine": false,
          "targets": [
            {

              "dsType": "influxdb",
              "groupBy": [
                {

                  "params": [
                    "$interval"
                  ],
                  "type": "time"
                },
                {

                  "params": [
                    "null"
                  ],
                  "type": "fill"
                }
              ],
              "measurement": "api.file.show.timer.mean",
              "policy": "default",
              "refId": "A",
              "resultFormat": "time_series",
              "select": [
                [
                  {

                    "params": [
                      "value"
                    ],
                    "type": "field"
                  },
                  {

                    "params": [],
                    "type": "mean"
                  }
                ]
              ],
              "tags": [],
              "alias": "mean"
            },
            {

              "dsType": "influxdb",
              "groupBy": [
                {

                  "params": [
                    "$interval"
                  ],
                  "type": "time"
                },
                {

                  "params": [
                    "null"
                  ],
                  "type": "fill"
                }
              ],
              "measurement": "api.file.show.timer.mean_90",
              "policy": "default",
              "refId": "B",
              "resultFormat": "time_series",
              "select": [
                [
                  {

                    "params": [
                      "value"
                    ],
                    "type": "field"
                  },
                  {

                    "params": [],
                    "type": "mean"
                  }
                ]
              ],
              "tags": [],
              "alias": "mean_90"
            },
            {

              "dsType": "influxdb",
              "groupBy": [
                {

                  "params": [
                    "$interval"
                  ],
                  "type": "time"
                },
                {

                  "params": [
                    "null"
                  ],
                  "type": "fill"
                }
              ],
              "measurement": "api.file.show.timer.upper_90",
              "policy": "default",
              "refId": "C",
              "resultFormat": "time_series",
              "select": [
                [
                  {

                    "params": [
                      "value"
                    ],
                    "type": "field"
                  },
                  {

                    "params": [],
                    "type": "mean"
                  }
                ]
              ],
              "tags": [],
              "alias": "upper_90"
            }
          ],
          "timeFrom": null,
          "timeShift": null,
          "title": "api.file.show.timer",
          "tooltip": {

            "msResolution": true,
            "shared": true,
            "sort": 0,
            "value_type": "cumulative"
          },
          "type": "graph",
          "xaxis": {

            "show": true
          },
          "yaxes": [
            {

              "format": "short",
              "label": null,
              "logBase": 1,
              "max": null,
              "min": null,
              "show": true
            },
            {

              "format": "short",
              "label": null,
              "logBase": 1,
              "max": null,
              "min": null,
              "show": true
            }
          ]
        }
      ],
      "title": "Row"
    }
  ],
  "time": {

    "from": "now-1h",
    "to": "now"
  },
  "timepicker": {

    "refresh_intervals": [
      "5s",
      "10s",
      "30s",
      "1m",
      "5m",
      "15m",
      "30m",
      "1h",
      "2h",
      "1d"
    ],
    "time_options": [
      "5m",
      "15m",
      "1h",
      "6h",
      "12h",
      "24h",
      "2d",
      "7d",
      "30d"
    ]
  },
  "templating": {

    "list": []
  },
  "annotations": {

    "list": []
  },
  "refresh": "5s",
  "schemaVersion": 12,
  "version": 2,
  "links": [],
  "gnetId": null
}
Grafana 更多用法
目前我只简单地用 Grafana 来统计:- api 总的平均响应时间
- api 每个接口的 tps 和平均响应时间
- 未来还会加入 cpu 和内存的使用情况等等
Grafana 还支持各种 plugin,如 grafana-zabbix 接入 zabbix 的监控数据等等。
最后
我们正在招聘!
[北京/武汉] 石墨文档 做最美产品 - 寻找中国最有才华的工程师加入