Latex——从基础表到进阶表的讲述
文章目录
- `基本语法`
- `三线表`
- `单元格合并`
- `table环境`
基本语法
Latex录入表格一般使用tabular
基本格式如下:
\begin{tabular}{对齐方式}
<表项> & <表项> &...& \\
<表项> & <表项> &...& \\
\end{tabular}
现在对对齐方式进行简单的描述
- l(L的小写):本列左对齐
- c:本列居中对齐
- r:本列居右对齐
一般情况下我们都使用c(centering的第一个字母),{对齐方式}->{ccc},表示三列的内容都是居中对齐。
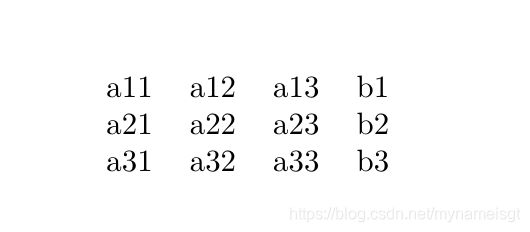
讲个例子:
\documentclass{
     article}

\begin{
     document}

	\begin{
     tabular}{
     cccc}

	a11 & a12 & a13  & b1 \\
	a21 & a22  & a23 & b2  \\
	a31 & a32  & a33 & b3  \\

\end{
     tabular}

\end{
     document}
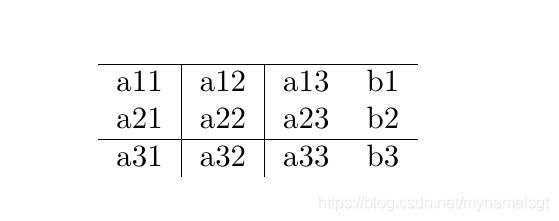
横线:需要在该行添加语句\hline,
竖线:需要在{对齐方式}这里进行设置,例如{cc|c},表示在第二三列之间添加竖线
例子如下:
\documentclass{
     article}
\begin{
     document}

	\begin{
     tabular}{
     c|c|cc}
	\hline
	a11 & a12 & a13  & b1 \\
	a21 & a22  & a23 & b2  \\
	\hline
	a31 & a32  & a33 & b3  \\

\end{
     tabular}

\end{
     document}
三线表
了解前面的语法,接下来便可以做出三线表的效果了。
例子如下:
\documentclass{
     article}

\begin{
     document}

	\begin{
     tabular}{
     ccc}
	\hline
	id & name & sex  \\
	\hline
	1 & John  & man  \\
	2 & Jack  & woman \\
	\hline

\end{
     tabular}

\end{
     document}
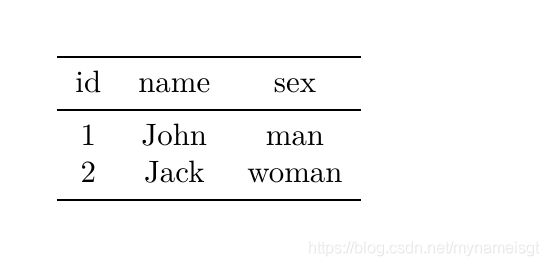
效果如下:
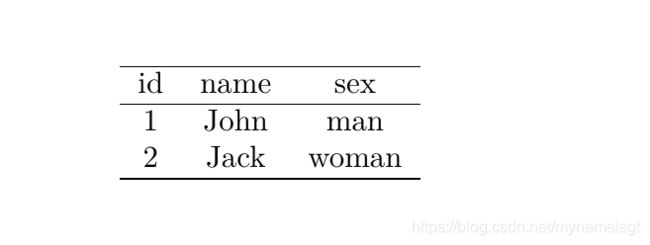
通常情况,为了让表格更具美感,我们希望第一根线和最后一根线比中间那根线更粗点。此时我们需要引入宏包booktabs,之后便可以使用\toprule 和 \bottomrule 命令分别画出表格头和表格底的粗横线,而用 \midrule 画出表格中的横线。
例子如下:
\documentclass{
     article}
\usepackage{
     booktabs}


\begin{
     document}

	\begin{
     tabular}{
     ccc}
	\toprule
	id & name & sex  \\
	\midrule
	1 & John  & man  \\
	2 & Jack  & woman \\
	\bottomrule

\end{
     tabular}

\end{
     document}
单元格合并
在唠唠怎么给他做单元格合并。
对于某一行
\multicolum{行数}{对齐方式}{文本内容}
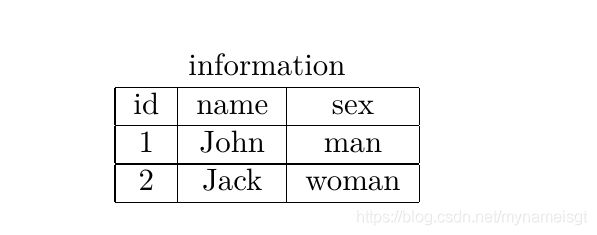
例子如下:
\documentclass{
     article}

\begin{
     document}

	\begin{
     tabular}{
     |c|c|c|}
	\multicolumn{
     3}{
     c}{
     information} \\
	\hline
	id & name & sex  \\
	\hline
	1 & John  & man  \\
	\hline
	2 & Jack  & woman \\
	\hline

\end{
     tabular}

\end{
     document}
\usepackage{multirow}
例子如下:
\documentclass{
     article}
\usepackage{
     multirow}

\begin{
     document}

	\begin{
     tabular}{
     |c|c|c|c|}
	\hline
	\multicolumn{
     4}{
     |c|}{
     information} \\
	\hline
	\multirow{
     3}*{
     data}
   &id & name & sex  \\
   \cline{
     2-4}      %%只为第2-4列添加横线
	&1 & John  & man  \\
	\cline{
     2-4}      %%只为第2-4列添加横线
	&2 & Jack  & woman \\
	\hline

\end{
     tabular}

\end{
     document}
效果如下:

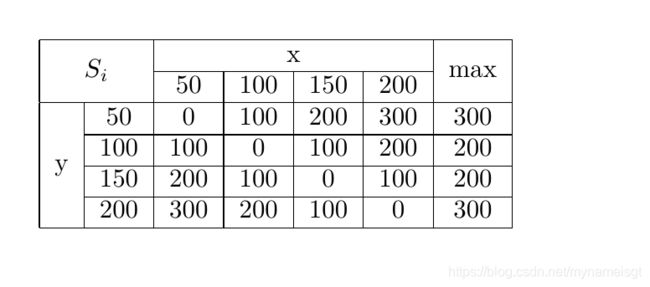
现在,我们用上面的合并基础语法,来做一个稍微复杂点的表格
例子如下
\documentclass{
     article}
\usepackage{
     multirow}

\begin{
     document}

\begin{
     tabular}{
     |c|c|c|c|c|c|c|}
\hline
\multicolumn{
     2}{
     |c|}{
      \multirow{
     2}*{
     $S_i$} }& \multicolumn{
     4}{
     c|}{
     x} &\multirow{
     2}*{
     max}\\
\cline{
     3-6}
\multicolumn{
     2}{
     |c|}{
     }&50&100&150&200&\\
\hline
\multirow{
     4}*{
     y}&50&0&100&200&300&300\\
\cline{
     2-7}
&100&100&0&100&200&200\\
\cline{
     2-7}
&150&200&100&0&100&200\\
\cline{
     2-7}
&200&300&200&100&0&300\\
\hline
\end{
     tabular}

\end{
     document}
\usepackage{diagbox}
例子如下
\documentclass{
     article}
\usepackage{
     diagbox}

\begin{
     document}

\begin{
     tabular}{
     |c|c|c|c|}
	\hline
	\diagbox{
     A}{
     $\alpha_{
     i,j}$}{
     B}&$\beta_1$&$\beta_2$&$\beta_3$\\ %添加斜线表头
	\hline
	$\alpha_1$&-4&0&-8\\
	\hline
	$\alpha_2$&3&2&4\\
	\hline
	$\alpha_3$&16&1&-9\\
	\hline
	$\alpha_4$&-1&1&7\\
	\hline
\end{
     tabular}

\end{
     document}
\documentclass{
     article}
\usepackage{
     diagbox}
\usepackage{
     multirow}

\begin{
     document}

  \begin{
     tabular}{
     |c|c|c|c|c|c|c|}
	\hline
	\multicolumn{
     2}{
     |c|}{
     \multirow{
     2}*{
     \diagbox{
     $S_i$}{
     $\lambda_i$}}}& \multicolumn{
     4}{
     c|}{
     x} &\multirow{
     2}*{
     max}\\
	\cline{
     3-6}
	\multicolumn{
     2}{
     |c|}{
     }&50&100&150&200&\\
	\hline
	\multirow{
     4}*{
     y}&50&0&100&200&300&300\\
	\cline{
     2-7}
	&100&100&0&100&200&200\\
	\cline{
     2-7}
	&150&200&100&0&100&200\\
	\cline{
     2-7}
	&200&300&200&100&0&300\\
	\hline
	\end{
     tabular}

\end{
     document}
效果如下:

上述就完成这个要求,注意调节\diagbox[innerwidth=2cm],如果斜线对不准,请条件这个参数
table环境
我们在写论文时,需要将表格插入文档中,表格的环境是table,类似于图片的环境是figure。基本的用法和图片环境figure类似,这里也简单的提一下吧
\begin{table}[htbp]
\centering   %居中
\caption{名称}
\label{}    %引用表格所需
\begin{tabular}{对齐方式}
........
\end{tabular}
\end{table}
[htbp],选择将表格放入文档中的哪个位置
h(here):将表格插入在当前文字位置
t(top):将表格放在下一页首
b(bottoom):将表格放在当前页底部
p(page):放入下一页
简单讲一个例子:
\documentclass{
     article}
\begin{
     document}

	As the favorable food for Scotch, the herring and mackerel bring generous profits to fishing
	companies. Due to the hotter ocean, more fish move to the north to seek better habitats, laying a
	negative impact on the fishing industry. The aim of this report is to build a migratory prediction
	model to evaluate the influences on the income of fishing companies. We are expected to provide
	some strategies for fishing companies who can adapt to the migration of fish under the constraints of
	various objective conditions and prevent themselves from going bankrupt as much as possible. Three
	models are established: Model I: Seawater Temperature Prediction Model; Model II: Fish Migration
	Prediction Model; Model III: Fishing Company Earnings Evaluation Model.


	\begin{
     table}[htbp]
		\centering
		\caption{
     三线表}
		\label{
     tab:1}
\begin{
     tabular}{
     ccc}
\hline
name& id& sex\\
\hline
Steve Jobs& 001& Male\\
Bill Gates& 002& Female\\
\hline
\end{
     tabular}
	\end{
     table}

For Model I, global ocean temperature date monthly from 1960 to 2019 is firstly collected. Then,
based on the analysis of intrinsic trend of the data and the verification of the stationarity, the validation
of using ARIMA model to predict temperature is proved. Next, historical data is used to fit the
parameters of ARIMA, with introduction of k-fold cross validation to identify the final prediction
model as ARIMA(1,1,0). Finally, according to ARIMA(1,1,0), bootstrap method is used to simulate
10000 possible prediction cases, which lays a great foundation to predict the migration of fish.
\end{
     document}
效果如下:

如果你还是不会用,在此给你留个链接Latex表格在线网址
觉得有用的客官点个赞啊๑乛◡乛๑,你的鼓励是我创作的动力,欢迎有问题给我留言~
