Echars的疫情展示应用(1)---零基础上手
JavaWeb-新冠疫情信息数据展示
- Echars的简单入门使用
-
- Echarts中制作饼状图-疫情
- Echarts中制作柱状图-疫情
- Echarts中制作折线图-疫情
Echars的简单入门使用
https://echarts.apache.org/examples/zh/index.html
可以上看上面的地址进行学习,基本的教程啊。
不会的5分钟教你上手一波,,一波操作666.
注意:
引入js文件不能少啊。并且要注意顺序,大胸弟。。。
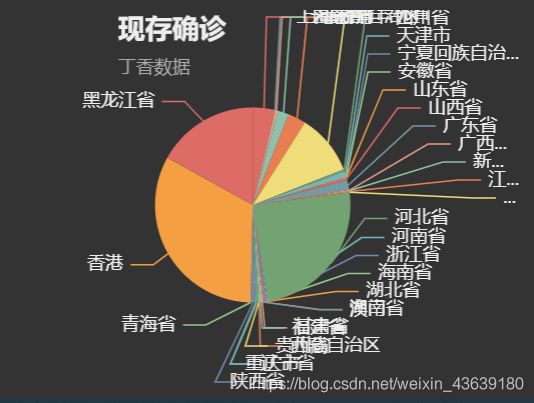
Echarts中制作饼状图-疫情
<!-- left2 -->
<script>
/*  3、基于准备好的dom,初始化echarts实例 */
var myChart = echarts.init(document.getElementById('left2'),'dark');

option = {

	    title: {

	        text: '现存确诊',
	        subtext: '丁香数据',
	        left: 'center'
	    },
	    tooltip: {

	        trigger: 'item'
	    },
	    legend: {

	        orient: 'vertical',
	        left: 'left',
	    },
	    series: [
	        {

	            name: '现存确诊',
	            type: 'pie',
	            radius: '50%',
	            data: [
	                {
     value: 1048, name: '河北省'},
	                {
     value: 735, name: '黑龙江省'},
	                {
     value: 580, name: '北京市'},
	                {
     value: 484, name: '山西省'},
	                {
     value: 300, name: '上海市'}
	            ],
	            emphasis: {

	                itemStyle: {

	                    shadowBlur: 10,
	                    shadowOffsetX: 0,
	                    shadowColor: 'rgba(0, 0, 0, 0.5)'
	                }
	            }
	        }
	    ]
	};

//5、使用刚指定的配置项和数据显示图表。
myChart.setOption(option);


</script>
Echarts中制作柱状图-疫情
<!-- right1 -->
<script type="text/javascript">
        /*  3、基于准备好的dom,初始化echarts实例 */
        var myChart = echarts.init(document.getElementById('right1'),'dark');

        // 4、指定图表的配置项和数据
        var option = {

            title: {
     /* 主标题文本 */
                text: '全国确诊省市TOP5',
                left:'left',
                textStyle:{

                	color:'white',
                	fontWeight:'bolder',
                	fontSize: 18
                }
            },
            color:['#3398DB'],
            tooltip: {
     /* 提示框组件。*/
            	 trigger : 'axis',
            	 axisPointer:{

            		 type : 'shadow'
            	 }
            },
            grid:{

            	left:'3%',
            	right:'4%',
            	bottom:'3%',
            	containLabel:true
            },
            xAxis: [
            	{

            	type:'category',
                data: ["湖北省","香港","广东省","上海市","黑龙江省"],
            	axisTick:{

            		 alignWithLabel:true
            	},
            	axisLabel:{

            		show:true,
            		color:'white',
            		fontSize:10
            	}
            }
        ],
            yAxis: {
     },
            series: [{

                name: '累计确诊',
                type: 'bar',
                data: [68150, 10222, 2115, 1660, 1476]
            }]
        };

        // 5、使用刚指定的配置项和数据显示图表。
        myChart.setOption(option);
    </script>
Echarts中制作折线图-疫情
<!-- left1 折线图  -->
<script>
/*  3、基于准备好的dom,初始化echarts实例 */
var myChart = echarts.init(document.getElementById('left1'),'dark');
option = {

	    /* title: {
	        text: '折线图堆叠'
	    }, */
	    tooltip: {

	        trigger: 'axis'
	    },
	    legend: {

	        data: ['累计确诊', '现存确诊', '治愈', '死亡']
	    },
	    grid: {

	        left: '3%',
	        right: '4%',
	        bottom: '3%',
	        containLabel: true
	    },
	    toolbox: {

	        feature: {

	            saveAsImage: {
     }
	        }
	    },
	    xAxis: {

	        type: 'category',
	        boundaryGap: false,
	        data: ['1-23', '3-16', '5-23', '8-19', '10-12', '11-11', '12-25']
	    },
	    yAxis: {

	        type: 'value'
	    },
	    series: [
	        {

	            name: '累计确诊',
	            type: 'line',
	            /* stack: '总量', */
	            data: [120, 132, 101, 134, 90, 230, 210]
	        },
	        {

	            name: '现存确诊',
	            type: 'line',
	           /*  stack: '总量', */
	            data: [220, 182, 191, 234, 290, 330, 310]
	        },
	        {

	            name: '治愈',
	            type: 'line',
	          /*   stack: '总量', */
	            data: [150, 232, 201, 154, 190, 330, 410]
	        },
	        {

	            name: '死亡',
	            type: 'line',
	           /*  stack: '总量', */
	            data: [320, 332, 301, 334, 390, 330, 320]
	        },

	    ]
	};
myChart.setOption(option);
</script>
好了。基本操作先到这里,一顿操作猛如虎,回头一看哈哈哈。
喜欢的关注一下。


