通过KNN算法预测数据所属NBA球员——Python实现
项目介绍
通过得分,篮板,助攻,出场时间四个数据来预测属于哪位球员。 选取了'LeBron James','Chris Paul','James Harden','Kevin Love','Dwight Howard'五位球员单场数据。
数据来源
本文使用数据全部来自于科赛网 ,字段解释如下:
| 字段 | 内容 |
|---|---|
| player | 球员 |
| pts | 得分 |
| reb | 篮板 |
| ast | 助攻 |
| time | 出场时间 |
| season | 赛季 |
项目内容
导入所需包
import pandas as pd
import seaborn as sns
import matplotlib.pyplot as plt
import numpy as np
from sklearn.neighbors import KNeighborsClassifier as KNN
导入数据
由于seaborn包作图对中文并不是很友好,我们将原有的字段名都设置为英文。选取我们所需要的五位球员数据命名为data。
#设置主题
sns.set(style="ticks")
#导入数据
data = pd.read_csv('/Users/***/Downloads/NBA.zip/player_season.csv',encoding = 'utf-8')

#避免seaborn包中文显示为方框问题,改为英文
data.columns = ['player', 'season', 'team', 'result', 'score', 'starter', 'time', 'made_percent', 'made', 'shoot',
       '3_made_percent', '3_made', '3_shoot', 'ft_percent', 'fta', 'ft', 'reb', u'reb_a', 'reb_b',
       'ast', 'stl', 'blk', 'tov', 'foul', 'pts']
data = data.loc[data['player'].isin(['LeBron James','Chris Paul','James Harden','Kevin Love','Dwight Howard'])]
data.head()
可视化
其实这一步本身是不需要的,但我们还是想先在训练之前看下不同球员的数据特点。
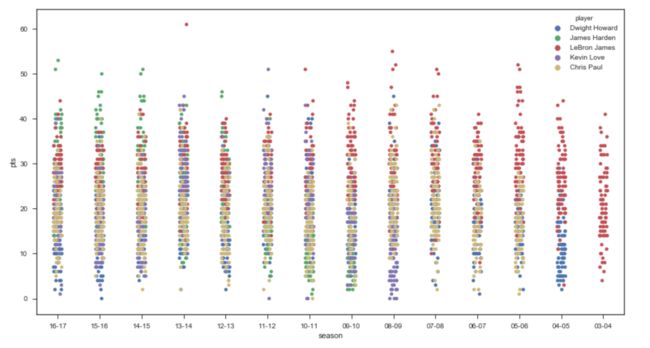
首先我们通过散点图看5位球员的得分情况
- 霍华德,哈登,勒夫在进入联盟初期都有一段适应期,都经历了两三个赛季后有较大提升,哈登上升最为明显,从当年的雷霆三少到开始独自带队之后,开启砍分模式,霍华德/勒夫最近几个赛季由于战术地位的下降,数据也开始下滑;
- 詹姆斯/保罗数据比较稳定,‘出道即巅峰,一巅十五年’说詹姆斯真是没错;
- 单从得分来看,能看出些差别,但不是很明显,尤其是都步入稳定期之后,差别很小;
- ……
plt.figure(figsize = (15,8))  #设置绘图尺寸
sns.stripplot(x='season', y='pts',data = data ,hue = 'player',jitter=True,size = 5)
接下来我们通过密度图看下5位球员在篮板助攻上的表现:
- 首先是詹姆斯,在篮板助攻上都有不错的表现,非常全面;
- 保罗助攻上表现很抢眼,组织能力出色,篮板也不错,4,5个居多
- 哈登篮板助攻都比较低,还是以得分见长;
- 勒夫/霍华德两位内线球员都是篮板数据更多,相比于霍华德,勒夫分球能力更强;
- 霍华德在助攻上有明显的三个区间,最高的那段肯定是在魔术没错了,当年可是能单换詹姆斯的人;
- ……
f, axes = plt.subplots(3, 2, figsize=(8, 12))

player_list = ['LeBron James','Chris Paul','James Harden','Kevin Love','Dwight Howard']

for ax,name,s in zip(axes.flat,player_list,np.linspace(0, 3, 5)):
    cmap = sns.cubehelix_palette(start=s, light=1, as_cmap=True)

    x = data[data['player']==name].reb
    y = data[data['player']==name].ast

    sns.kdeplot(x, y, cmap=cmap, shade=True, cut=5, ax=ax)
    ax.set(xlim=(0, 20), ylim=(0, 20))

f.tight_layout()
各项数据看完心里算是有了一个大概,每个球员都有自己的技术特点:
- 保罗善于传球,所以助攻多;
- 哈登得分能力强,但篮板助攻都偏低;
- 霍华德篮板能力强,助攻偏弱;
- 相比于霍华德,勒夫助攻要更多;
- 詹姆斯全面,从数据上就可以展现;
- ……
最后我们16-17赛季的数据作为测试集,其他赛季的数据作为训练集,看看预测准确率能够达到多少~
#取16-17赛季数据作为测试集
data_train = data[data['season']!=u'16-17']
data_test = data[data['season']==u'16-17']

#得分,篮板,助攻,出场时间为特征,球员为标签
train_x = np.array(data_train[['pts','reb','ast','time']]).tolist()
train_y = np.array(data_train[['player']]).tolist()
test_x = np.array(data_test[['pts','reb','ast','time']]).tolist()
test_y = np.array(data_test[['player']]).tolist()

#训练模型
neigh = KNN(n_neighbors=10)
neigh.fit(train_x, train_y)

#使用模型预测,最后与实际结果对计算准确率
m = 0.0
n = 0.0
for x,y in zip(test_x,test_y):
    if neigh.predict([x])[0] == y[0]:
        n = n+1
    m = m+1
print '预测准确率为:%.2f%%' % (n/m*100)
预测准确率为:49.143%
最后准确率50%不到,马马虎虎~


