吴恩达编程作业——搭建含一个隐藏层的神经网络进行数据分析
搭建含有一个隐藏层的神经网络
首先声明本文参考https://blog.csdn.net/u013733326/article/details/79702148,通过学习自己动手实现了前文中的所有功能,在此基础上实现了对于最后的“blobs”数据集的6分类,采用softmax进行多分类,希望交流学习
- testCases:提供了一些测试示例来评估函数的正确性,参见下载的资料或者在底部查看它的代码。
- planar_utils :提供了在这个任务中使用的各种有用的功能,参见下载的资料或者在底部查看它的代码。
import numpy as np
import matplotlib.pyplot as plt
from testCases import *
import sklearn
import sklearn.datasets
import sklearn.linear_model
from planar_utils import plot_decision_boundary, sigmoid, load_planar_dataset, load_extra_datasets

%matplotlib inline #如果你使用用的是Jupyter Notebook的话请取消注释。

np.random.seed(1) #设置一个固定的随机种子,以保证接下来的步骤中我们的结果是一致的。
UsageError: unrecognized arguments: #如果你使用用的是Jupyter Notebook的话请取消注释。
加载和查看数据集
X, Y = load_planar_dataset()
plt.scatter(X[0, :], X[1, :], c=np.squeeze(Y), s=40, cmap=plt.cm.Spectral) #绘制散点图
- X:一个numpy的矩阵,包含了这些数据点的数值
- Y: 一个numpy的向量,对应着的是X的标签(红色:0, 蓝色:1)
shape_X = X.shape
shape_Y = Y.shape
m = Y.shape[1]

print ("X的维度为: " + str(shape_X))
print ("Y的维度为: " + str(shape_Y))
print ("数据集里面的数据有:" + str(m) + " 个")
X的维度为: (2, 400)
Y的维度为: (1, 400)
数据集里面的数据有:400 个
查看简单的Logistic回归的分类效果
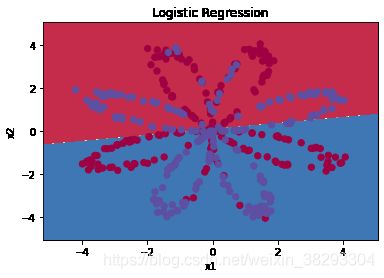
我们可以使用sklearn的内置函数来查看逻辑回归在这个问题上表现
clf = sklearn.linear_model.LogisticRegressionCV()
clf.fit(X.T,Y.T)
F:\Program Files\Anaconda3\envs\tf2.0\lib\site-packages\sklearn\utils\validation.py:760: DataConversionWarning: A column-vector y was passed when a 1d array was expected. Please change the shape of y to (n_samples, ), for example using ravel().
  y = column_or_1d(y, warn=True)
LogisticRegressionCV(Cs=10, class_weight=None, cv=None, dual=False,
                     fit_intercept=True, intercept_scaling=1.0, l1_ratios=None,
                     max_iter=100, multi_class='auto', n_jobs=None,
                     penalty='l2', random_state=None, refit=True, scoring=None,
                     solver='lbfgs', tol=0.0001, verbose=0)
Y = np.squeeze(Y)
plot_decision_boundary(lambda x: clf.predict(x), X, Y) #绘制决策边界
plt.title("Logistic Regression") #图标题
LR_predictions  = clf.predict(X.T) #预测结果
print ("逻辑回归的准确性: %d " % float((np.dot(Y, LR_predictions) +
        np.dot(1 - Y,1 - LR_predictions)) / float(Y.size) * 100) +
       "% " + "(正确标记的数据点所占的百分比)")
逻辑回归的准确性: 47 % (正确标记的数据点所占的百分比)
搭建神经网络
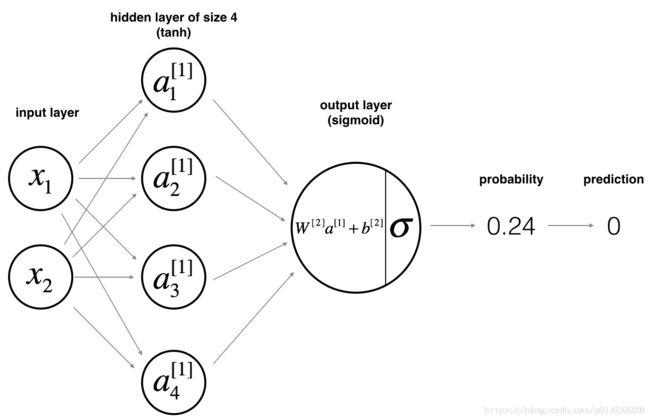
构建神经网络的一般方法是:
- 定义神经网络结构(输入单元的数量,隐藏单元的数量等)。
- 初始化模型的参数
- 循环:
- 实施前向传播
- 计算损失
- 实现向后传播
- 更新参数(梯度下降)
定义神经网络结构
def layer_sizes(X, Y):
    """
    参数:
      X - 输入数据集,维度为(输入的数量,训练/测试的数量)
      Y - 标签,维度为(输出的数量,训练/测试数量)

    返回:
      n_x - 输入层的数量
      n_h - 隐藏层的数量
      n_y - 输出层的数量
    """
    n_x = X.shape[0]
    n_h = 4
    n_y = Y.shape[0]

    return (n_x, n_h, n_y)
#测试layer_sizes
print("=========================测试layer_sizes=========================")
X_asses , Y_asses = layer_sizes_test_case()
(n_x,n_h,n_y) =  layer_sizes(X_asses,Y_asses)
print("输入层的节点数量为: n_x = " + str(n_x))
print("隐藏层的节点数量为: n_h = " + str(n_h))
print("输出层的节点数量为: n_y = " + str(n_y))
=========================测试layer_sizes=========================
输入层的节点数量为: n_x = 5
隐藏层的节点数量为: n_h = 4
输出层的节点数量为: n_y = 2
初始化模型的参数
np.random.randn(a,b)* 0.01来随机初始化一个维度为(a,b)的矩阵。np.zeros((a,b))用零初始化矩阵(a,b)。
def initialize_parameters(n_x, n_h, n_y):
    """
    参数:
        n_x - 输入层节点的数量
        n_h - 隐藏层节点的数量
        n_y - 输出层节点的数量

    返回:
        parameters - 包含参数的字典:
            W1 - 权重矩阵,维度为(n_h,n_x)
            b1 - 偏向量,维度为(n_h,1)
            W2 - 权重矩阵,维度为(n_y,n_h)
            b2 - 偏向量,维度为(n_y,1)
    """
    np.random.seed(2) # 指定一个随机种子,以便你的输出与我们的一样
    W1 = np.random.rand(n_h, n_x) * 0.01
    b1 = np.zeros(shape=(n_h, 1))
    W2 = np.random.rand(n_y, n_h) * 0.01
    b2 = np.zeros(shape=(n_y, 1))

    #使用断言确保我的数据格式是正确的
    assert(W1.shape == ( n_h , n_x ))
    assert(b1.shape == ( n_h , 1 ))
    assert(W2.shape == ( n_y , n_h ))
    assert(b2.shape == ( n_y , 1 ))

    parameters = {
     "W1" : W1,
                  "b1" : b1,
                  "W2" : W2,
                  "b2" : b2}
    return parameters
#测试initialize_parameters
print("=========================测试initialize_parameters=========================")
n_x , n_h , n_y = initialize_parameters_test_case()
parameters = initialize_parameters(n_x , n_h , n_y)
print("W1 = " + str(parameters["W1"]))
print("b1 = " + str(parameters["b1"]))
print("W2 = " + str(parameters["W2"]))
print("b2 = " + str(parameters["b2"]))
=========================测试initialize_parameters=========================
W1 = [[0.00435995 0.00025926]
 [0.00549662 0.00435322]
 [0.00420368 0.00330335]
 [0.00204649 0.00619271]]
b1 = [[0.]
 [0.]
 [0.]
 [0.]]
W2 = [[0.00299655 0.00266827 0.00621134 0.00529142]]
b2 = [[0.]]
循环
前向传播
def forward_propagation(X , parameters):
    """
    参数:
         X - 维度为(n_x,m)的输入数据。
         parameters - 初始化函数(initialize_parameters)的输出

    返回:
         A2 - 使用sigmoid()函数计算的第二次激活后的数值
         cache - 包含“Z1”,“A1”,“Z2”和“A2”的字典类型变量
     """
    W1 = parameters["W1"]
    b1 = parameters["b1"]
    W2 = parameters["W2"]
    b2 = parameters["b2"]

    # 前向传播计算A2
    Z1 = np.dot(W1, X) + b1
    A1 = np.tanh(Z1)
    Z2 = np.dot(W2, A1) + b2
    A2 = sigmoid(Z2)

    # 使用断言确保数据的格式是正确的
    assert(A2.shape == (1, X.shape[1]))
    cache = {
     "Z1": Z1,
             "A1": A1,
             "Z2": Z2,
             "A2": A2}

    return (A2, cache)
#测试forward_propagation
print("=========================测试forward_propagation=========================")
X_assess, parameters = forward_propagation_test_case()
A2, cache = forward_propagation(X_assess, parameters)
print(np.mean(cache["Z1"]), np.mean(cache["A1"]), np.mean(cache["Z2"]), np.mean(cache["A2"]))
=========================测试forward_propagation=========================
-0.0004997557777419902 -0.000496963353231779 0.00043818745095914653 0.500109546852431
计算损失
def compute_cost(A2, Y, parameters):
    """
    计算方程(6)中给出的交叉熵成本,

    参数:
         A2 - 使用sigmoid()函数计算的第二次激活后的数值
         Y - "True"标签向量,维度为(1,数量)
         parameters - 一个包含W1,B1,W2和B2的字典类型的变量

    返回:
         成本 - 交叉熵成本给出方程(13)
    """
    m = Y.shape[1]
    W1 = parameters["W1"]
    W2 = parameters["W2"]

    # 计算成本
    logprobs = np.multiply(np.log(A2), Y) + np.multiply(np.log(1- A2), 1- Y)
    cost = - np.sum(logprobs) / m
    cost = float(np.squeeze(cost))

    assert(isinstance(cost,float))

    return cost
#测试compute_cost
print("=========================测试compute_cost=========================")
A2 , Y_assess , parameters = compute_cost_test_case()
print("cost = " + str(compute_cost(A2,Y_assess,parameters)))
=========================测试compute_cost=========================
cost = 0.6929198937761266
反向传播
def backward_propagation(parameters, cache, X , Y):
    """
    使用上述说明搭建反向传播函数。

    参数:
     parameters - 包含我们的参数的一个字典类型的变量。
     cache - 包含“Z1”,“A1”,“Z2”和“A2”的字典类型的变量。
     X - 输入数据,维度为(2,数量)
     Y - “True”标签,维度为(1,数量)

    返回:
     grads - 包含W和b的导数一个字典类型的变量。
    """
    m = X.shape[1]

    W1 = parameters["W1"]
    W2 = parameters["W2"]

    A1 = cache["A1"]
    A2 = cache["A2"]

    dZ2= A2 - Y
    dW2 = (1 / m) * np.dot(dZ2, A1.T)
    db2 = (1 / m) * np.sum(dZ2, axis=1, keepdims=True)
    dZ1 = np.multiply(np.dot(W2.T, dZ2), 1 - np.power(A1, 2))
    dW1 = (1 / m) * np.dot(dZ1, X.T)
    db1 = (1 / m) * np.sum(dZ1, axis=1, keepdims=True)
    grads = {
     "dW1": dW1,
             "db1": db1,
             "dW2": dW2,
             "db2": db2 }

    return grads
#测试backward_propagation
print("=========================测试backward_propagation=========================")
parameters, cache, X_assess, Y_assess = backward_propagation_test_case()

grads = backward_propagation(parameters, cache, X_assess, Y_assess)
print ("dW1 = "+ str(grads["dW1"]))
print ("db1 = "+ str(grads["db1"]))
print ("dW2 = "+ str(grads["dW2"]))
print ("db2 = "+ str(grads["db2"]))
=========================测试backward_propagation=========================
dW1 = [[ 0.01018708 -0.00708701]
 [ 0.00873447 -0.0060768 ]
 [-0.00530847  0.00369379]
 [-0.02206365  0.01535126]]
db1 = [[-0.00069728]
 [-0.00060606]
 [ 0.000364  ]
 [ 0.00151207]]
dW2 = [[ 0.00363613  0.03153604  0.01162914 -0.01318316]]
db2 = [[0.06589489]]
更新权重
def update_parameters(parameters,grads,learning_rate=1.2):
    """
    使用上面给出的梯度下降更新规则更新参数

    参数:
     parameters - 包含参数的字典类型的变量。
     grads - 包含导数值的字典类型的变量。
     learning_rate - 学习速率

    返回:
     parameters - 包含更新参数的字典类型的变量。
    """
    W1,W2 = parameters["W1"],parameters["W2"]
    b1,b2 = parameters["b1"],parameters["b2"]

    dW1,dW2 = grads["dW1"],grads["dW2"]
    db1,db2 = grads["db1"],grads["db2"]

    W1 = W1 - learning_rate * dW1
    b1 = b1 - learning_rate * db1
    W2 = W2 - learning_rate * dW2
    b2 = b2 - learning_rate * db2

    parameters = {
     "W1": W1,
                  "b1": b1,
                  "W2": W2,
                  "b2": b2}

    return parameters
#测试update_parameters
print("=========================测试update_parameters=========================")
parameters, grads = update_parameters_test_case()
parameters = update_parameters(parameters, grads)

print("W1 = " + str(parameters["W1"]))
print("b1 = " + str(parameters["b1"]))
print("W2 = " + str(parameters["W2"]))
print("b2 = " + str(parameters["b2"]))
=========================测试update_parameters=========================
W1 = [[-0.00643025  0.01936718]
 [-0.02410458  0.03978052]
 [-0.01653973 -0.02096177]
 [ 0.01046864 -0.05990141]]
b1 = [[-1.02420756e-06]
 [ 1.27373948e-05]
 [ 8.32996807e-07]
 [-3.20136836e-06]]
W2 = [[-0.01041081 -0.04463285  0.01758031  0.04747113]]
b2 = [[0.00010457]]
整合
def nn_model(X,Y,n_h,num_iterations,learning_rate=0.5,print_cost=False):
    """
    参数:
        X - 数据集,维度为(2,示例数)
        Y - 标签,维度为(1,示例数)
        n_h - 隐藏层的数量
        num_iterations - 梯度下降循环中的迭代次数
        print_cost - 如果为True,则每1000次迭代打印一次成本数值

    返回:
        parameters - 模型学习的参数,它们可以用来进行预测。
     """

    np.random.seed(3) #指定随机种子
    n_x = layer_sizes(X, Y)[0]
    n_y = layer_sizes(X, Y)[2]

    parameters = initialize_parameters(n_x,n_h,n_y)
    W1 = parameters["W1"]
    b1 = parameters["b1"]
    W2 = parameters["W2"]
    b2 = parameters["b2"]

    for i in range(num_iterations):
        A2 , cache = forward_propagation(X,parameters)
        cost = compute_cost(A2,Y,parameters)
        grads = backward_propagation(parameters,cache,X,Y)
        parameters = update_parameters(parameters,grads,learning_rate = learning_rate)

        if print_cost:
            if i%1000 == 0:
                print("第 ",i," 次循环,成本为:"+str(cost))
    return parameters
#测试nn_model
print("=========================测试nn_model=========================")
X_assess, Y_assess = nn_model_test_case()

parameters = nn_model(X_assess, Y_assess, 4, num_iterations=10000,learning_rate=0.5, print_cost=False)
print("W1 = " + str(parameters["W1"]))
print("b1 = " + str(parameters["b1"]))
print("W2 = " + str(parameters["W2"]))
print("b2 = " + str(parameters["b2"]))
=========================测试nn_model=========================
F:\Program Files\Anaconda3\envs\tf2.0\lib\site-packages\ipykernel_launcher.py:18: RuntimeWarning: divide by zero encountered in log
E:\juypter notebook\吴恩达深度学习编程作业\新建文件夹\planar_utils.py:25: RuntimeWarning: overflow encountered in exp
  s = 1/(1+np.exp(-x))
W1 = [[ 6.77962262 -1.20251908]
 [ 3.88054479 -4.78255014]
 [ 6.77957337 -1.20259341]
 [ 3.91283855 -4.76226051]]
b1 = [[-3.41156836]
 [-2.11502992]
 [-3.41180795]
 [-2.11394815]]
W2 = [[2501.9026286  2512.05642635 2502.1219803  2511.85584867]]
b2 = [[-22.61274856]]
预测
def predict(parameters,X):
    """
    使用学习的参数,为X中的每个示例预测一个类

    参数:
        parameters - 包含参数的字典类型的变量。
        X - 输入数据(n_x,m)

    返回
        predictions - 我们模型预测的向量(红色:0 /蓝色:1)

     """
    A2 , cache = forward_propagation(X,parameters)
    predictions = np.round(A2)

    return predictions
#测试predict
print("=========================测试predict=========================")

parameters, X_assess = predict_test_case()

predictions = predict(parameters, X_assess)
print("预测的平均值 = " + str(np.mean(predictions)))
=========================测试predict=========================
预测的平均值 = 0.6666666666666666
X, Y = load_planar_dataset()

parameters = nn_model(X, Y, n_h = 4, num_iterations=10000,learning_rate=0.5, print_cost=True)

#绘制边界
plot_decision_boundary(lambda x: predict(parameters, x.T), X, np.squeeze(Y))
plt.title("Decision Boundary for hidden layer size " + str(4))

predictions = predict(parameters, X)
print ('准确率: %d' % float((np.dot(Y, predictions.T) + np.dot(1 - Y, 1 - predictions.T)) / float(Y.size) * 100) + '%')
第  0  次循环,成本为:0.6931586620054873
第  1000  次循环,成本为:0.3105418538607143
第  2000  次循环,成本为:0.2933016516189315
第  3000  次循环,成本为:0.284426182780695
第  4000  次循环,成本为:0.27809983960632034
第  5000  次循环,成本为:0.2729885982112937
第  6000  次循环,成本为:0.2658930763526426
第  7000  次循环,成本为:0.24033551091862504
第  8000  次循环,成本为:0.2339493804055549
第  9000  次循环,成本为:0.23001665584776734
准确率: 90%
更改隐藏层节点数量
plt.figure(figsize=(16, 32))
hidden_layer_sizes = [1, 2, 3, 4, 5, 10, 50] #隐藏层数量
for i, n_h in enumerate(hidden_layer_sizes):
    plt.subplot(5, 2, i + 1)
    plt.title('Hidden Layer of size %d' % n_h)
    parameters = nn_model(X, Y, n_h, num_iterations=5000)
    plot_decision_boundary(lambda x: predict(parameters, x.T), X, np.squeeze(Y))
    predictions = predict(parameters, X)
    accuracy = float((np.dot(Y, predictions.T) + np.dot(1 - Y, 1 - predictions.T)) / float(Y.size) * 100)
    print ("隐藏层的节点数量: {}  ,准确率: {} %".format(n_h, accuracy))
隐藏层的节点数量: 1  ,准确率: 67.25 %
隐藏层的节点数量: 2  ,准确率: 66.5 %
隐藏层的节点数量: 3  ,准确率: 89.5 %
隐藏层的节点数量: 4  ,准确率: 89.75 %
隐藏层的节点数量: 5  ,准确率: 90.25 %
隐藏层的节点数量: 10  ,准确率: 90.75 %
隐藏层的节点数量: 50  ,准确率: 90.0 %
探索
# 数据集
noisy_circles, noisy_moons, blobs, gaussian_quantiles, no_structure = load_extra_datasets()

datasets = {
     "noisy_circles": noisy_circles,
            "noisy_moons": noisy_moons,
            "blobs": blobs,
            "gaussian_quantiles": gaussian_quantiles}

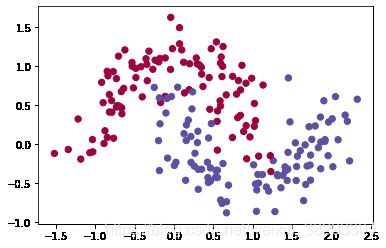
dataset = "noisy_moons"

X, Y = datasets[dataset]
X, Y = X.T, Y.reshape(1, Y.shape[0])

if dataset == "blobs":
    Y = Y % 2

plt.scatter(X[0, :], X[1, :], c=np.squeeze(Y), s=40, cmap=plt.cm.Spectral)
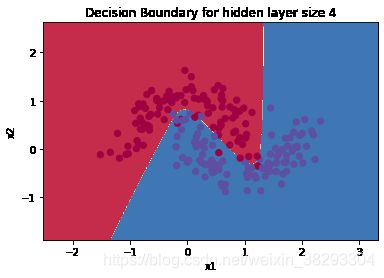
parameters = nn_model(X, Y, n_h = 4, num_iterations=10000,learning_rate= 0.5 ,print_cost=True)

#绘制边界
plot_decision_boundary(lambda x: predict(parameters, x.T), X, np.squeeze(Y))
plt.title("Decision Boundary for hidden layer size " + str(4))

predictions = predict(parameters, X)
print ('准确率: %d' % float((np.dot(Y, predictions.T) + np.dot(1 - Y, 1 - predictions.T)) / float(Y.size) * 100) + '%')
第  0  次循环,成本为:0.6931438511638413
第  1000  次循环,成本为:0.32654432451789817
第  2000  次循环,成本为:0.32589266506729897
第  3000  次循环,成本为:0.32556680216270645
第  4000  次循环,成本为:0.32528794843480896
第  5000  次循环,成本为:0.32471534759736703
第  6000  次循环,成本为:0.11358931682256697
第  7000  次循环,成本为:0.09821826543340158
第  8000  次循环,成本为:0.09515334310454593
第  9000  次循环,成本为:0.09372601272443966
准确率: 96%
X, Y = datasets["noisy_circles"]
X, Y = X.T, Y.reshape(1, Y.shape[0])

if dataset == "blobs":
    Y = Y % 2

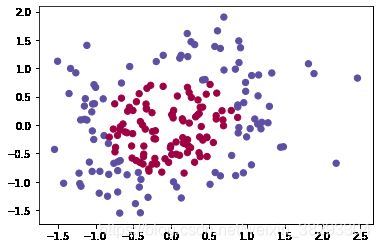
plt.scatter(X[0, :], X[1, :], c=np.squeeze(Y), s=40, cmap=plt.cm.Spectral)
[外链图片转存失败,源站可能有防盗链机制,建议将图片保存下来直接上传(img-KQ01ye8y-1595750917075)(output_47_1.png)]
parameters = nn_model(X, Y, n_h = 4, num_iterations=10000,learning_rate= 0.5 ,print_cost=True)

#绘制边界
plot_decision_boundary(lambda x: predict(parameters, x.T), X, np.squeeze(Y))
plt.title("Decision Boundary for hidden layer size " + str(4))

predictions = predict(parameters, X)
print ('准确率: %d' % float((np.dot(Y, predictions.T) + np.dot(1 - Y, 1 - predictions.T)) / float(Y.size) * 100) + '%')
第  0  次循环,成本为:0.6931457786347083
第  1000  次循环,成本为:0.6883960605426281
第  2000  次循环,成本为:0.4414841278453237
第  3000  次循环,成本为:0.4340232169269984
第  4000  次循环,成本为:0.432230474912991
第  5000  次循环,成本为:0.43091913604989246
第  6000  次循环,成本为:0.4283296739374367
第  7000  次循环,成本为:0.41972866670866454
第  8000  次循环,成本为:0.4137252336321846
第  9000  次循环,成本为:0.4119040213719174
准确率: 80%
X, Y = datasets["gaussian_quantiles"]
X, Y = X.T, Y.reshape(1, Y.shape[0])

if dataset == "blobs":
    Y = Y % 2

plt.scatter(X[0, :], X[1, :], c=np.squeeze(Y), s=40, cmap=plt.cm.Spectral)
parameters = nn_model(X, Y, n_h = 4, num_iterations=10000,learning_rate= 0.5 ,print_cost=True)

#绘制边界
plot_decision_boundary(lambda x: predict(parameters, x.T), X, np.squeeze(Y))
plt.title("Decision Boundary for hidden layer size " + str(4))

predictions = predict(parameters, X)
print ('准确率: %d' % float((np.dot(Y, predictions.T) + np.dot(1 - Y, 1 - predictions.T)) / float(Y.size) * 100) + '%')
第  0  次循环,成本为:0.6931432224936229
第  1000  次循环,成本为:0.23416382246698736
第  2000  次循环,成本为:0.10421006990099499
第  3000  次循环,成本为:0.0826544174858772
第  4000  次循环,成本为:0.07163531039648277
第  5000  次循环,成本为:0.06465496567803554
第  6000  次循环,成本为:0.0597297842318288
第  7000  次循环,成本为:0.05601638389122446
第  8000  次循环,成本为:0.05308711695055919
第  9000  次循环,成本为:0.05069906108856062
准确率: 99%
[外链图片转存失败,源站可能有防盗链机制,建议将图片保存下来直接上传(img-Hv5tyqOD-1595750917078)(output_50_1.png)]
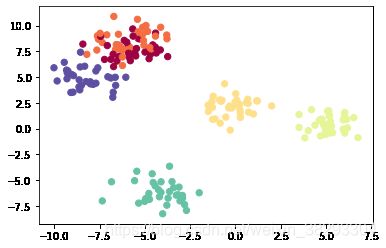
X, Y = datasets["blobs"]
X, Y = X.T, Y.reshape(1, Y.shape[0])

if dataset == "blobs":
    Y = Y % 2

plt.scatter(X[0, :], X[1, :], c=np.squeeze(Y), s=40, cmap=plt.cm.Spectral)
实现对blobs数据的分类
Y
array([[2, 3, 4, 3, 1, 2, 5, 2, 0, 2, 0, 1, 0, 0, 4, 2, 0, 4, 4, 2, 4, 1,
        2, 5, 1, 0, 5, 0, 2, 3, 4, 2, 3, 0, 5, 2, 2, 0, 2, 5, 0, 4, 1, 1,
        0, 0, 3, 5, 0, 0, 2, 0, 3, 0, 5, 2, 5, 2, 1, 0, 2, 4, 4, 2, 5, 4,
        3, 5, 1, 4, 2, 3, 2, 1, 1, 4, 1, 3, 1, 3, 2, 3, 4, 5, 1, 4, 4, 0,
        0, 2, 4, 2, 5, 4, 0, 4, 5, 3, 1, 3, 3, 1, 0, 1, 2, 1, 1, 3, 3, 0,
        5, 0, 5, 2, 1, 5, 3, 3, 1, 4, 2, 5, 1, 3, 3, 5, 2, 1, 3, 4, 0, 5,
        1, 1, 1, 5, 3, 1, 0, 0, 5, 3, 5, 5, 2, 3, 5, 4, 1, 0, 5, 4, 2, 5,
        5, 2, 0, 0, 1, 3, 3, 3, 3, 0, 2, 4, 0, 4, 4, 1, 3, 0, 4, 5, 2, 4,
        4, 5, 1, 1, 3, 5, 1, 4, 4, 1, 2, 5, 0, 4, 3, 1, 5, 4, 3, 4, 2, 5,
        3, 0]])
X.shape, Y.shape
((2, 200), (1, 200))
# 定义处理blobs数据的模型结构
n_x = X.shape[0]
n_h = 4
n_y = Y.max() + 1
n_x, n_h, n_y
(2, 4, 6)
# 初始化参数权重
np.random.seed(2) #指定一个随机种子,以便你的输出与我们的一样。
W1 = np.random.randn(n_h,n_x) * 0.01
b1 = np.zeros(shape=(n_h, 1))
W2 = np.random.randn(n_y,n_h) * 0.01
b2 = np.zeros(shape=(n_y, 1))
# 将Y转换为 one-hot矩阵
num_class = 6
Y_onehot = np.eye(num_class)[Y]
Y_onehot = np.squeeze(Y_onehot)
Y_onehot, Y_onehot.shape
(array([[0., 0., 1., 0., 0., 0.],
        [0., 0., 0., 1., 0., 0.],
        [0., 0., 0., 0., 1., 0.],
        ...,
        [0., 0., 0., 0., 0., 1.],
        [0., 0., 0., 1., 0., 0.],
        [1., 0., 0., 0., 0., 0.]]), (200, 6))
# 实现softmax函数
def sotfmax(Z):
    A = np.exp(Z)/np.sum(np.exp(Z))
    return A
# 前向传播
Z1 = np.dot(W1, X) + b1
A1 = np.tanh(Z1)
Z2 = np.dot(W2, A1) + b2
A2 = sotfmax(Z2)

A2.shape
(6, 200)
# 定义损失函数
Y_onehot = Y_onehot.transpose(1,0)
logprobs = np.multiply(Y_onehot, np.log(A2))
cost = - np.sum(logprobs) / 200
cost = float(np.squeeze(cost))
cost
7.091483556059716
# 反向传播
dZ2= A2 - Y_onehot
dW2 = (1 / 200) * np.dot(dZ2, A1.T)
db2 = (1 / 200) * np.sum(dZ2, axis=1, keepdims=True)
dZ1 = np.multiply(np.dot(W2.T, dZ2), 1 - np.power(A1, 2))
dW1 = (1 / 200) * np.dot(dZ1, X.T)
db1 = (1 / 200) * np.sum(dZ1, axis=1, keepdims=True)
# 更新权重
learning_rate =0.5
W1 = W1 - learning_rate * dW1
b1 = b1 - learning_rate * db1
W2 = W2 - learning_rate * dW2
b2 = b2 - learning_rate * db2
## 整合

X, Y = datasets["blobs"]
X, Y = X.T, Y.reshape(1, Y.shape[0])

if dataset == "blobs":
    Y = Y % 2

plt.scatter(X[0, :], X[1, :], c=np.squeeze(Y), s=40, cmap=plt.cm.Spectral)

num_class = 6
num_x = 200
num_iterations = 100000
learning_rate =0.001

# 定义处理blobs数据的模型结构
n_x = X.shape[0]
n_h = 10
n_y = 6

# 将Y转换为 one-hot矩阵
Y_onehot = np.eye(num_class)[Y]
Y_onehot = np.squeeze(Y_onehot)
Y_onehot = Y_onehot.transpose(1,0)

# 实现softmax函数
def sotfmax(Z):
    A = np.exp(Z)/np.sum(np.exp(Z),axis=0)
    return A

# 初始化参数权重
np.random.seed(3) #指定一个随机种子,以便你的输出与我们的一样。
W1 = np.random.randn(n_h,n_x) * 0.01
b1 = np.zeros(shape=(n_h, 1))
W2 = np.random.randn(n_y,n_h) * 0.01
b2 = np.zeros(shape=(n_y, 1))

for i in range(num_iterations):
    Z1 = np.dot(W1, X) + b1
    A1 = np.tanh(Z1)
    Z2 = np.dot(W2, A1) + b2
    A2 = sotfmax(Z2)

    logprobs = np.multiply(Y_onehot, np.log(A2))
    cost = - np.sum(logprobs) / num_x
    cost = float(np.squeeze(cost))

    dZ2= A2 - Y_onehot
    dW2 = (1 / num_x) * np.dot(dZ2, A1.T)
    db2 = (1 / num_x) * np.sum(dZ2, axis=1, keepdims=True)
    dZ1 = np.multiply(np.dot(W2.T, dZ2), 1 - np.power(A1, 2))
    dW1 = (1 / num_x) * np.dot(dZ1, X.T)
    db1 = (1 / num_x) * np.sum(dZ1, axis=1, keepdims=True)

    W1 = W1 - learning_rate * dW1
    b1 = b1 - learning_rate * db1
    W2 = W2 - learning_rate * dW2
    b2 = b2 - learning_rate * db2
    if i%1000 == 0:
        print("第 ",i," 次循环,成本为:"+str(cost))
第  0  次循环,成本为:1.7916803120519142
第  1000  次循环,成本为:1.7287543276996202
第  2000  次循环,成本为:1.4461862433784824
第  3000  次循环,成本为:1.2130951767271876
第  4000  次循环,成本为:1.0504657310659369
第  5000  次循环,成本为:0.9289667117694779
第  6000  次循环,成本为:0.8339634075805266
第  7000  次循环,成本为:0.7582116939107046
第  8000  次循环,成本为:0.6969300121174165
第  9000  次循环,成本为:0.6463576785880705
第  10000  次循环,成本为:0.6037214465939013
第  11000  次循环,成本为:0.5671373029556971
第  12000  次循环,成本为:0.5353717776708582
第  13000  次循环,成本为:0.5076026659046426
第  14000  次循环,成本为:0.4832457378627725
第  15000  次循环,成本为:0.46184529638437655
第  16000  次循环,成本为:0.44301376011003696
第  17000  次循环,成本为:0.4264078430887138
第  18000  次循环,成本为:0.4117247951871863
第  19000  次循环,成本为:0.39870275045015147
第  20000  次循环,成本为:0.3871183687659884
第  21000  次循环,成本为:0.3767821280709222
第  22000  次循环,成本为:0.36753307885348235
第  23000  次循环,成本为:0.35923405828954086
第  24000  次循环,成本为:0.3517676516558599
第  25000  次循环,成本为:0.3450328907510301
第  26000  次循环,成本为:0.3389425873602622
第  27000  次循环,成本为:0.33342118277816757
第  28000  次循环,成本为:0.3284030037338915
第  29000  次循环,成本为:0.3238308334955287
第  30000  次循环,成本为:0.3196547268521986
第  31000  次循环,成本为:0.31583101542866393
第  32000  次循环,成本为:0.31232146399039123
第  33000  次循环,成本为:0.30909254897206273
第  34000  次循环,成本为:0.306114837963486
第  35000  次循环,成本为:0.3033624540524739
第  36000  次循环,成本为:0.3008126124436669
第  37000  次循环,成本为:0.2984452191924288
第  38000  次循环,成本为:0.2962425236066932
第  39000  次循环,成本为:0.2941888171392911
第  40000  次循环,成本为:0.29227017258416377
第  41000  次循环,成本为:0.2904742182012941
第  42000  次循环,成本为:0.28878994208447795
第  43000  次循环,成本为:0.28720752268546235
第  44000  次循环,成本为:0.2857181819355407
第  45000  次循环,成本为:0.2843140578719986
第  46000  次循环,成本为:0.282988094088693
第  47000  次循环,成本为:0.2817339436927442
第  48000  次循环,成本为:0.28054588576732736
第  49000  次循环,成本为:0.27941875261814486
第  50000  次循环,成本为:0.27834786632243086
第  51000  次循环,成本为:0.2773289833082769
第  52000  次循环,成本为:0.27635824587241115
第  53000  次循环,成本为:0.2754321396998421
第  54000  次循环,成本为:0.27454745658220275
第  55000  次循环,成本为:0.27370126164610803
第  56000  次循环,成本为:0.2728908645009587
第  57000  次循环,成本为:0.2721137937996528
第  58000  次循环,成本为:0.2713677747775942
第  59000  次循环,成本为:0.2706507093969077
第  60000  次循环,成本为:0.269960658775352
第  61000  次循环,成本为:0.26929582762428944
第  62000  次循环,成本为:0.2686545504582729
第  63000  次循环,成本为:0.26803527937122135
第  64000  次循环,成本为:0.2674365732015069
第  65000  次循环,成本为:0.2668570879312083
第  66000  次循环,成本为:0.2662955681838478
第  67000  次循环,成本为:0.26575083970062346
第  68000  次循环,成本为:0.26522180268796774
第  69000  次循环,成本为:0.26470742593968144
第  70000  次循环,成本为:0.264206741645413
第  71000  次循环,成本为:0.2637188408043773
第  72000  次循环,成本为:0.2632428691694299
第  73000  次循环,成本为:0.26277802365241615
第  74000  次循环,成本为:0.262323549127462
第  75000  次循环,成本为:0.26187873557486563
第  76000  次循环,成本为:0.2614429155145829
第  77000  次循环,成本为:0.2610154616849604
第  78000  次循环,成本为:0.2605957849291499
第  79000  次循环,成本为:0.2601833322582616
第  80000  次循环,成本为:0.2597775850664343
第  81000  次循环,成本为:0.25937805747831477
第  82000  次循环,成本为:0.2589842948137168
第  83000  次循环,成本为:0.2585958721573664
第  84000  次循环,成本为:0.25821239302365007
第  85000  次循环,成本为:0.2578334881073088
第  86000  次循环,成本为:0.2574588141112612
第  87000  次循环,成本为:0.2570880526424556
第  88000  次循环,成本为:0.2567209091660916
第  89000  次循环,成本为:0.25635711200795486
第  90000  次循环,成本为:0.2559964113941652
第  91000  次循环,成本为:0.255638578517493
第  92000  次循环,成本为:0.2552834046196587
第  93000  次循环,成本为:0.254930700079723
第  94000  次循环,成本为:0.2545802934998229
第  95000  次循环,成本为:0.25423203078106177
第  96000  次循环,成本为:0.2538857741842426
第  97000  次循环,成本为:0.2535414013722579
第  98000  次循环,成本为:0.2531988044331816
第  99000  次循环,成本为:0.2528578888853391
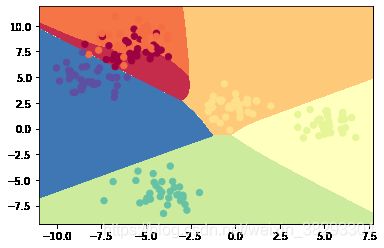
x_min, x_max = X[0, :].min() - 1, X[0, :].max() + 1
y_min, y_max = X[1, :].min() - 1, X[1, :].max() + 1

# np.meshgrid()将一维生成二维
xx, yy = np.meshgrid(np.arange(x_min, x_max, .02),
                     np.arange(y_min, y_max, .02))

# np.c_[]将数据合并合成两列   ravel()将数据降为一维
Z1 = np.dot(W1, (np.c_[xx.ravel(), yy.ravel()]).T) + b1
A1 = np.tanh(Z1)
Z2 = np.dot(W2, A1) + b2
A2 = sotfmax(Z2)
A2 = np.argmax(A2, axis=0)
A2 = A2.reshape(xx.shape)


# cmap设置样式  pcolormesh绘制分类图
# plt.pcolormesh(xx, yy, A2, cmap=plt.cm.Spectral, alpha=0.8)
plt.contourf(xx, yy, A2, cmap=plt.cm.Spectral)
plt.scatter(X[0, :], X[1, :], c=np.squeeze(Y), s=40, cmap=plt.cm.Spectral)
plt.show()
planar_utils文件内容
import matplotlib.pyplot as plt
import numpy as np
import sklearn
import sklearn.datasets
import sklearn.linear_model

def plot_decision_boundary(model, X, Y):
    # Set min and max values and give it some padding
    x_min, x_max = X[0, :].min() - 1, X[0, :].max() + 1
    y_min, y_max = X[1, :].min() - 1, X[1, :].max() + 1
    h = 0.01
    # Generate a grid of points with distance h between them
    xx, yy = np.meshgrid(np.arange(x_min, x_max, h), np.arange(y_min, y_max, h))
    # Predict the function value for the whole grid
    Z = model(np.c_[xx.ravel(), yy.ravel()])
    Z = Z.reshape(xx.shape)
    # Plot the contour and training examples
    plt.contourf(xx, yy, Z, cmap=plt.cm.Spectral)
    plt.ylabel('x2')
    plt.xlabel('x1')
    plt.scatter(X[0, :], X[1, :], c=Y, s=40, cmap=plt.cm.Spectral) #绘制散点图


def sigmoid(x):
    s = 1/(1+np.exp(-x))
    return s

def load_planar_dataset():
    np.random.seed(1)
    m = 400 # number of examples
    N = int(m/2) # number of points per class
    D = 2 # dimensionality
    X = np.zeros((m,D)) # data matrix where each row is a single example
    Y = np.zeros((m,1), dtype='uint8') # labels vector (0 for red, 1 for blue)
    a = 4 # maximum ray of the flower

    for j in range(2):
        ix = range(N*j,N*(j+1))
        t = np.linspace(j*3.12,(j+1)*3.12,N) + np.random.randn(N)*0.2 # theta
        r = a*np.sin(4*t) + np.random.randn(N)*0.2 # radius
        X[ix] = np.c_[r*np.sin(t), r*np.cos(t)]
        Y[ix] = j

    X = X.T
    Y = Y.T

    return X, Y

def load_extra_datasets():
    N = 200
    noisy_circles = sklearn.datasets.make_circles(n_samples=N, factor=.5, noise=.3)
    noisy_moons = sklearn.datasets.make_moons(n_samples=N, noise=.2)
    blobs = sklearn.datasets.make_blobs(n_samples=N, random_state=5, n_features=2, centers=6)
    gaussian_quantiles = sklearn.datasets.make_gaussian_quantiles(mean=None, cov=0.5, n_samples=N, n_features=2, n_classes=2, shuffle=True, random_state=None)
    no_structure = np.random.rand(N, 2), np.random.rand(N, 2)

    return noisy_circles, noisy_moons, blobs, gaussian_quantiles, no_structure
testCases
#-*- coding: UTF-8 -*-
"""
# WANGZHE12
"""
import numpy as np

def layer_sizes_test_case():
    np.random.seed(1)
    X_assess = np.random.randn(5, 3)
    Y_assess = np.random.randn(2, 3)
    return X_assess, Y_assess

def initialize_parameters_test_case():
    n_x, n_h, n_y = 2, 4, 1
    return n_x, n_h, n_y

def forward_propagation_test_case():
    np.random.seed(1)
    X_assess = np.random.randn(2, 3)

    parameters = {
     'W1': np.array([[-0.00416758, -0.00056267],
        [-0.02136196,  0.01640271],
        [-0.01793436, -0.00841747],
        [ 0.00502881, -0.01245288]]),
     'W2': np.array([[-0.01057952, -0.00909008,  0.00551454,  0.02292208]]),
     'b1': np.array([[ 0.],
        [ 0.],
        [ 0.],
        [ 0.]]),
     'b2': np.array([[ 0.]])}

    return X_assess, parameters

def compute_cost_test_case():
    np.random.seed(1)
    Y_assess = np.random.randn(1, 3)
    parameters = {
     'W1': np.array([[-0.00416758, -0.00056267],
        [-0.02136196,  0.01640271],
        [-0.01793436, -0.00841747],
        [ 0.00502881, -0.01245288]]),
     'W2': np.array([[-0.01057952, -0.00909008,  0.00551454,  0.02292208]]),
     'b1': np.array([[ 0.],
        [ 0.],
        [ 0.],
        [ 0.]]),
     'b2': np.array([[ 0.]])}

    a2 = (np.array([[ 0.5002307 ,  0.49985831,  0.50023963]]))

    return a2, Y_assess, parameters

def backward_propagation_test_case():
    np.random.seed(1)
    X_assess = np.random.randn(2, 3)
    Y_assess = np.random.randn(1, 3)
    parameters = {
     'W1': np.array([[-0.00416758, -0.00056267],
        [-0.02136196,  0.01640271],
        [-0.01793436, -0.00841747],
        [ 0.00502881, -0.01245288]]),
     'W2': np.array([[-0.01057952, -0.00909008,  0.00551454,  0.02292208]]),
     'b1': np.array([[ 0.],
        [ 0.],
        [ 0.],
        [ 0.]]),
     'b2': np.array([[ 0.]])}

    cache = {
     'A1': np.array([[-0.00616578,  0.0020626 ,  0.00349619],
         [-0.05225116,  0.02725659, -0.02646251],
         [-0.02009721,  0.0036869 ,  0.02883756],
         [ 0.02152675, -0.01385234,  0.02599885]]),
  'A2': np.array([[ 0.5002307 ,  0.49985831,  0.50023963]]),
  'Z1': np.array([[-0.00616586,  0.0020626 ,  0.0034962 ],
         [-0.05229879,  0.02726335, -0.02646869],
         [-0.02009991,  0.00368692,  0.02884556],
         [ 0.02153007, -0.01385322,  0.02600471]]),
  'Z2': np.array([[ 0.00092281, -0.00056678,  0.00095853]])}
    return parameters, cache, X_assess, Y_assess

def update_parameters_test_case():
    parameters = {
     'W1': np.array([[-0.00615039,  0.0169021 ],
        [-0.02311792,  0.03137121],
        [-0.0169217 , -0.01752545],
        [ 0.00935436, -0.05018221]]),
 'W2': np.array([[-0.0104319 , -0.04019007,  0.01607211,  0.04440255]]),
 'b1': np.array([[ -8.97523455e-07],
        [  8.15562092e-06],
        [  6.04810633e-07],
        [ -2.54560700e-06]]),
 'b2': np.array([[  9.14954378e-05]])}

    grads = {
     'dW1': np.array([[ 0.00023322, -0.00205423],
        [ 0.00082222, -0.00700776],
        [-0.00031831,  0.0028636 ],
        [-0.00092857,  0.00809933]]),
 'dW2': np.array([[ -1.75740039e-05,   3.70231337e-03,  -1.25683095e-03,
          -2.55715317e-03]]),
 'db1': np.array([[  1.05570087e-07],
        [ -3.81814487e-06],
        [ -1.90155145e-07],
        [  5.46467802e-07]]),
 'db2': np.array([[ -1.08923140e-05]])}
    return parameters, grads

def nn_model_test_case():
    np.random.seed(1)
    X_assess = np.random.randn(2, 3)
    Y_assess = np.random.randn(1, 3)
    return X_assess, Y_assess

def predict_test_case():
    np.random.seed(1)
    X_assess = np.random.randn(2, 3)
    parameters = {
     'W1': np.array([[-0.00615039,  0.0169021 ],
        [-0.02311792,  0.03137121],
        [-0.0169217 , -0.01752545],
        [ 0.00935436, -0.05018221]]),
     'W2': np.array([[-0.0104319 , -0.04019007,  0.01607211,  0.04440255]]),
     'b1': np.array([[ -8.97523455e-07],
        [  8.15562092e-06],
        [  6.04810633e-07],
        [ -2.54560700e-06]]),
     'b2': np.array([[  9.14954378e-05]])}
    return parameters, X_assess
参考
https://blog.csdn.net/u013733326/article/details/79702148

