利用Pyhton提取宗地最高楼层
利用Pyhton提取宗地最高楼层
利用arcpy来处理数据,并用geopandas来出图,这次的目标是提取宗地内楼层的最高楼层数。
预处理
import geopandas as gpd
import arcpy
from arcpy import env
import pandas as pd
import matplotlib.pyplot as plt
import numpy as np
import matplotlib.patches as mpatches
from mpl_toolkits.basemap import Basemap
from matplotlib_scalebar.scalebar import ScaleBar
plt.rcParams['font.family'] = ['sans-serif']
plt.rcParams['font.sans-serif'] = ['SimHei']# 替换sans-serif字体为黑体
plt.rcParams['axes.unicode_minus'] = False   # 解决坐标轴负数的负号显示问题
path = r'F:\ArcGIS\ArcGIS文件\ModelBuilder\data\chp05'
env.workspace = path
par_path = path+'\宗地.shp'
floor_path = path + '\楼层数.shp'
arcpy处理
## 定义投影
## 都建议大家这么写,有异常捕捉

try:
    # set local variables
    in_dataset = par_path #"forest.shp"

    # get the coordinate system by describing a feature class
    dsc = arcpy.Describe(floor_path)
    coord_sys = dsc.spatialReference

    # run the tool
    arcpy.DefineProjection_management(in_dataset, coord_sys)

    # print messages when the tool runs successfully
    print(arcpy.GetMessages(0))

except arcpy.ExecuteError:
    print(arcpy.GetMessages(2))

except Exception as ex:
    print(ex.args[0])

path = r'F:\ArcGIS\ArcGIS文件\ModelBuilder\data\chp05'
par_path = path+'\宗地.shp'
floor_path = path + '\楼层数.shp'
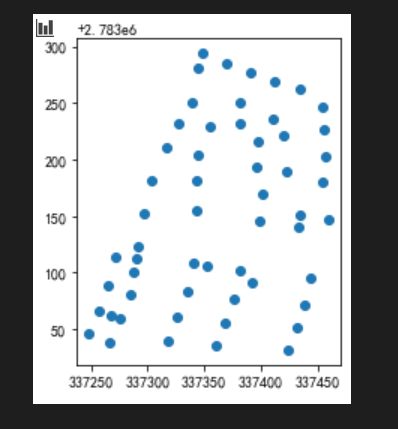
floor = gpd.GeoDataFrame.from_file(floor_path)
floor.plot()
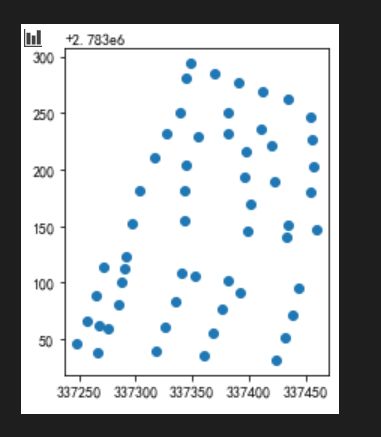
parcels = gpd.GeoDataFrame.from_file('F:\ArcGIS\ArcGIS文件\ModelBuilder\data\chp05\宗地.shp')
parcels.plot()
## 如何叠图,关键ax = ax
fig, ax = plt.subplots(figsize=(8, 8))
floor['coords'] = floor['geometry'].apply(lambda x: x.representative_point().coords[0])
for n, i in enumerate(floor['coords']):
    plt.text(i[0], i[1], floor['floor'][n], size=20)
parcels.plot(ax=ax,alpha=0.3, edgecolor='k',label='宗地')
floor.plot(ax=ax,label='大楼')

#plt.savefig('待处理.png',dpi=300)
## 就是开头的图片,这里就不演示了
数据处理和清洗
## arcpy获取字段

featureclass = par_path
field_names = [f.name for f in arcpy.ListFields(featureclass)]
field_names

## 删除文件,我做过一遍的
in_data = 'F:\ArcGIS\ArcGIS文件\ModelBuilder\data\chp05\楼层数_SpatialJoin.shp'
try:
    #arcpy.Delete_management (in_data)

    # print messages when the tool runs successfully
    print(arcpy.GetMessages(0))

except arcpy.ExecuteError:
    print(arcpy.GetMessages(2))

except Exception as ex:
    print(ex.args[0])

## 空间连接


try:

    # set local variables
    target_features = 'F:\ArcGIS\ArcGIS文件\ModelBuilder\data\chp05\楼层数.shp'
    join_features = 'F:\ArcGIS\ArcGIS文件\ModelBuilder\data\chp05\宗地.shp'
    out_feature_class = 'F:\ArcGIS\ArcGIS文件\ModelBuilder\data\chp05\楼层数_SpatialJoin.shp'
    field_mapping = ['floor','宗地号']


    # run the tool
    arcpy.SpatialJoin_analysis(target_features, join_features, out_feature_class,)

    # print messages when the tool runs successfully
    print(arcpy.GetMessages(0))

except arcpy.ExecuteError:
    print(arcpy.GetMessages(2))

except Exception as ex:
    print(ex.args[0])

## 删除字段

f_Spat = 'F:\ArcGIS\ArcGIS文件\ModelBuilder\data\chp05\楼层数_SpatialJoin.shp'
try:
    featureclass = 'F:\ArcGIS\ArcGIS文件\ModelBuilder\data\chp05\楼层数_SpatialJoin.shp'
    field_names = [f.name for f in arcpy.ListFields(featureclass)]
    field_names

    del_features = ['Text','街坊号','宗地预','Sum_占地','Sum_建筑','土地用','登记号','权利人',
                '宗地类','土地坐','面积','土地证','权属性','使用权','宗地四','宗地面']
    arcpy.DeleteField_management(f_Spat,del_features )
    # print messages when the tool runs successfully
    print(arcpy.GetMessages(0))

except arcpy.ExecuteError:
    print(arcpy.GetMessages(2))

except Exception as ex:
    print(ex.args[0])
## 数据最后不要相互干扰
f_num_path = 'F:\ArcGIS\ArcGIS文件\ModelBuilder\data\chp05\楼层数_SpatialJoin.shp'
f_num_path
f_num = gpd.GeoDataFrame.from_file(f_num_path)
f_num.plot()
f_num.head()
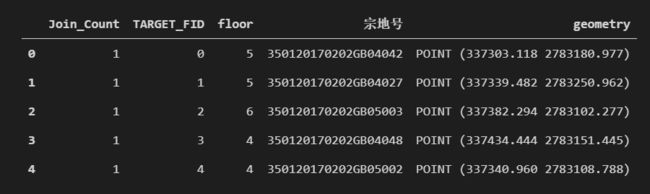
f_num.shape

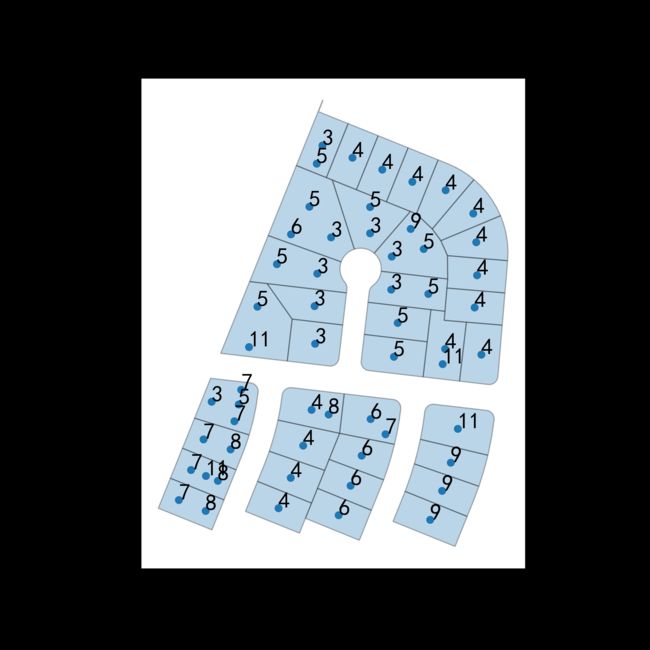
表面上没有什么变化,但是结果属性表多了宗地号,还有其他两个字段,接下来可视化一下。
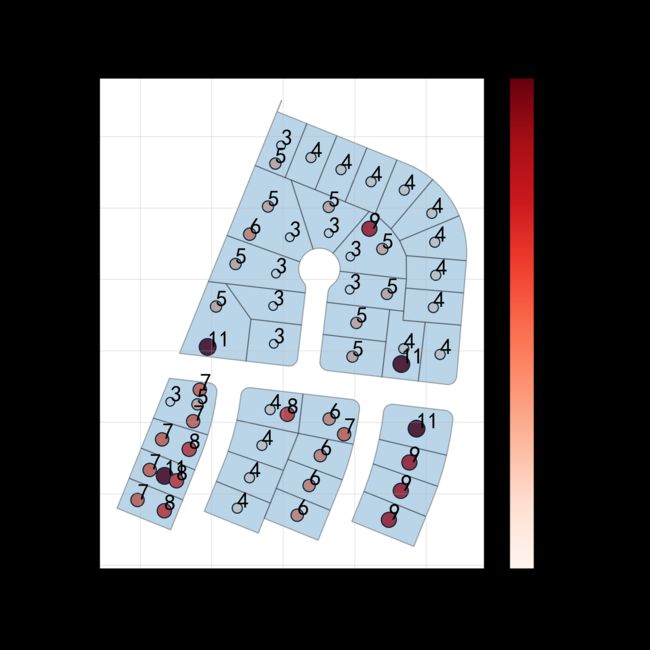
fig, ax = plt.subplots(figsize=(8, 8))
f_num['coords'] = f_num['geometry'].apply(lambda x: x.representative_point().coords[0])
ax = f_num.plot(ax=ax,column='floor', legend=True, s =f_num['floor']*20, cmap='Reds', edgecolor='k')
for n, i in enumerate(f_num['coords']):
    plt.text(i[0], i[1], f_num['floor'][n], size=20)
parcels.plot(ax = ax, alpha =0.3,edgecolor = 'k')
plt.title('宗地楼层分布图', size=25)
plt.grid(True, alpha=0.3)

plt.savefig('宗地楼层分布图.png',dpi=300)
数据透视和分组计算
## 其实我是想要分组计算的结果,就是大楼要有相对应的坐标
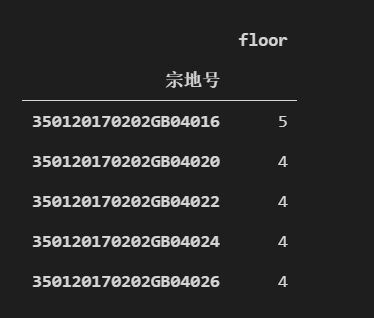
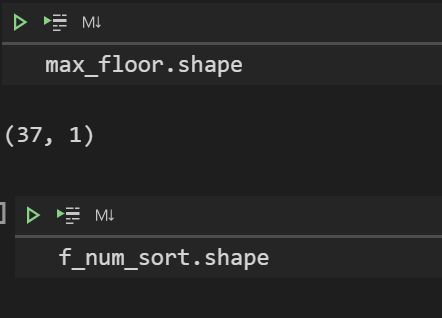
max_floor = pd.pivot_table(f_num,index=['宗地号',],values=['floor','geometry'],aggfunc=np.max)
max_floor.head()
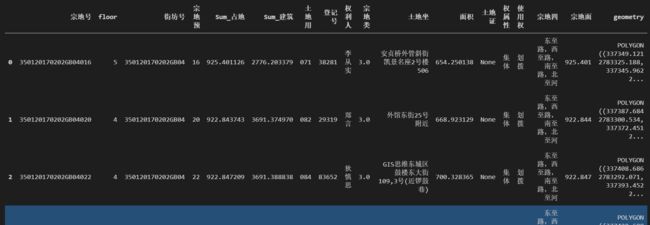
f_num_sort = f_num
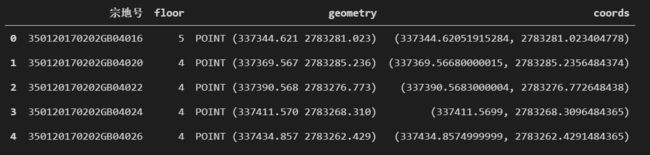
f_num_sort = f_num.sort_values('floor', ascending=False).groupby('宗地号', as_index=False).first()
f_num_sort = f_num_sort.drop(labels=['Join_Count','TARGET_FID'],axis=1) # axis=1 表示按列删除,删除gender、age列
f_num_sort.head()
其实我是想要分组计算的结果,就是大楼要有相对应的坐标,有谁知道数据透视怎么得到这个分组计算的结果,不吝赐教。
数据连接
result = pd.merge(max_floor,parcels,on='宗地号')
result.head()
## 删除不需要的字段
result = result[['宗地号','floor','geometry']]
result = gpd.GeoDataFrame(result) ## 保证数据是GeoDataFrame格式
result.head()

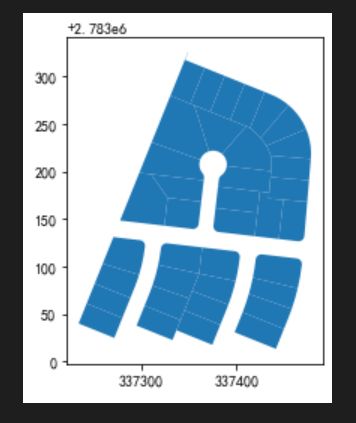
出图
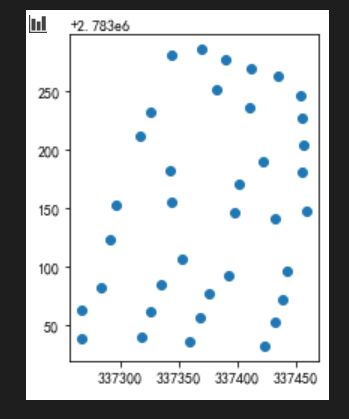
f_num_sort = gpd.GeoDataFrame(f_num_sort)
f_num_sort.plot()
## 推荐写法,变成一个实例来写
fig, ax = plt.subplots(figsize=(8,8))
result['coords'] = result['geometry'].apply(lambda x: x.representative_point().coords[0])
ax = result.plot(ax=ax,column='floor',cmap='Reds',edgecolor='k',legend=True)
for n, i in enumerate(result['coords']):
    ax.text(i[0],i[1], result['floor'][n],size=20)
f_num_sort.plot(ax=ax,alpha=0.8)
ax.set_title('宗地最高楼层分布图',size=25)
ax.grid(True,alpha=0.3)

plt.savefig('效果图.png',dpi=300)

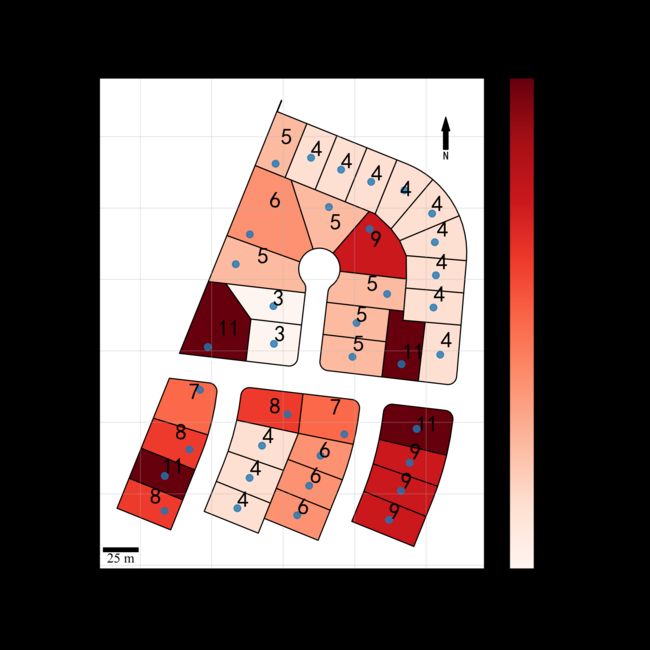
## 制作标准地图
fig, ax = plt.subplots(figsize=(8,8))
result['coords'] = result['geometry'].apply(lambda x: x.representative_point().coords[0])
ax = result.plot(ax=ax,column='floor',cmap='Reds',edgecolor='k',legend=True)
for n, i in enumerate(result['coords']):
    ax.text(i[0],i[1], result['floor'][n],size=20)
f_num_sort.plot(ax=ax,alpha=0.8)
ax.set_title('宗地最高楼层分布图',size=25)
ax.grid(True,alpha=0.3)


# 添加比例尺
scalebar = ScaleBar(dx=1*10**-3,units='km',length_fraction=0.1,
                    font_properties={
     'family': 'Times New Roman', 'weight': 'normal', 'size': 12},
                    location=3,sep=0.5,frameon=False) ## location参数选择放的位置
ax.add_artist(scalebar)

# 添加指北针
x, y, arrow_length = 0.9, 0.92, 0.07
ax.annotate('N', xy=(x, y), xytext=(x, y-arrow_length),
            arrowprops=dict(facecolor='black', width=4, headwidth=7),
            ha='center', va='top', fontsize=10,
            xycoords=ax.transAxes)

plt.savefig('宗地最高楼层分布图.png',dpi=300)
总结
arcpy是处理地理数据的好帮手,而geopandas和matplotlib有这强大的数据可视化能力,两者结合起来,可以创造很多的可能性,数据一定要正确,投影和拓扑都要正确。还有就是异常捕捉,这个必不可少,我们代码写多了,一点要异常捕捉,多输出看看。欢迎大家转发和关注。