吴恩达机器学习作业系列Python实现(一)之单变量线性回归
一、任务
在本节练习中,你将实现一个单变量的线性回归,以此来预测食品卡车公司的利润。
题目:
假设你是一家食品公司的CEO,正在考虑在不同的城市开设一个新的分店;
现提供该公司在各城市开通食品开车所获得的利润以及该城市相应的人口密度;
现在你要训练出一个模型,去帮助公司判断是否要在某一个新的城市开通食品卡车。
数据说明:
第一列数据:城市人口密度
第二列数据:该城市所得利润
实现要求:
(1)自编程实现线性回归模型;
(2)调用sklearn库中的linear_model进行预测;(sklearn.linear_model.LinearRegression())
二、实现
import numpy as np
import pandas as pd
import matplotlib.pyplot as plt
from sklearn.linear_model import LinearRegression

data = pd.read_table('./input/ex1data1.txt', sep=',', names=['Population', 'Profits'])


def compute_loss(theta, X, y):
    temp = np.power(np.dot(X, theta.T)-y, 2)
    return np.sum(temp / (2 * len(X)))


def gradient_descent(X, y, theta, alpha, epoch):
    cost = []
    for i in range(epoch):
        theta = theta - (alpha/len(X)) * np.dot((np.dot(X, theta.T)-y).T, X)
        loss = compute_loss(theta, X, y)
        cost.append(loss)

    return theta, cost


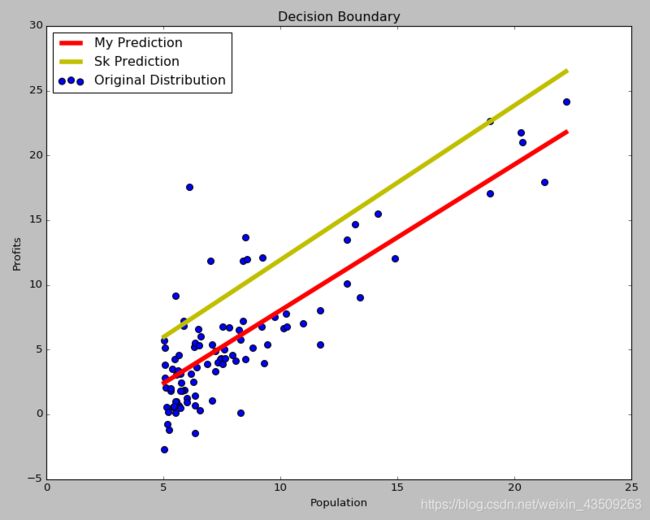
def decision_boundary(X, y, theta, sk_theta):
    plt.figure(figsize=(10, 8))
    plt.scatter(X.T[1], y, s=50, label='Original Distribution')
    plt.title('Decision Boundary')
    plt.xlabel('Population')
    plt.ylabel('Profits')
    x = np.linspace(X.T[1].min(), X.T[1].max(), 100)
    y_pred = theta[0][0] + theta[0][1]*x
    sk_pred = sk_theta[0][0] + sk_theta[0][1]*x
    plt.plot(x, y_pred, c='r', label='My Prediction', linewidth=5.0)
    plt.plot(x, sk_pred, c='y', label='Sk Prediction', linewidth=5.0)
    plt.legend(loc='upper left')
    plt.show()


def loss_curve(costs):
    plt.figure(figsize=(10, 8))
    plt.plot(range(len(costs)), costs, c='r', linewidth=5)
    plt.xlabel('iteration')
    plt.ylabel('loss')
    plt.title('Loss vs Iteration')
    plt.show()


def main():
    X = np.array(data)[:, :-1]
    y = np.array(data)[:, -1].reshape((len(X), 1))
    print('X.shape: ', X.shape)
    print('y.shape:', y.shape)

    X = np.insert(X, 0, values=np.ones([len(X), 1]).T, axis=1)
    print('X_new.shape: ', X.shape)
    theta = np.array([0, 0]).reshape((1, 2))
    # print(theta.shape)
    print('loss before iteration: ', compute_loss(theta, X, y))

    final_theta, costs = gradient_descent(X, y, theta, alpha=0.01, epoch=1000)
    print('final_theta: ', final_theta)
    print('final_theta.shape: ', final_theta.shape)
    print('loss after iteration: ', compute_loss(final_theta, X, y))

    # Use the sklearn module
    reg = LinearRegression().fit(X, y)
    print('sk_theta: ', reg.coef_)

    decision_boundary(X, y, final_theta, reg.coef_)
    loss_curve(costs)


if __name__ == '__main__':
    main()
输出如下:
X.shape:  (97, 1)
y.shape: (97, 1)
X_new.shape:  (97, 2)
loss before iteration:  32.0727338775
final_theta:  [[-3.24140214  1.1272942 ]]
final_theta.shape:  (1, 2)
loss after iteration:  4.51595550308
sk_theta:  [[ 0.          1.19303364]]

Process finished with exit code 0

