OpenCV-Python——第18.2章:图像直方图均衡化
目录
0 原理 1 OpenCV 中的直方图均衡化 2 CLAHE 有限对比适应性直方图均衡化
0 原理
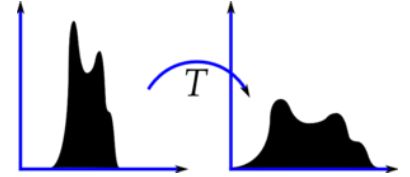
想象一下如果一副图像中的大多是像素点的像素值都集中在一个像素值范围之内会怎样呢?例如,如果一幅图片整体很亮,那所有的像素值应该都会很 高。但是一副高质量的图像的像素值分布应该很广泛。所以你应该把它的直方 图做一个横向拉伸(如下图),这就是直方图均衡化要做的事情。通常情况下这 种操作会改善图像的对比度
使用Numpy的计算过程如下,找到直方图中的最小值(除了 0),并把它用于 wiki 中的直方图均衡化公式。但是我在这里使用了 Numpy 的掩模数组。对于掩模数组的所 有操作都只对 non-masked 元素有效。你可以到 Numpy 文档中获取更多掩 模数组的信息。
img = cv2.imread('test22.jpg', 0)
cdf_m = np.ma.masked_equal(cdf, 0)
cdf_m = (cdf_m - cdf_m.min())*255/(cdf_m.max()-cdf_m.min())
# 对被掩盖的元素赋值,这里赋值为 0
cdf = np.ma.filled(cdf_m, 0).astype('uint8')
img2 = cdf[img]
hist2, bins = np.histogram(img2.flatten(), 256, [0, 256])
cdf2 = hist2.cumsum()
cdf_m = cdf2 * hist2.max() / cdf2.max()
1 OpenCV 中的直方图均衡化
OpenCV 中的直方图均衡化函数为 cv2.equalizeHist(),是对上面方法的封装。这个函数的输入图片仅仅是一副灰度图像,输出结果是直方图均衡化之后的图像。
cv2.equalizeHist(src, dst)
- src:输入灰度图像
- dst:输出直方图均衡化后的图像
举个例子:
import cv2
import numpy as np
from matplotlib import pyplot as plt

img = cv2.imread('test22.jpg', 0)
# flatten() 将数组变成一维
hist, bins = np.histogram(img.flatten(), 256, [0, 256])
# 计算累积分布图
cdf = hist.cumsum()
cdf_normalized = cdf * hist.max() / cdf.max()

plt.subplot(321), plt.imshow(img, 'gray'), plt.axis('off')
plt.title('Original')

plt.subplot(322), plt.plot(cdf_normalized, color='b'),
plt.hist(img.flatten(), 256, [0, 256], color='r'),
plt.xlim([0, 256]),
plt.legend(('cdf', 'histogram'), loc='upper left'), plt.title('Histogram')

# 使用Numpy实现直方图均衡化
cdf_m = np.ma.masked_equal(cdf, 0)
cdf_m = (cdf_m - cdf_m.min())*255/(cdf_m.max()-cdf_m.min())
# 对被掩盖的元素赋值,这里赋值为 0
cdf = np.ma.filled(cdf_m, 0).astype('uint8')
img2 = cdf[img]
hist2, bins = np.histogram(img2.flatten(), 256, [0, 256])
cdf2 = hist2.cumsum()
cdf_m = cdf2 * hist2.max() / cdf2.max()

plt.subplot(323), plt.imshow(img2, 'gray'), plt.axis('off')
plt.title('Numpy Equalized')

plt.subplot(324), plt.plot(cdf_m, color='b'),
plt.hist(img2.flatten(), 256, [0, 256], color='r'),
plt.xlim([0, 256]),
plt.legend(('cdf', 'histogram'), loc='upper left'), plt.title('Histogram')

# 使用OpenCV函数实现直方图均衡化
img3 = cv2.equalizeHist(img)
hist3, bins = np.histogram(img2.flatten(), 256, [0, 256])
cdf3 = hist3.cumsum()
cdf_m = cdf3 * hist3.max() / cdf3.max()

plt.subplot(325), plt.imshow(img3, 'gray'), plt.axis('off')
plt.title('OpenCV Equalized')

plt.subplot(326), plt.plot(cdf_m, color='b'),
plt.hist(img3.flatten(), 256, [0, 256], color='r'),
plt.xlim([0, 256]),
plt.legend(('cdf', 'histogram'), loc='upper left'), plt.title('Histogram')

plt.show()
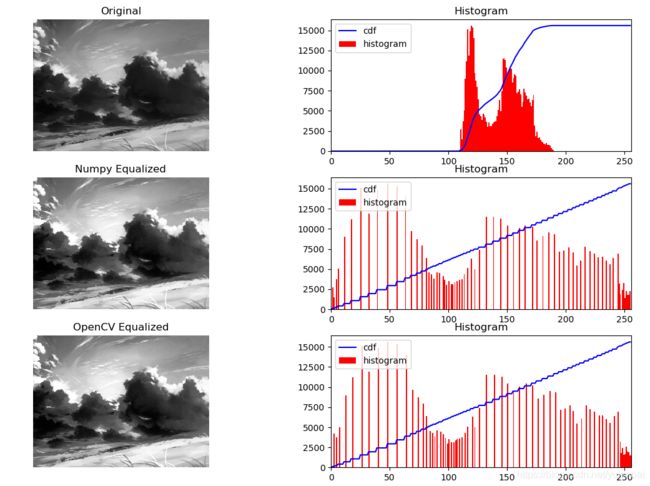
结果如下:
可以看出来第一张图直方图大部分在灰度值较高的部分,而且分布很集中。而我们希望直方图的分布比较分散,能够涵盖整个 x 轴。所以,就需要一个变换函数帮助我们把现在的直方图映射到一个广泛分布的直方图中。这就是直方图均衡化要做的事情。
而且可以看出使用Numpy得到的结果和使用OpenCV自身函数得到的结果是相同的。
2 CLAHE 有限对比适应性直方图均衡化
CLAHE是Contrast-Limited Adaptive Histogram Equalization(对比限制适应性直方图均衡化)的缩写。
上边做的直方图均衡化会改变整个图像的对比度,但是在很多情况下,这样做的效果并不好。
为了解决这个问题,我们需要使用自适应的直方图均衡化。这种情况下, 整幅图像会被分成很多小块,这些小块被称为 “tiles”(在 OpenCV 中 tiles 的大小默认是 8x8),然后再对每一个小块分别进行直方图均衡化(跟前面类似)。 所以在每一个的区域中,直方图会集中在某一个小的区域中(除非有噪声干扰)。如果有噪声的话,噪声会被放大。为了避免这种情况的出现要使用对比度限制。对于每个小块来说,如果直方图中的 bin 超过对比度的上限的话,就把其中的像素点均匀分散到其他 bins 中,然后在进行直方图均衡化。最后,为了去除每一个小块之间“人造的”(由于算法造成)边界,再使用双线性差值,对小块进行缝合。
OpenCV 中的 CLAHE函数
cv2.createCLAHE(clipLimit, tileGridSize)
- clipLimit:对比度限制的阈值
- tileGridSize:图像分割每块的尺寸,默认8x8
使用方法:
clahe = cv2.createCLAHE(clipLimit=2.0, tileGridSize=(8,8))
dst = clahe.apply(img)
表示创建了一个将图像分为8x8的小块并设置对比度限制为2.0的方法clahe,再将其应用于img,输出dst。
举个例子来说明他的优越性:
import cv2
import numpy as np
from matplotlib import pyplot as plt

img = cv2.imread('test22_1.jpg', 0)
hist, bins = np.histogram(img.flatten(), 256, [0, 256])
cdf = hist.cumsum()
cdf_normalized = cdf * hist.max() / cdf.max()

plt.subplot(321), plt.imshow(img, 'gray'), plt.axis('off')
plt.title('Original')

plt.subplot(322), plt.plot(cdf_normalized, color='b'),
plt.hist(img.flatten(), 256, [0, 256], color='r'),
plt.xlim([0, 256]),
plt.legend(('cdf', 'histogram'), loc='upper left'),
plt.title('Histogram')

# 全局直方图均衡化
img2 = cv2.equalizeHist(img)
hist2, bins = np.histogram(img2.flatten(), 256, [0, 256])
cdf2 = hist2.cumsum()
cdf_m = cdf2 * hist2.max() / cdf2.max()

plt.subplot(323), plt.imshow(img2, 'gray'), plt.axis('off')
plt.title('Histogram Equalization')

plt.subplot(324), plt.plot(cdf_m, color='b'),
plt.hist(img2.flatten(), 256, [0, 256], color='r'),
plt.xlim([0, 256]),
plt.legend(('cdf', 'histogram'), loc='upper left'),
plt.title('Histogram')

# 有限对比适应性直方图均衡化CLAHE(Contrast Limited Adaptive Histogram Equalization)
clahe = cv2.createCLAHE(clipLimit=2.0, tileGridSize=(8, 8))
img3 = clahe.apply(img)
hist3, bins = np.histogram(img3.flatten(), 256, [0, 256])
cdf3 = hist3.cumsum()
cdf_m = cdf3 * hist3.max() / cdf3.max()

plt.subplot(325), plt.imshow(img3, 'gray'), plt.axis('off')
plt.title('CLAHE')

plt.subplot(326), plt.plot(cdf_m, color='b'),
plt.hist(img3.flatten(), 256, [0, 256], color='r'),
plt.xlim([0, 256]),
plt.legend(('cdf', 'histogram'), loc='upper left'),
plt.title('Histogram')

plt.show()
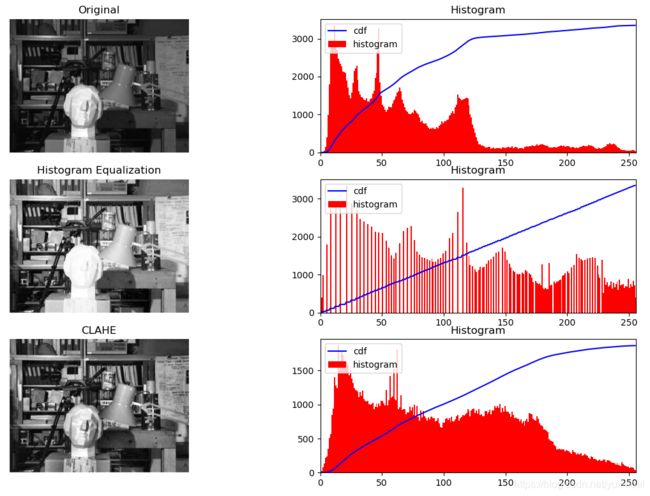
结果如下:
对比一下下面两幅图像中雕像的面图,全局均衡化由于太亮所以丢失了很多信息。造成这种结果的根本原因在于这幅图像的直方图并不是集中在某一个区域。而使用CLAHE的图片中雕塑的细节得到了保留。


