matlab学习笔记(四)初阶绘图
初阶绘图
- 基础绘图
-
- plot()
- 绘图风格设置
- legend()
- title() 和 label()
- text() 和 annotation()
- 图形的一些属性(Figure Property)
-
- 修改属性:
- 多个图窗(分开展示)
- 设置图窗位置和大小
- 设置多图窗显示(显示在同一图窗上)
参考课程:台大郭彦甫教授MATLAB课程
基础绘图
从数据中绘图
plot()
- plot(x,y):指定自变量x的值
- plot(y):自变量x默认从0,1,2,…开始
plot(cos(0:pi/20:2*pi));
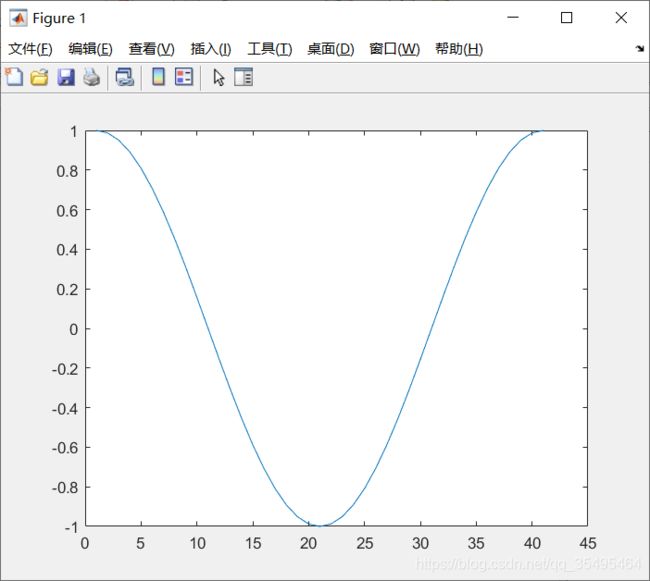
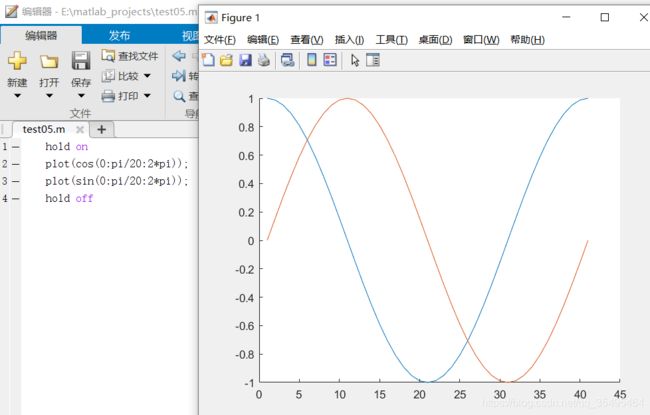
如果想在一张图上画出多个图像,可以使用hold on–hold off语句实现,否则后面的语句会覆盖掉之前的:
如:
hold on
plot(cos(0:pi/20:2*pi));
plot(sin(0:pi/20:2*pi));
hold off
绘图风格设置
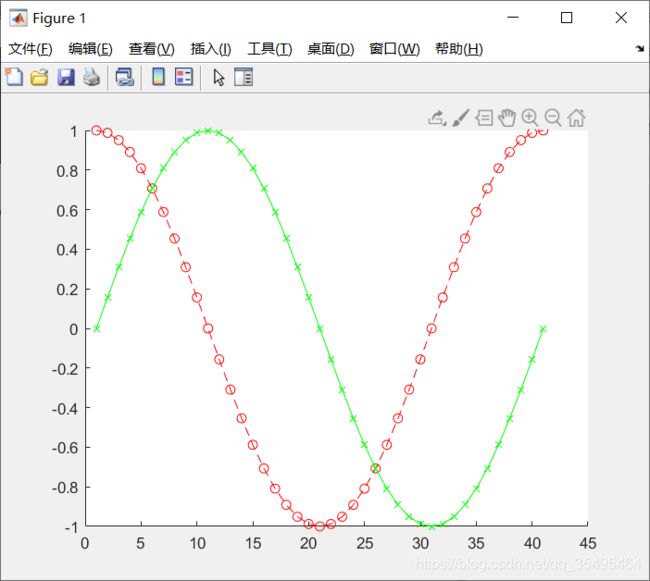
- plot(x,y,‘str’):设置线型(Line types)、标记(Data markers)、颜色(Colors)等风格


如,’- -or’表示:虚线线型(–)、圆圈标记(o)、红色(r)
hold on
plot(cos(0:pi/20:2*pi),'--or');
plot(sin(0:pi/20:2*pi),'-xg');
hold off
legend()
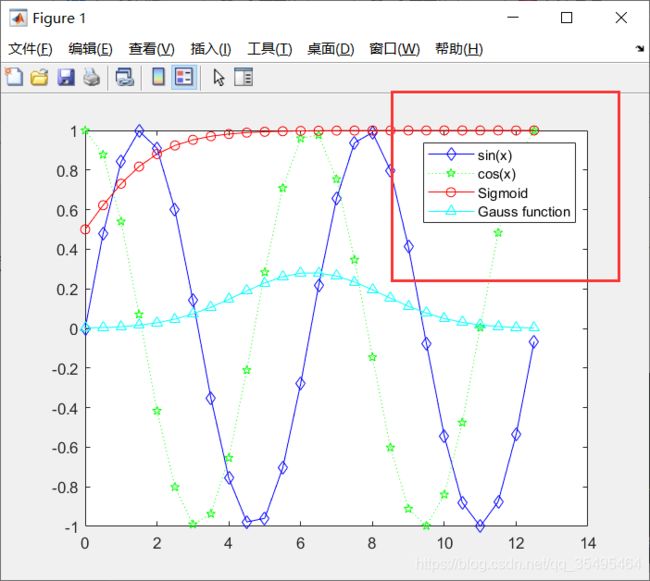
如果我们要显示四个函数的图像:sin、cos、Sigmoid、Gauss
x = 0:0.5:4*pi;
y = sin(x);
h = cos(x);
w = 1./(1 + exp(-x)); % Sigmoid
g = (1 /(2 * pi * 2)^0.5) .* exp((-1 .* (x - 2 * pi) .^ 2) ./ (2 * 2 ^ 2)); % 高斯
plot(x,y,'bd-',x,h,'gp:',x,w,'ro-',x,g,'c^-');
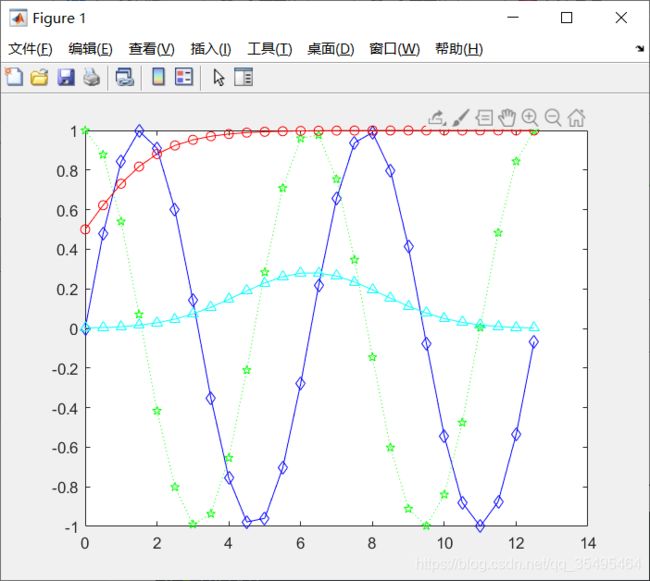
legend()的作用是在图像上显示出图例,便于观察每一个图像对应代表哪个函数:
- legend(‘sin(x)’,‘cos(x)’,‘Sigmoid’,‘Gauss function’);
x = 0:0.5:4*pi;
y = sin(x);
h = cos(x);
w = 1./(1 + exp(-x)); % Sigmoid
g = (1 /(2 * pi * 2)^0.5) .* exp((-1 .* (x - 2 * pi) .^ 2) ./ (2 * 2 ^ 2)); % 高斯
plot(x,y,'bd-',x,h,'gp:',x,w,'ro-',x,g,'c^-');
legend('sin(x)','cos(x)','Sigmoid','Gauss function'); % 按顺序对应图形
title() 和 label()
- title()
- xlabel()
- ylabel()
- zlabel()(三维时用到)
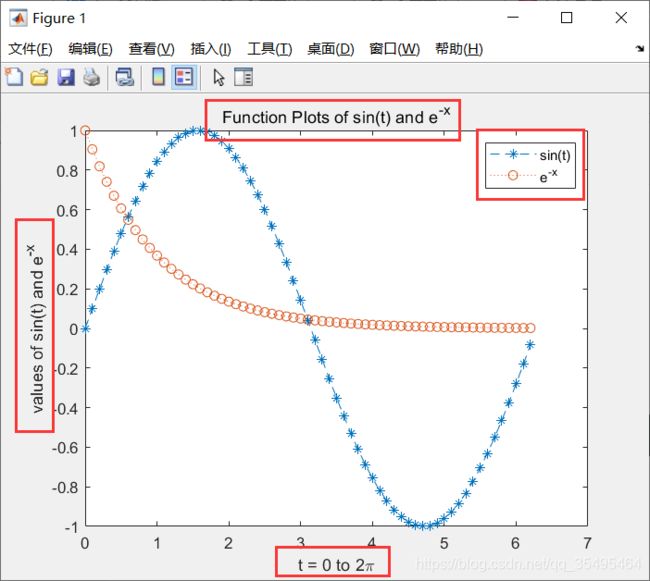
x = 0:0.1:2*pi;
y1 = sin(x);
y2 = exp(-x);
plot(x,y1,'--*',x,y2,':o');
xlabel('t = 0 to 2\pi'); % 很像markdown语法
ylabel('values of sin(t) and e^{-x}');
title('Function Plots of sin(t) and e^{-x}');
legend('sin(t)','e^{-x}');
text() 和 annotation()
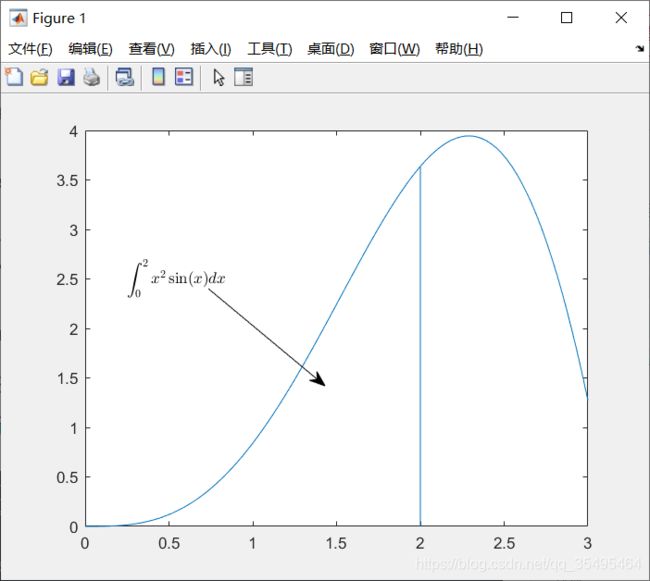
用于在Figure上指定位置写LaTex数学表达式
1.text(x , y , str , ‘Interpreter’ , ‘latex’):
- x、y坐标用于规定从哪个位置开始写
- str:要写的内容
2.annotation(‘图形’ , ‘X’ , [坐标变化] , ‘Y’ , [坐标变化]):
- 图形:包括箭头等图形
- X、Y坐标的变化:如,箭头的起始点和终点
x = linspace(0,3);
y = x .^ 2 .* sin(x);
plot(x,y);
line([2,2],[0,2^2*sin(2)]);
str = '$$ \int_{0}^{2} x^2\sin(x) dx $$';
text(0.25,2.5,str,'Interpreter','latex');
annotation('arrow','X',[0.32,0.5],'Y',[0.6,0.4]);
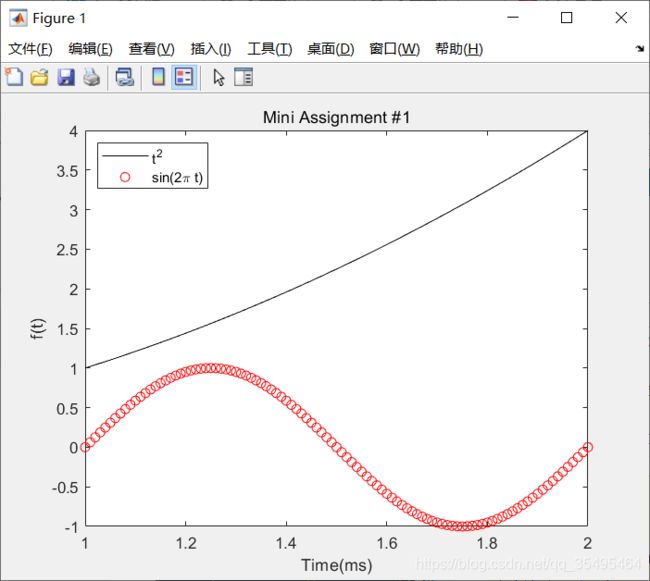
t = 1:0.01:2;
f = t .^ 2;
g = sin(2 .* pi .* t);
plot(t,f,'-k',t,g,'or');
xticks([1:0.2:2]);
xlabel('Time(ms)');
ylabel('f(t)');
title('Mini Assignment #1');
legend({
     't^2','sin(2\pi t)'},'Location','northwest'); % 图例在西北方向的位置
图形的一些属性(Figure Property)
修改属性:
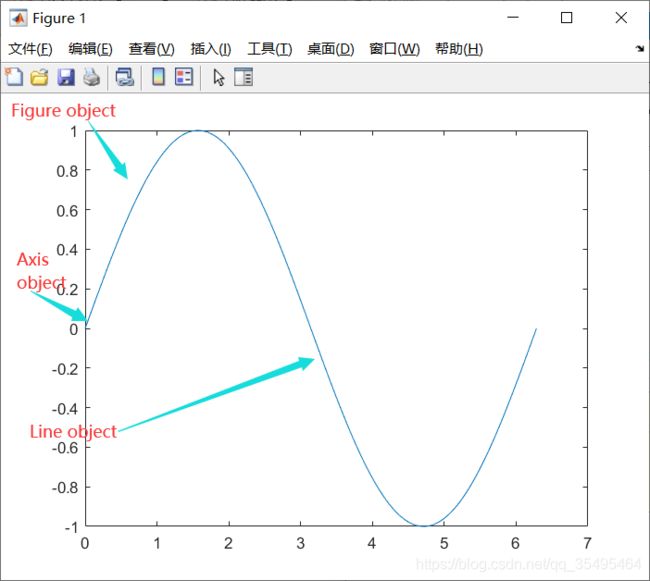
1.Identifying the Handle of An Object
- 通过handle修改对应属性
- 取出 / 修改属性
Utility functions:
| 函数 | 说明 |
|---|---|
| gca | 返回当前的坐标区,可以通过点成员运算符设置下属的属性 |
| gcf | 返回当前图窗的句柄,可以通过点成员运算符设置下属的属性 |
| allchild | 查找指定对象的所有子级 |
| ancestor | 查找指定对象的所有祖先 |
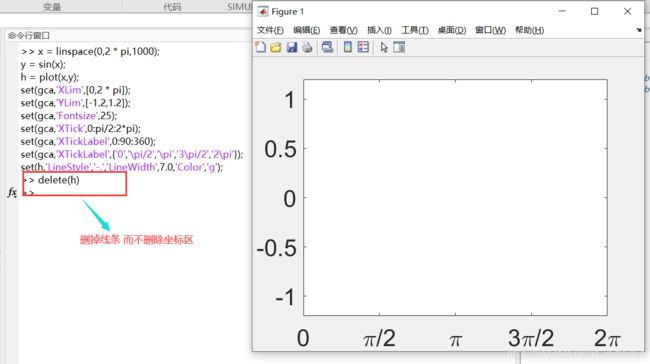
| delete | 删除一个对象 |
| findall | 查找所有图形对象 |
2.Fetching or Modifying Properties
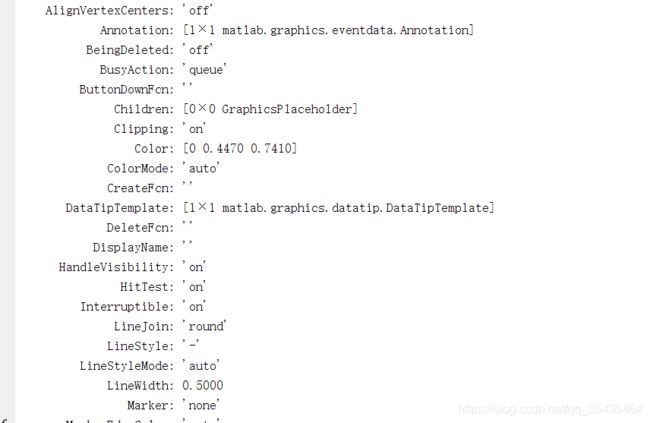
(1)get():获取图形的相关属性
x = linspace(0,2 * pi,1000);
y = sin(x);
plot(x,y);
h = plot(x,y);
get(h);
x = linspace(0,2 * pi,1000);
y = sin(x);
plot(x,y);
get(gca);
(2)set():设置图形的相关属性
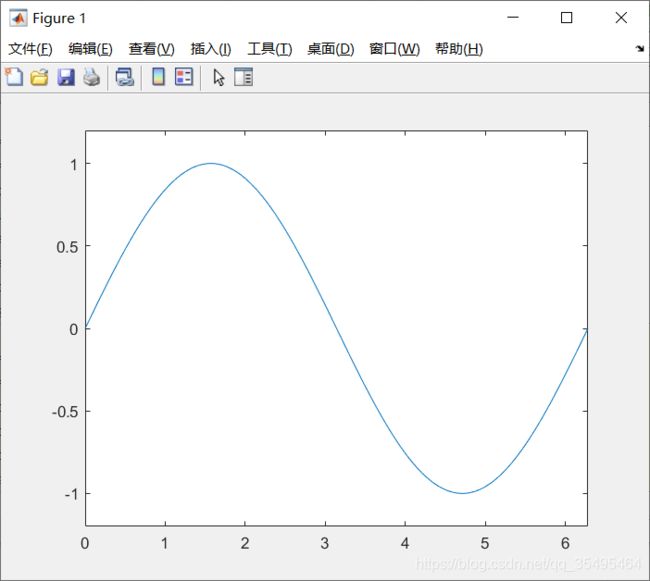
- 设置XLim 和 YLim的limit(坐标的上下界设置)
x = linspace(0,2 * pi,1000);
y = sin(x);
plot(x,y);
set(gca,'XLim',[0,2 * pi]);
set(gca,'YLim',[-1.2,1.2])
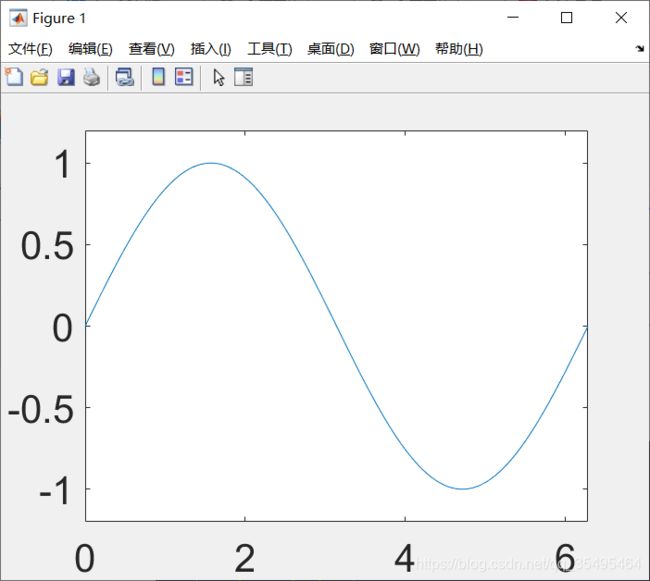
- 设置字体大小以及坐标刻度值
x = linspace(0,2 * pi,1000);
y = sin(x);
plot(x,y);
set(gca,'XLim',[0,2 * pi]);
set(gca,'YLim',[-1.2,1.2])
set(gca,'Fontsize',25);
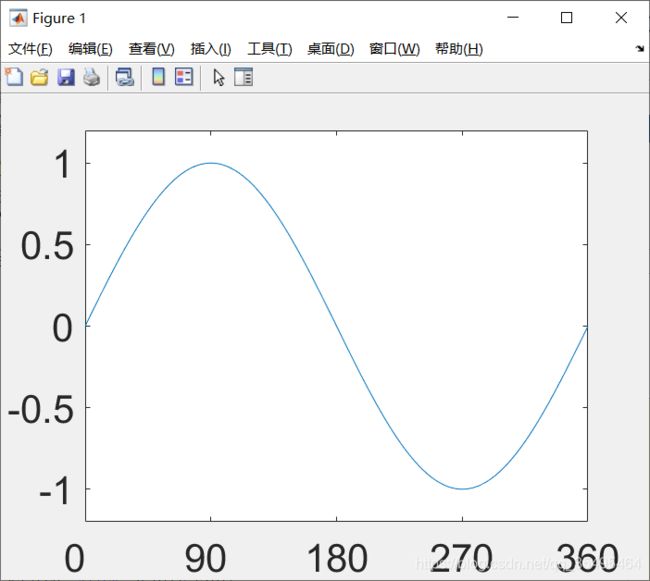
x = linspace(0,2 * pi,1000);
y = sin(x);
plot(x,y);
set(gca,'XLim',[0,2 * pi]);
set(gca,'YLim',[-1.2,1.2])
set(gca,'Fontsize',25);
set(gca,'XTick',0:pi/2:2*pi);
set(gca,'XTickLabel',0:90:360);
- 把 π \pi π显示出来,而不再用180、360度来代替:
【注】要用花括号 { } 括起来
x = linspace(0,2 * pi,1000);
y = sin(x);
plot(x,y);
set(gca,'XLim',[0,2 * pi]);
set(gca,'YLim',[-1.2,1.2]);
set(gca,'Fontsize',25);
set(gca,'XTick',0:pi/2:2*pi);
set(gca,'XTickLabel',0:90:360);
set(gca,'XTickLabel',{
     '0','\pi/2','\pi','3\pi/2','2\pi'});
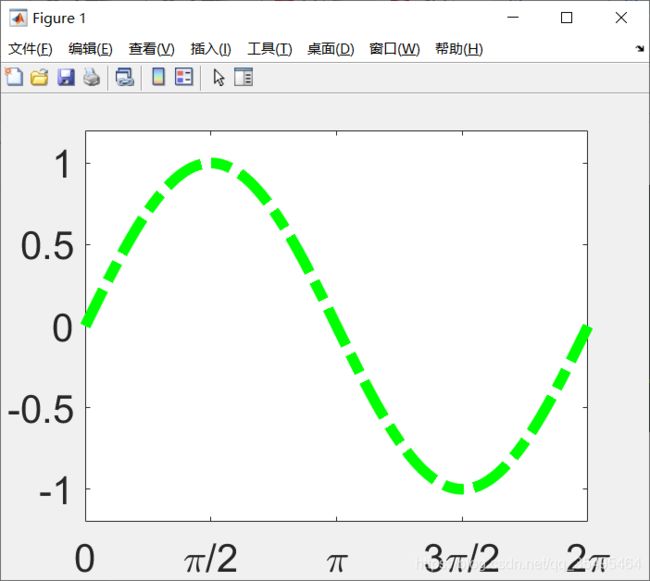
- 设置线条样式
x = linspace(0,2 * pi,1000);
y = sin(x);
h = plot(x,y);
set(gca,'XLim',[0,2 * pi]);
set(gca,'YLim',[-1.2,1.2]);
set(gca,'Fontsize',25);
set(gca,'XTick',0:pi/2:2*pi);
set(gca,'XTickLabel',0:90:360);
set(gca,'XTickLabel',{
     '0','\pi/2','\pi','3\pi/2','2\pi'});
set(h,'LineStyle','-.','LineWidth',7.0,'Color','g');
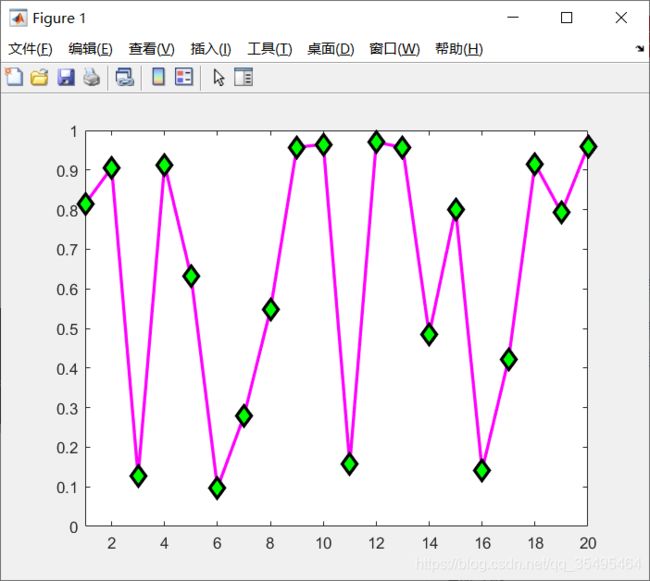
- 设置标签属性
x = rand(20,1);
set(gca,'FontSize',18);
plot(x,'-md','LineWidth',2,'MarkerEdgeColor','k','MarkerFaceColor','g','MarkerSize',10);
xlim([1,20]);
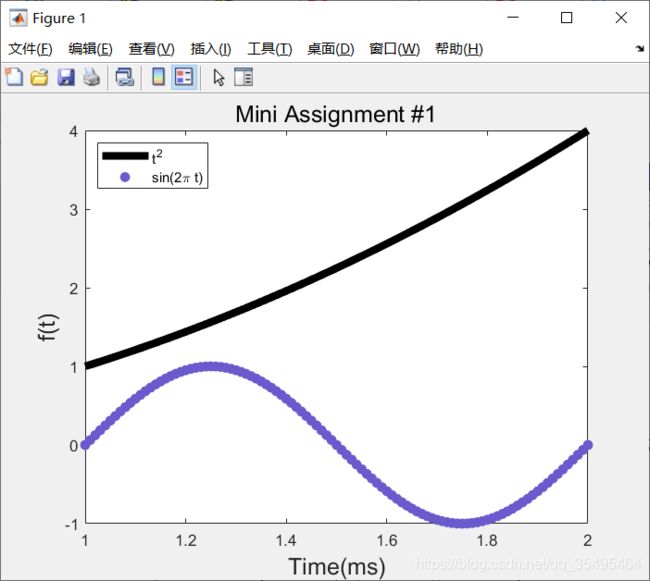
【练习2】将上面画出的那个 t 2 t^2 t2 和 s i n ( 2 π t ) sin(2\pi t) sin(2πt)的图形重新设置一下样式:
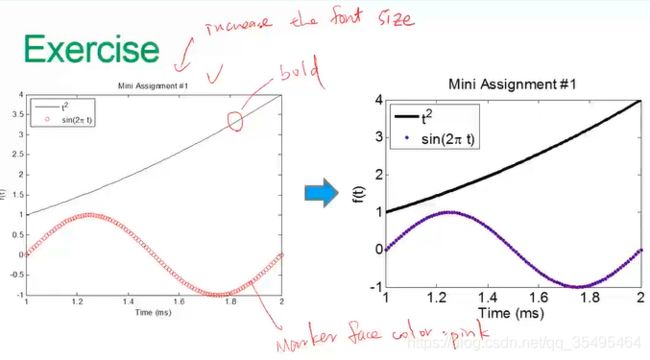
t = 1:0.01:2;
f = t .^ 2;
g = sin(2 .* pi .* t);
h = plot(t,f,'-',t,g,'o','MarkerEdgeColor',[106/255 90/255 205/255],'MarkerFaceColor',[106/255 90/255 205/255]);
set(gca,'FontSize',10);
xticks([1:0.2:2]);
yticks([-1:1:4]);
xlabel('\fontsize{15}Time(ms)');
ylabel('\fontsize{15}f(t)');
title('\fontsize{15}Mini Assignment #1');
set(h(1),'LineStyle','-','LineWidth',5.0,'Color','k');
legend({
     't^2','sin(2\pi t)'},'Location','northwest');
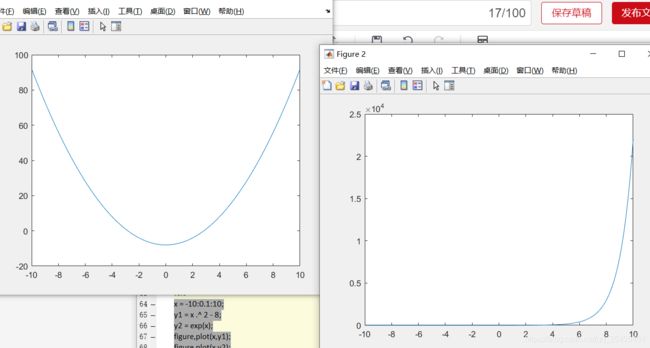
多个图窗(分开展示)
x = -10:0.1:10;
y1 = x .^ 2 - 8;
y2 = exp(x);
figure,plot(x,y1);
figure,plot(x,y2);
设置图窗位置和大小
- figure(‘position’,[left , bottom , width , height]);
设置多图窗显示(显示在同一图窗上)
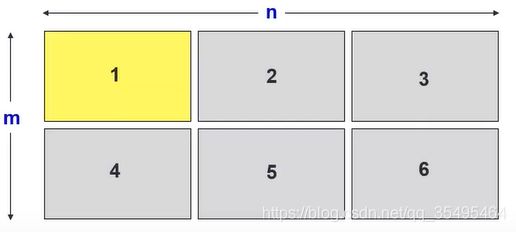
- subplot(m,n,1);
- m:行数
- n:列数
- 1:放在哪个位置,如,第一个位置
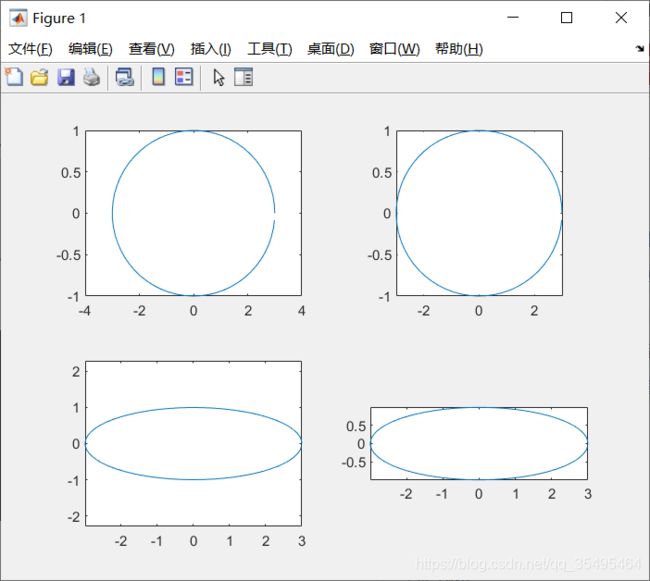
t = 0:0.1:2*pi;
x = 3 * cos(t);
y = sin(t);
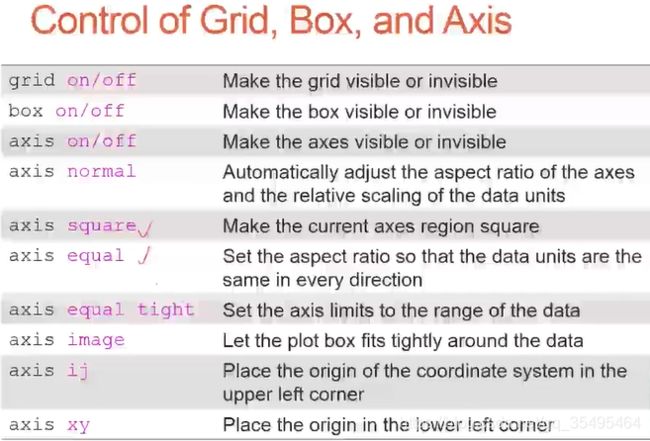
subplot(2,2,1);plot(x,y);axis normal
subplot(2,2,2);plot(x,y);axis square
subplot(2,2,3);plot(x,y);axis equal
subplot(2,2,4);plot(x,y);axis equal tight
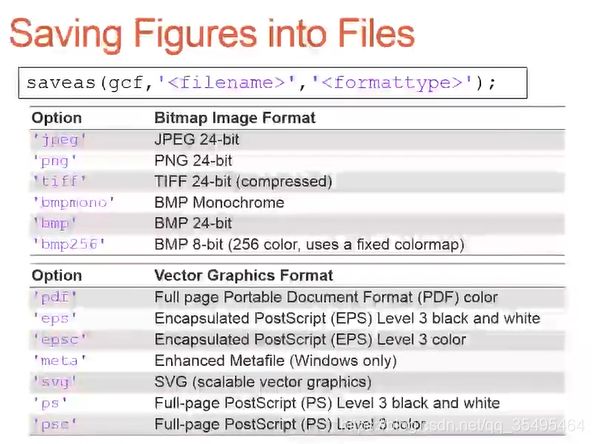
比如,保存【练习2】的那个图窗,命名为’test001’,格式为’jpeg’:
saveas(gcf,'test001','jpeg');
