echarts-for-react——react项目中使用echarts
最近有在做的项目需要在react中使用echarts。
安装
npm install --save echarts-for-react
npm install --save echarts
然后导入echarts.js模块
引入全部的
import ReactEcharts from "echarts-for-react";
减少包的大小也可以按需引入
import echarts from 'echarts/lib/echarts';
import 'echarts/lib/chart/line';
import 'echarts/lib/chart/bar';
设置option函数
getOption=(record)=> {
    return {
      title: {
        text: ''
    },
    tooltip: {},
      xAxis: {
        // axisLabel: {
        //   interval:0,
        // },//强制显示x轴所有的信息
        type: 'category',
        data: orderNumTime//x轴信息,数组
    },
    yAxis: {},
      series: [
        {
          type: 'bar',
          data: orderNum //y轴信息,数组
        },
        {
          type: 'bar',
          data: payOrderNum//y轴信息,数组
        }
      ]
   };
  }
使用
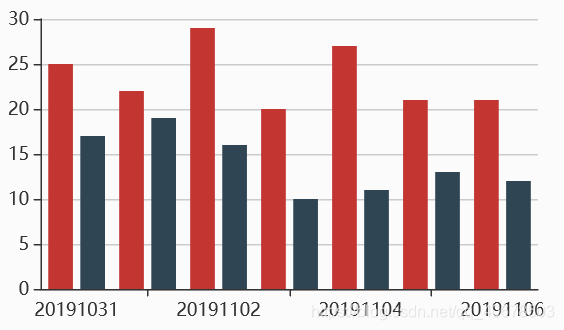
这样一个简单的柱状图就ok啦
关于组件的参数简介
option (required, object)
这个是必须有的,echarts图表的配置包括渲染的数据都在其中。标题title、图例legend、提示框tooltip、x轴xAxis、y轴yAxis、series等,更多内容可以参考 echarts详细内容
notMerge (optional, object)
跟之前设置的 option是否 进行合并,默认为 false合并。
lazyUpdate (optional, object)
是否立即更新图表,默认为 false立即更新。
style (optional, object)
包含echarts图表的div的样式,默认是{height: ‘300px’}.
className (optional, string)
包含echarts图表的div的类名. 可以根据需要自行配置类名,不同类配置不同的css。
loadingOption (optional, object)

showLoading (optional, bool, default: false)
是否加载动画效果
onEvents (optional, array(string=>function) )
为图表绑定事件
let onEvents = {
  'click': this.onChartClick,
  'legendselectchanged': this.onChartLegendselectchanged
}
...
更多内容参考 添加事件
opts (optional, object)
附加参数。有下面几个可选项:
devicePixelRatio
设备像素比,默认取浏览器的值window.devicePixelRatio。
renderer
渲染器,支持 'canvas' 或者 'svg'。参见 使用 Canvas 或者 SVG 渲染。
width
可显式指定实例宽度,单位为像素。如果传入值为 null/undefined/'auto',则表示自动取 dom(实例容器)的宽度。
height
可显式指定实例高度,单位为像素。如果传入值为 null/undefined/'auto',则表示自动取 dom(实例容器)的高度。