原文链接:http://tecdat.cn/?p=11803
Nelson-Siegel- [Svensson]模型是拟合收益曲线的常用方法。它的优点是其参数的经济可解释性,被银行广泛使用。但它不一定在所有情况下都有效:模型参数有时非常不稳定,无法收敛。
纳尔逊(Nelson)和西格尔(Siegel)在其原始论文中从远期利率入手,然后推导了收益率至到期曲线的公式.
![]()
Nelson-Siegel模型是简约的,可以生成丰富的收益曲线。
但是,由于简单地使用它,它通常失去了经济上的可解释性,甚至无法收敛。
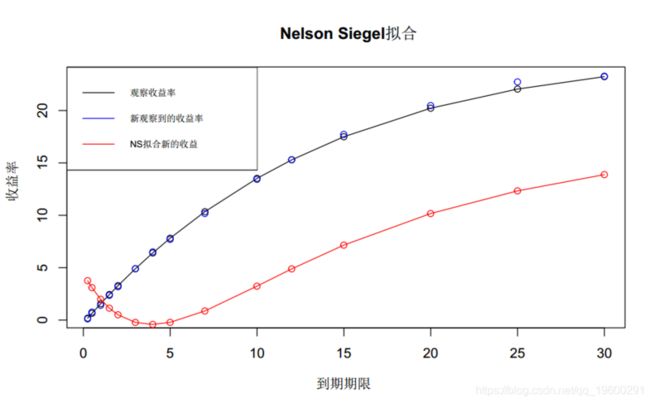
上图显示了这种情况。
 plot(MATURITY_BASES, oldYields
lines(MATURITY_BASES, oldYields)
points(newMats, newYields, col="blue")
lines(newMats, newYields, col="blue")
此代码模仿了一个频繁使用的案例,当前的收益曲线与昨天的曲线进行了比较。从某种意义上讲,这是一个简单示例,因为对于给定的到期日,我们已经具有零收益率。实际上,我们通常与票息债券有关,这会使事情变得更加复杂。
您可能会认为,由于软件的实施而导致收敛失败。我要讲的不是不好的实现,而是要高度依赖所使用的数值方法,如下面的更实际的示例所示。
提供更逼真的建模
#include
#ifdef BOOST_MSVC
#  include
#endif
#include
#include
#include
#include
#include


using namespace QuantLib;

int main(int, char*[]) {
    try {
        Calendar calendar = NullCalendar();
        Date today = Date(18, December, 2017);
        Settings::instance().evaluationDate() = today;

        //市场数据
        double cleanPrices1[] = { 107.96, 135.88, 110.6,   133.46, 135.8,  142.155, 121.045, 134.97, 117.04,
            101.61, 128.67, 106.615, 106.36, 99.515, 101.21,  105.655, 114.828 };
        double cleanPrices2[] = { 107.9,  134.965, 110.37,  132.89, 135.62,140.845, 120.585, 133.995, 116.745,
            101.58, 128.115,105.985, 105.395,99.385, 100.79,104.955, 114.7985 };
        double cleanPrices3[] = { 107.96, 134.625, 110.58, 132.65, 135.145, 140.585, 120.385, 133.735, 116.635,
            101.62, 127.925, 105.6, 105.085, 99.29, 100.6, 104.945, 114.7415 };
        double cleanPrices4[] = { 107.78, 134.39, 110.175, 132.445, 134.905, 139.515, 120.115, 133.475, 116.455,
            101.58, 127.845, 105.53,104.805, 99.07, 100.46, 104.885, 114.6225 };


        std::vector > bondHelpersA;
        std::vector< boost::shared_ptr > quoteA;
        std::vector > bondHelpersB;

        for (Size i = 0; i < numberOfBonds; i++) {
            boost::shared_ptr cp1(new SimpleQuote(cleanPrices1));
            quoteA.push_back(cp1);
            boost::shared_ptr cp2(new SimpleQuote(cleanPrices2));
            quoteB.push_back(cp2);
            boost::shared_ptr cp3(new SimpleQuote(cleanPrices3));
            quoteC.push_back(cp3);
            boost::shared_ptr cp4(new SimpleQuote(cleanPrices4));
            quoteD.push_back(cp4);
        }

        RelinkableHandle quoteHandleA[numberOfBonds];


        //Nelson-Siegel模型拟合
        Real tolerance = 1.0e-14;
        Size max = 10000;

        boost::shared_ptr tsA(
            new FittedBondDiscountCurve(curveSettlementDays,
                calendar,
                instrumentsA,
                ActualActual(),
                NelsonSiegelFitting(),
                tolerance,
                max));


        boost::shared_ptr tsB(
            new FittedBondDiscountCurve(curveSettlementDays,
                calendar,
                instrumentsB,
                ActualActual(),
                NelsonSiegelFitting(),
                tolerance,
                max));

        boost::shared_ptr tsC(
            new FittedBondDiscountCurve(curveSettlementDays,
                calendar,
                instrumentsC,
                ActualActual(),
                NelsonSiegelFitting(),
                tolerance,
                max));

        boost::shared_ptr tsD(
            new FittedBondDiscountCurve(curveSettlementDays,
                calendar,
                instrumentsD,
                ActualActual(),
                NelsonSiegelFitting(),
                tolerance,
                max));

        std::cout << tsA->fitResults().numberOfIterations() << std::endl;
        std::cout << tsB->fitResults().numberOfIterations() << std::endl;
正式而言,收益曲线每天的变化并不显着,但是模型参数却可以:
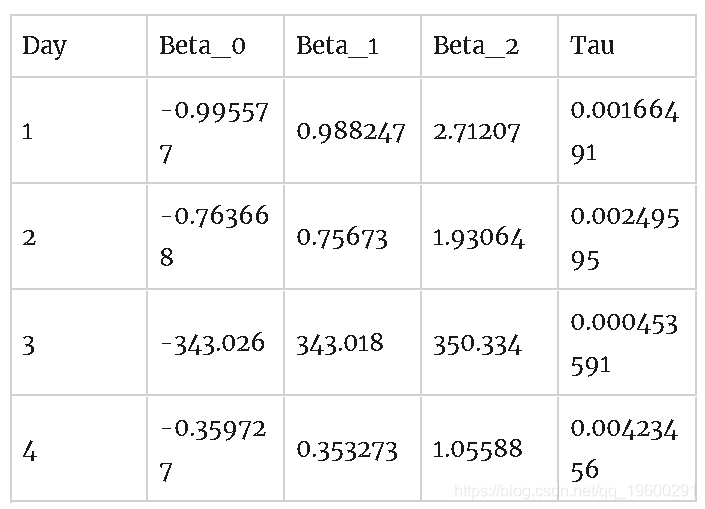
Nelson-Siegel意识到了这些问题,并提供了解决这些问题的方法。特别是,他们考虑了Taus的时间序列,并确定了Taus的最佳拟合值的中值和合理范围。
但是,与往常一样,原始论文被引用的次数可能多于阅读次数。此外,如果需要按时间顺序排列的收益率数据,可能会感到困惑,而不是仅仅考虑相关日期的数据。即使处理时间序列不是问题,Nelson和Siegel也没有指定_正式的_算法来选择的最佳值。