python可视化神器——pyecharts
与基本的Matplotlib绘图相比,pyecharts的交互以及可视化更为友好,更适合于项目开发、商业报告。
github.com/pyecharts/pyecharts
pyecharts 分为 v0.5.X 和 v1 两个大版本,v0.5.X 和 v1 间不兼容,v1 是一个全新的版本,很多函数的用法出现了变更
第一个pyecharts程序
bar.add_x/yaxis() 添加横/纵坐标
bar.render() 存储文件,默认html文件
#V1

from pyecharts.charts import Bar

bar = Bar()
bar.add_xaxis(["衬衫", "羊毛衫", "雪纺衫", "裤子", "高跟鞋", "袜子"])
bar.add_yaxis("商家A", [5, 20, 36, 10, 75, 90])
# render 会生成本地 HTML 文件,默认会在当前目录生成 render.html 文件
# 也可以传入路径参数,如 bar.render("mycharts.html")
bar.render()
# render_notebook 则在notebook页面中直接显示
bar.render_notebook()
常用图表绘制
v1就是正常的anaconda的python
v0.5的是pyecharts-v05的python环境 pyecharts==0.1.9.4
v1的样例:
https://github.com/pyecharts/pyecharts/tree/master/example
图云
#V1

from pyecharts import options as opts
from pyecharts.charts import Page, WordCloud
from pyecharts.globals import SymbolType

words = [
    ("花鸟市场", 1446),("汽车", 928),("视频", 906),("电视", 825),("家居饰品", 29),("家居日常用品", 10),("生活服务", 883),("物流配送", 536),("家政服务", 108),("摄影服务", 49),("搬家服务", 38),("物业维修", 37),("婚庆服务", 24),("二手回收", 24),("鲜花配送", 3),("维修服务", 3)
]

wordCloud = WordCloud()
wordCloud.add("", words, word_size_range=[20, 100])

wordCloud.render()
#v0.5 from pyecharts import WordCloud name = ['Sam S Club', 'Macys', 'Amy Schumer', 'Jurassic World', 'Charter Communications', 'Chick Fil A', 'Planet Fitness', 'Pitch Perfect', 'Express', 'Home', 'Johnny Depp', 'Lena Dunham', 'Lewis Hamilton', 'KXAN', 'Mary Ellen Mark', 'Farrah Abraham', 'Rita Ora', 'Serena Williams', 'NCAA baseball tournament', 'Point Break'] value = [10000, 6181, 4386, 4055, 2467, 2244, 1898, 1484, 1112, 965, 847, 582, 555, 550, 462, 366, 360, 282, 273, 265] wordcloud = WordCloud(width=1300, height=620) wordcloud.add("", name, value, word_size_range=[20, 100]) wordcloud.show_config() wordcloud.render()
水滴球
#v0.5
from pyecharts import Liquid

liquid = Liquid("水球图示例")
liquid.add("Liquid", [0.6, 0.5, 0.4, 0.3], is_liquid_animation=False, shape='diamond')
#liquid.show_config()
liquid.render()
#v0.5 from pyecharts import Liquid liquid = Liquid("水球图示例") liquid.add("Liquid", [0.6]) liquid.show_config() liquid.render()这个是动态的,上面那个是静态的
#v1

from pyecharts import options as opts
from pyecharts.charts import Grid, Liquid, Page
from pyecharts.commons.utils import JsCode
from pyecharts.faker import Collector
from pyecharts.globals import SymbolType

C = Collector()


@C.funcs
def liquid_base() -> Liquid:
    c = (
        Liquid()
        .add("lq", [0.6, 0.7])
        .set_global_opts(title_opts=opts.TitleOpts(title="Liquid-基本示例"))
    )
    return c


@C.funcs
def liquid_data_precision() -> Liquid:
    c = (
        Liquid()
        .add(
            "lq",
            [0.3254],
            label_opts=opts.LabelOpts(
                font_size=50,
                formatter=JsCode(
                    """function (param) {
                        return (Math.floor(param.value * 10000) / 100) + '%';
                    }"""
                ),
                position="inside",
            ),
        )
        .set_global_opts(title_opts=opts.TitleOpts(title="Liquid-数据精度"))
    )
    return c


@C.funcs
def liquid_without_outline() -> Liquid:
    c = (
        Liquid()
        .add("lq", [0.6, 0.7, 0.8], is_outline_show=False)
        .set_global_opts(title_opts=opts.TitleOpts(title="Liquid-无边框"))
    )
    return c


@C.funcs
def liquid_shape_diamond() -> Liquid:
    c = (
        Liquid()
        .add("lq", [0.4, 0.7], is_outline_show=False, shape=SymbolType.DIAMOND)
        .set_global_opts(title_opts=opts.TitleOpts(title="Liquid-Shape-diamond"))
    )
    return c


@C.funcs
def liquid_shape_arrow() -> Liquid:
    c = (
        Liquid()
        .add("lq", [0.3, 0.7], is_outline_show=False, shape=SymbolType.ARROW)
        .set_global_opts(title_opts=opts.TitleOpts(title="Liquid-Shape-arrow"))
    )
    return c


@C.funcs
def liquid_shape_rect() -> Liquid:
    c = (
        Liquid()
        .add("lq", [0.3, 0.7], is_outline_show=False, shape=SymbolType.RECT)
        .set_global_opts(title_opts=opts.TitleOpts(title="Liquid-Shape-rect"))
    )
    return c


@C.funcs
def multiple_liquid() -> Grid:
    l1 = (
        Liquid()
        .add("lq", [0.6, 0.7], center=["60%", "50%"])
        .set_global_opts(title_opts=opts.TitleOpts(title="多个 Liquid 显示"))
    )

    l2 = Liquid().add(
        "lq",
        [0.3254],
        center=["25%", "50%"],
        label_opts=opts.LabelOpts(
            font_size=50,
            formatter=JsCode(
                """function (param) {
                        return (Math.floor(param.value * 10000) / 100) + '%';
                    }"""
            ),
            position="inside",
        ),
    )

    grid = Grid().add(l1, grid_opts=opts.GridOpts()).add(l2, grid_opts=opts.GridOpts())
    return grid


Page().add(*[fn() for fn, _ in C.charts]).render()
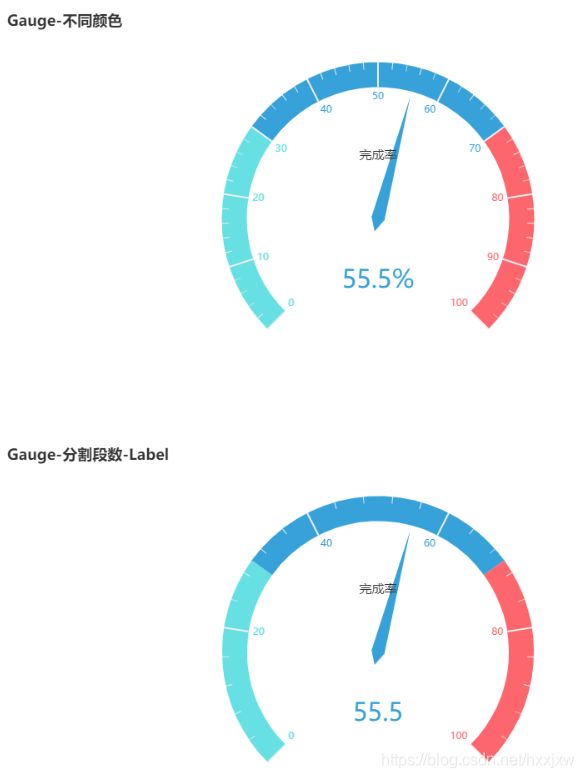
仪表盘
#v0.5
from pyecharts import Gauge

gauge = Gauge("仪表盘示例")
gauge.add("业务指标", "完成率", 66.66)
gauge.show_config()
gauge.render()
from pyecharts import options as opts from pyecharts.charts import Gauge, Page from pyecharts.faker import Collector C = Collector() @C.funcs def gauge_base() -> Gauge: c = ( Gauge() .add("", [("完成率", 66.6)]) .set_global_opts(title_opts=opts.TitleOpts(title="Gauge-基本示例")) ) return c @C.funcs def gauge_color() -> Gauge: c = ( Gauge() .add( "业务指标", [("完成率", 55.5)], axisline_opts=opts.AxisLineOpts( linestyle_opts=opts.LineStyleOpts( color=[(0.3, "#67e0e3"), (0.7, "#37a2da"), (1, "#fd666d")], width=30 ) ), ) .set_global_opts( title_opts=opts.TitleOpts(title="Gauge-不同颜色"), legend_opts=opts.LegendOpts(is_show=False), ) ) return c @C.funcs def gauge_splitnum_label() -> Gauge: c = ( Gauge() .add( "业务指标", [("完成率", 55.5)], split_number=5, axisline_opts=opts.AxisLineOpts( linestyle_opts=opts.LineStyleOpts( color=[(0.3, "#67e0e3"), (0.7, "#37a2da"), (1, "#fd666d")], width=30 ) ), detail_label_opts=opts.LabelOpts(formatter="{value}"), ) .set_global_opts( title_opts=opts.TitleOpts(title="Gauge-分割段数-Label"), legend_opts=opts.LegendOpts(is_show=False), ) ) return c @C.funcs def gauge_label_title_setting() -> Gauge: c = ( Gauge() .add( "", [("完成率", 66.6)], title_label_opts=opts.LabelOpts( font_size=40, color="blue", font_family="Microsoft YaHei" ), ) .set_global_opts(title_opts=opts.TitleOpts(title="Gauge-改变轮盘内的字体")) ) return c @C.funcs def gauge_change_radius() -> Gauge: c = ( Gauge() .add("", [("完成率", 66.6)], radius="50%") .set_global_opts(title_opts=opts.TitleOpts(title="Gauge-修改 Radius 为 50%")) ) return c Page().add(*[fn() for fn, _ in C.charts]).render()
雷达图
#v0.5
from pyecharts import Radar

schema = [
    ("销售", 6500), ("管理", 16000), ("信息技术", 30000), ("客服", 38000), ("研发", 52000), ("市场", 25000)]
v1 = [[4300, 10000, 28000, 35000, 50000, 19000]]
v2 = [[5000, 14000, 28000, 31000, 42000, 21000]]
radar = Radar()
radar.config(schema)
radar.add("预算分配", v1, is_splitline=True, is_axisline_show=True)
radar.add("实际开销", v2, label_color=["#4e79a7"], is_area_show=False)
radar.show_config()
radar.render()
点击上方的红蓝点还可以显示/隐藏图线
#v0.5
from pyecharts import Radar
value_bj = [
    [55, 9, 56, 0.46, 18, 6, 1], [25, 11, 21, 0.65, 34, 9, 2],
    [56, 7, 63, 0.3, 14, 5, 3], [33, 7, 29, 0.33, 16, 6, 4]]

value_sh = [
    [91, 45, 125, 0.82, 34, 23, 1], [65, 27, 78, 0.86, 45, 29, 2],
    [83, 60, 84, 1.09, 73, 27, 3], [109, 81, 121, 1.28, 68, 51, 4]]

c_schema= [{"name": "AQI", "max": 300, "min": 5},
           {"name": "PM2.5", "max": 250, "min": 20},
           {"name": "PM10", "max": 300, "min": 5},
           {"name": "CO", "max": 5},
           {"name": "NO2", "max": 200},
           {"name": "SO2", "max": 100}]
radar = Radar()
radar.config(c_schema=c_schema, shape='circle')
radar.add("北京", value_bj, item_color="#f9713c", symbol=None)
radar.add("上海", value_sh, item_color="#b3e4a1", symbol=None)
radar.show_config()
radar.render()
漏斗图
#v0.5
from pyecharts import Funnel

attr = ["衬衫", "羊毛衫", "雪纺衫", "裤子", "高跟鞋", "袜子"]
value = [20, 40, 60, 80, 100, 120]
funnel = Funnel("漏斗图示例")
funnel.add("商品", attr, value, is_label_show=True, label_pos="inside", label_text_color="#fff")
funnel.render()
#v1 from pyecharts import options as opts from pyecharts.charts import Funnel, Page from pyecharts.faker import Collector, Faker C = Collector() @C.funcs def funnel_base() -> Funnel: c = ( Funnel() .add("商品", [list(z) for z in zip(Faker.choose(), Faker.values())]) .set_global_opts(title_opts=opts.TitleOpts(title="Funnel-基本示例")) ) return c @C.funcs def funnel_label_inside() -> Funnel: c = ( Funnel() .add( "商品", [list(z) for z in zip(Faker.choose(), Faker.values())], label_opts=opts.LabelOpts(position="inside"), ) .set_global_opts(title_opts=opts.TitleOpts(title="Funnel-Label(inside)")) ) return c @C.funcs def funnel_sort_ascending() -> Funnel: c = ( Funnel() .add( "商品", [list(z) for z in zip(Faker.choose(), Faker.values())], sort_="ascending", label_opts=opts.LabelOpts(position="inside"), ) .set_global_opts(title_opts=opts.TitleOpts(title="Funnel-Sort(ascending)")) ) return c Page().add(*[fn() for fn, _ in C.charts]).render()
日历图
import datetime
import random

from pyecharts import options as opts
from pyecharts.charts import Calendar, Page
from pyecharts.faker import Collector

C = Collector()


@C.funcs
def calendar_base() -> Calendar:
    begin = datetime.date(2017, 1, 1)
    end = datetime.date(2017, 12, 31)
    data = [
        [str(begin + datetime.timedelta(days=i)), random.randint(1000, 25000)]
        for i in range((end - begin).days + 1)
    ]

    c = (
        Calendar()
        .add("", data, calendar_opts=opts.CalendarOpts(range_="2017"))
        .set_global_opts(
            title_opts=opts.TitleOpts(title="Calendar-2017年微信步数情况"),
            visualmap_opts=opts.VisualMapOpts(
                max_=20000,
                min_=500,
                orient="horizontal",
                is_piecewise=True,
                pos_top="230px",
                pos_left="100px",
            ),
        )
    )
    return c


@C.funcs
def calendar_label_setting() -> Calendar:
    begin = datetime.date(2017, 1, 1)
    end = datetime.date(2017, 12, 31)
    data = [
        [str(begin + datetime.timedelta(days=i)), random.randint(1000, 25000)]
        for i in range((end - begin).days + 1)
    ]

    c = (
        Calendar()
        .add(
            "",
            data,
            calendar_opts=opts.CalendarOpts(
                range_="2017",
                daylabel_opts=opts.CalendarDayLabelOpts(name_map="cn"),
                monthlabel_opts=opts.CalendarMonthLabelOpts(name_map="cn"),
            ),
        )
        .set_global_opts(
            title_opts=opts.TitleOpts(title="Calendar-2017年微信步数情况(中文 Label)"),
            visualmap_opts=opts.VisualMapOpts(
                max_=20000,
                min_=500,
                orient="horizontal",
                is_piecewise=True,
                pos_top="230px",
                pos_left="100px",
            ),
        )
    )
    return c


Page().add(*[fn() for fn, _ in C.charts]).render()
微博转发关系图
#v0.5
from pyecharts import Graph
import json
with open("weibo.json", "r", encoding="utf-8") as f:
    j = json.load(f)
    nodes, links, categories, cont, mid, userl = j
graph = Graph("微博转发关系图", width=1200, height=600)

graph.add("", nodes, links, categories, label_pos="right", repulsion=50, is_legend_show=False,
          line_curve=0.2, label_text_color=None)
graph.show_config()
graph.render()
weibo.json可以在这里下
github.com/pyecharts/pyecharts/tree/master/example/fixtures
import json
import os

from pyecharts.commons.utils import JsCode

#v1

from pyecharts import options as opts
from pyecharts.charts import Graph, Page
from pyecharts.faker import Collector

C = Collector()


@C.funcs
def graph_base() -> Graph:
    nodes = [
        {"name": "结点1", "symbolSize": 10},
        {"name": "结点2", "symbolSize": 20},
        {"name": "结点3", "symbolSize": 30},
        {"name": "结点4", "symbolSize": 40},
        {"name": "结点5", "symbolSize": 50},
        {"name": "结点6", "symbolSize": 40},
        {"name": "结点7", "symbolSize": 30},
        {"name": "结点8", "symbolSize": 20},
    ]
    links = []
    for i in nodes:
        for j in nodes:
            links.append({"source": i.get("name"), "target": j.get("name")})
    c = (
        Graph()
        .add("", nodes, links, repulsion=8000)
        .set_global_opts(title_opts=opts.TitleOpts(title="Graph-基本示例"))
    )
    return c


@C.funcs
def graph_with_opts() -> Graph:
    nodes = [
        opts.GraphNode(name="结点1", symbol_size=10),
        opts.GraphNode(name="结点2", symbol_size=20),
        opts.GraphNode(name="结点3", symbol_size=30),
        opts.GraphNode(name="结点4", symbol_size=40),
        opts.GraphNode(name="结点5", symbol_size=50),
    ]
    links = [
        opts.GraphLink(source="结点1", target="结点2"),
        opts.GraphLink(source="结点2", target="结点3"),
        opts.GraphLink(source="结点3", target="结点4"),
        opts.GraphLink(source="结点4", target="结点5"),
        opts.GraphLink(source="结点5", target="结点1"),
    ]
    c = (
        Graph()
        .add("", nodes, links, repulsion=4000)
        .set_global_opts(title_opts=opts.TitleOpts(title="Graph-GraphNode-GraphLink"))
    )
    return c


@C.funcs
def graph_with_edge_opts() -> Graph:
    nodes_data = [
        opts.GraphNode(name="结点1", symbol_size=10),
        opts.GraphNode(name="结点2", symbol_size=20),
        opts.GraphNode(name="结点3", symbol_size=30),
        opts.GraphNode(name="结点4", symbol_size=40),
        opts.GraphNode(name="结点5", symbol_size=50),
        opts.GraphNode(name="结点6", symbol_size=60),
    ]
    links_data = [
        opts.GraphLink(source="结点1", target="结点2", value=2),
        opts.GraphLink(source="结点2", target="结点3", value=3),
        opts.GraphLink(source="结点3", target="结点4", value=4),
        opts.GraphLink(source="结点4", target="结点5", value=5),
        opts.GraphLink(source="结点5", target="结点6", value=6),
        opts.GraphLink(source="结点6", target="结点1", value=7),
    ]
    c = (
        Graph()
        .add(
            "",
            nodes_data,
            links_data,
            repulsion=4000,
            edge_label=opts.LabelOpts(
                is_show=True, position="middle", formatter="{b} 的数据 {c}"
            ),
        )
        .set_global_opts(
            title_opts=opts.TitleOpts(title="Graph-GraphNode-GraphLink-WithEdgeLabel")
        )
    )
    return c


@C.funcs
def graph_weibo() -> Graph:
    with open(os.path.join("fixtures", "weibo.json"), "r", encoding="utf-8") as f:
        j = json.load(f)
        nodes, links, categories, cont, mid, userl = j
    c = (
        Graph()
        .add(
            "",
            nodes,
            links,
            categories,
            repulsion=50,
            linestyle_opts=opts.LineStyleOpts(curve=0.2),
            label_opts=opts.LabelOpts(is_show=False),
        )
        .set_global_opts(
            legend_opts=opts.LegendOpts(is_show=False),
            title_opts=opts.TitleOpts(title="Graph-微博转发关系图"),
        )
    )
    return c


@C.funcs
def graph_les_miserables():
    with open(
        os.path.join("fixtures", "les-miserables.json"), "r", encoding="utf-8"
    ) as f:
        j = json.load(f)
        nodes = j["nodes"]
        links = j["links"]
        categories = j["categories"]

    c = (
        Graph(init_opts=opts.InitOpts(width="1000px", height="600px"))
        .add(
            "",
            nodes=nodes,
            links=links,
            categories=categories,
            layout="circular",
            is_rotate_label=True,
            linestyle_opts=opts.LineStyleOpts(color="source", curve=0.3),
            label_opts=opts.LabelOpts(position="right"),
        )
        .set_global_opts(
            title_opts=opts.TitleOpts(title="Graph-Les Miserables"),
            legend_opts=opts.LegendOpts(
                orient="vertical", pos_left="2%", pos_top="20%"
            ),
        )
    )
    return c


@C.funcs
def graph_npm_dependencies() -> Graph:
    with open(os.path.join("fixtures", "npmdepgraph.json"), "r", encoding="utf-8") as f:
        j = json.load(f)
    nodes = [
        {
            "x": node["x"],
            "y": node["y"],
            "id": node["id"],
            "name": node["label"],
            "symbolSize": node["size"],
            "itemStyle": {"normal": {"color": node["color"]}},
        }
        for node in j["nodes"]
    ]

    edges = [
        {"source": edge["sourceID"], "target": edge["targetID"]} for edge in j["edges"]
    ]

    c = (
        Graph(init_opts=opts.InitOpts(width="1000px", height="600px"))
        .add(
            "",
            nodes=nodes,
            links=edges,
            layout="none",
            label_opts=opts.LabelOpts(is_show=False),
            linestyle_opts=opts.LineStyleOpts(width=0.5, curve=0.3, opacity=0.7),
        )
        .set_global_opts(title_opts=opts.TitleOpts(title="Graph-NPM Dependencies"))
    )
    return c


Page().add(*[fn() for fn, _ in C.charts]).render()
带有涟漪特效动画的散点图
#v0.5

from pyecharts import EffectScatter
es = EffectScatter("动态散点图各种图形示例")
es.add("", [10], [10], symbol_size=20, effect_scale=3.5, effect_period=3, symbol="pin")
es.add("", [20], [20], symbol_size=12, effect_scale=4.5, effect_period=4,symbol="rect")
es.add("", [30], [30], symbol_size=30, effect_scale=5.5, effect_period=5,symbol="roundRect")
es.add("", [40], [40], symbol_size=10, effect_scale=6.5, effect_brushtype='fill',symbol="diamond")
es.add("", [50], [50], symbol_size=16, effect_scale=5.5, effect_period=3,symbol="arrow")
es.add("", [60], [60], symbol_size=6, effect_scale=2.5, effect_period=3,symbol="triangle")
es.render()
#v0.5 from pyecharts import EffectScatter es = EffectScatter('散点图举例',background_color = 'white',title_text_size = 25) v1 = [12,22,34,29,16,14,18] v2 = [23,45,68,58,32,28,36] es.add('', v1, v2,symbol = 'pin',effect_scale = 5.5,xaxis_min = 10) es.render()#v0.5 from pyecharts import EffectScatter v1 = [10, 20, 30, 40, 50, 60] v2 = [25, 20, 15, 10, 60, 33] es = EffectScatter("动态散点图示例") es.add("effectScatter", v1, v2) es.render()
关系图——力引导布局
#v0.5

from pyecharts import Graph
nodes = [{"name": "结点1", "symbolSize": 10},
         {"name": "结点2", "symbolSize": 20},
         {"name": "结点3", "symbolSize": 30},
         {"name": "结点4", "symbolSize": 40},
         {"name": "结点5", "symbolSize": 50},
         {"name": "结点6", "symbolSize": 40},
         {"name": "结点7", "symbolSize": 30},
         {"name": "结点8", "symbolSize": 20}]
links = []
for i in nodes:
    for j in nodes:
        links.append({"source": i.get('name'), "target": j.get('name')})
graph = Graph("关系图-环形布局示例")
graph.add("", nodes, links, is_label_show=True, repulsion=8000, layout='circular', label_text_color=None)
graph.show_config()
graph.render()
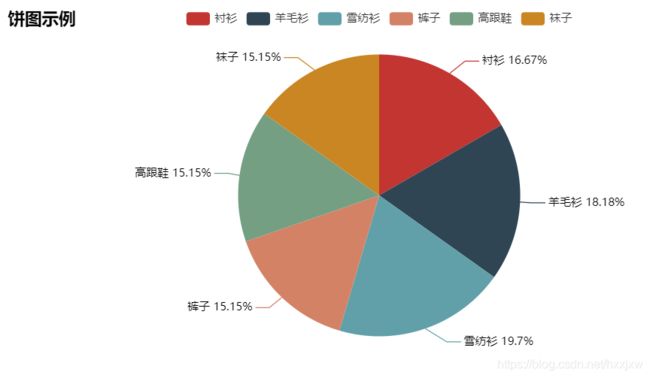
饼图
#v0.5
from pyecharts import Pie

attr = ["衬衫", "羊毛衫", "雪纺衫", "裤子", "高跟鞋", "袜子"]
v1 = [11, 12, 13, 10, 10, 10]
pie = Pie("饼图示例")
pie.add("", attr, v1, is_label_show=True)
pie.show_config()
pie.render()
饼图—玫瑰图
#v0.5
from pyecharts import Pie

attr = ["衬衫", "羊毛衫", "雪纺衫", "裤子", "高跟鞋", "袜子"]
v1 = [11, 12, 13, 10, 10, 10]
v2 = [19, 21, 32, 20, 20, 33]
pie = Pie("饼图-玫瑰图示例", title_pos='center', width=900)
pie.add("商品A", attr, v1, center=[25, 50], is_random=True, radius=[30, 75], rosetype='radius')
pie.add("商品B", attr, v2, center=[75, 50], is_random=True, radius=[30, 75], rosetype='area',
        is_legend_show=False, is_label_show=True)
pie.show_config()
pie.render()
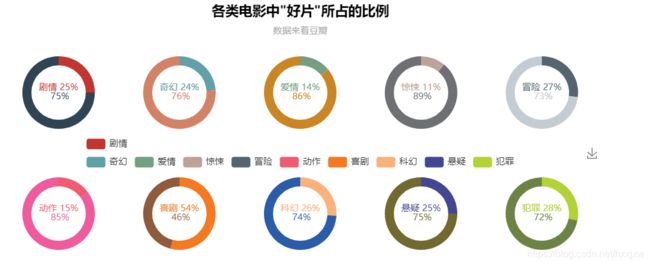
#v0.5 from pyecharts import Pie pie =Pie('各类电影中"好片"所占的比例', "数据来着豆瓣", title_pos='center') pie.add("", ["剧情", ""], [25, 75], center=[10, 30], radius=[18, 24], label_pos='center', is_label_show=True, label_text_color=None, ) pie.add("", ["奇幻", ""], [24, 76], center=[30, 30], radius=[18, 24], label_pos='center', is_label_show=True, label_text_color=None, legend_pos='left') pie.add("", ["爱情", ""], [14, 86], center=[50, 30], radius=[18, 24], label_pos='center', is_label_show=True, label_text_color=None) pie.add("", ["惊悚", ""], [11, 89], center=[70, 30], radius=[18, 24], label_pos='center', is_label_show=True, label_text_color=None) pie.add("", ["冒险", ""], [27, 73], center=[90, 30], radius=[18, 24], label_pos='center', is_label_show=True, label_text_color=None) pie.add("", ["动作", ""], [15, 85], center=[10, 70], radius=[18, 24], label_pos='center', is_label_show=True, label_text_color=None) pie.add("", ["喜剧", ""], [54, 46], center=[30, 70], radius=[18, 24], label_pos='center', is_label_show=True, label_text_color=None) pie.add("", ["科幻", ""], [26, 74], center=[50, 70], radius=[18, 24], label_pos='center', is_label_show=True, label_text_color=None) pie.add("", ["悬疑", ""], [25, 75], center=[70, 70], radius=[18, 24], label_pos='center', is_label_show=True, label_text_color=None) pie.add("", ["犯罪", ""], [28, 72], center=[90, 70], radius=[18, 24], label_pos='center', is_label_show=True, label_text_color=None, is_legend_show=True, legend_top="center") pie.show_config() pie.render()极坐标系
#v0.5
from pyecharts import Polar

radius = ['周一', '周二', '周三', '周四', '周五', '周六', '周日']
polar = Polar("极坐标系-堆叠柱状图示例", width=1200, height=600)
polar.add("A", [1, 2, 3, 4, 3, 5, 1], radius_data=radius, type='barRadius', is_stack=True)
polar.add("B", [2, 4, 6, 1, 2, 3, 1], radius_data=radius, type='barRadius', is_stack=True)
polar.add("C", [1, 2, 3, 4, 1, 2, 5], radius_data=radius, type='barRadius', is_stack=True)
polar.show_config()
polar.render()
#v0.5 from pyecharts import Polar radius = ['周一', '周二', '周三', '周四', '周五', '周六', '周日'] polar = Polar("极坐标系-堆叠柱状图示例", width=1200, height=600) polar.add("", [1, 2, 3, 4, 3, 5, 1], radius_data=radius, type='barAngle', is_stack=True) polar.add("", [2, 4, 6, 1, 2, 3, 1], radius_data=radius, type='barAngle', is_stack=True) polar.add("", [1, 2, 3, 4, 1, 2, 5], radius_data=radius, type='barAngle', is_stack=True) polar.show_config() polar.render()
#v1

import math
import random

from pyecharts import options as opts
from pyecharts.charts import Page, Polar
from pyecharts.faker import Collector, Faker

C = Collector()


@C.funcs
def polar_scatter0() -> Polar:
    data = [(i, random.randint(1, 100)) for i in range(101)]
    c = (
        Polar()
        .add("", data, type_="scatter", label_opts=opts.LabelOpts(is_show=False))
        .set_global_opts(title_opts=opts.TitleOpts(title="Polar-Scatter0"))
    )
    return c


@C.funcs
def polar_scatter1() -> Polar:
    c = (
        Polar()
        .add("", [(10, random.randint(1, 100)) for i in range(300)], type_="scatter")
        .add("", [(11, random.randint(1, 100)) for i in range(300)], type_="scatter")
        .set_series_opts(label_opts=opts.LabelOpts(is_show=False))
        .set_global_opts(title_opts=opts.TitleOpts(title="Polar-Scatter1"))
    )

    return c


@C.funcs
def polar_effectscatter() -> Polar:
    data = [(i, random.randint(1, 100)) for i in range(10)]
    c = (
        Polar()
        .add(
            "",
            data,
            type_="effectScatter",
            effect_opts=opts.EffectOpts(scale=10, period=5),
            label_opts=opts.LabelOpts(is_show=False),
        )
        .set_global_opts(title_opts=opts.TitleOpts(title="Polar-EffectScatter"))
    )
    return c


@C.funcs
def polar_radiusaxis() -> Polar:
    c = (
        Polar()
        .add_schema(
            radiusaxis_opts=opts.RadiusAxisOpts(data=Faker.week, type_="category"),
            angleaxis_opts=opts.AngleAxisOpts(is_clockwise=True, max_=10),
        )
        .add("A", [1, 2, 3, 4, 3, 5, 1], type_="bar")
        .set_global_opts(title_opts=opts.TitleOpts(title="Polar-RadiusAxis"))
        .set_series_opts(label_opts=opts.LabelOpts(is_show=True))
    )
    return c


@C.funcs
def polar_angleaxis() -> Polar:
    c = (
        Polar()
        .add_schema(
            angleaxis_opts=opts.AngleAxisOpts(data=Faker.week, type_="category")
        )
        .add("A", [1, 2, 3, 4, 3, 5, 1], type_="bar", stack="stack0")
        .add("B", [2, 4, 6, 1, 2, 3, 1], type_="bar", stack="stack0")
        .add("C", [1, 2, 3, 4, 1, 2, 5], type_="bar", stack="stack0")
        .set_global_opts(title_opts=opts.TitleOpts(title="Polar-AngleAxis"))
    )
    return c


@C.funcs
def polar_love() -> Polar:
    data = []
    for i in range(101):
        theta = i / 100 * 360
        r = 5 * (1 + math.sin(theta / 180 * math.pi))
        data.append([r, theta])
    hour = [i for i in range(1, 25)]
    c = (
        Polar()
        .add_schema(
            angleaxis_opts=opts.AngleAxisOpts(
                data=hour, type_="value", boundary_gap=False, start_angle=0
            )
        )
        .add("love", data, label_opts=opts.LabelOpts(is_show=False))
        .set_global_opts(title_opts=opts.TitleOpts(title="Polar-Love"))
    )
    return c


@C.funcs
def polar_flower() -> Polar:
    data = []
    for i in range(361):
        t = i / 180 * math.pi
        r = math.sin(2 * t) * math.cos(2 * t)
        data.append([r, i])
    c = (
        Polar()
        .add_schema(angleaxis_opts=opts.AngleAxisOpts(start_angle=0, min_=0))
        .add("flower", data, label_opts=opts.LabelOpts(is_show=False))
        .set_global_opts(title_opts=opts.TitleOpts(title="Polar-Flower"))
    )
    return c


Page().add(*[fn() for fn, _ in C.charts]).render()
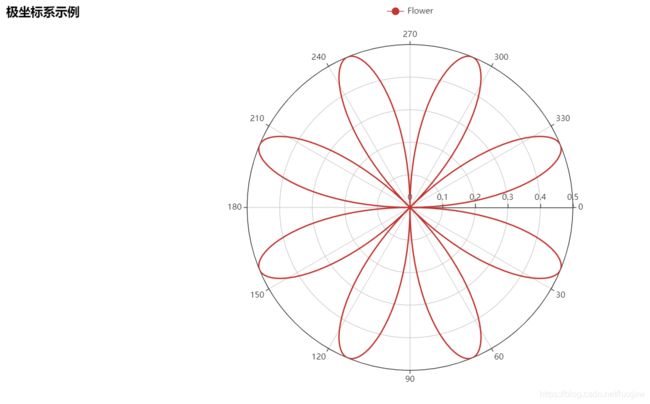
极坐标系画图案
#v0.5
import math
from pyecharts import Polar
data =[]
for i in range(101):
    theta =i /100*360
    r =5*(1+math.sin(theta /180*math.pi))
    data.append([r, theta])
hour =[i for i in range(1, 25)]
polar =Polar("极坐标系示例", width=1200, height=600)
polar.add("Love", data, angle_data=hour, boundary_gap=False,start_angle=0)
polar.show_config()
polar.render()
#v0.5
import math
from pyecharts import Polar
data =[]
for i in range(361):
    t =i /180*math.pi
    r =math.sin(2*t) *math.cos(2*t)
    data.append([r, i])
polar =Polar("极坐标系示例", width=1200, height=600)
polar.add("Flower", data, start_angle=0, symbol=None, axis_range=[0, None])
polar.show_config()
polar.render()
#v0.5 import math from pyecharts import Polar data =[] for i in range(361): t =i /180*math.pi r =math.sin(2*t) *math.cos(2*t) data.append([r, i]) polar =Polar("极坐标系示例", width=1200, height=600) polar.add("Color-Flower", data, start_angle=0, symbol=None, axis_range=[0, None], area_color="#f71f24", area_opacity=0.6) polar.show_config() polar.render()#v0.5 import math from pyecharts import Polar data =[] for i in range(5): for j in range(101): theta =j /100*360 alpha =i *360+theta r =math.pow(math.e, 0.003*alpha) data.append([r, theta]) polar =Polar("极坐标系示例") polar.add("", data, symbol_size=0, symbol='circle', start_angle=-25, is_radiusaxis_show=False, area_color="#f3c5b3", area_opacity=0.5, is_angleaxis_show=False) polar.show_config() polar.render()折线/面积图
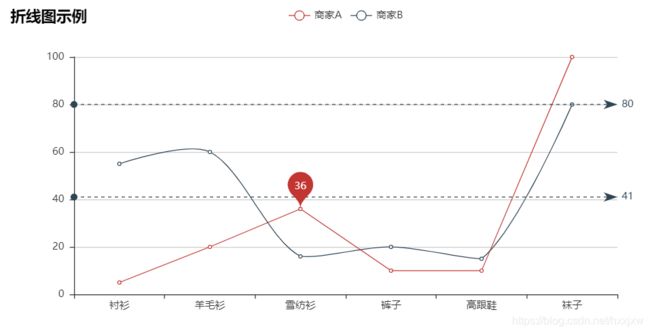
#v0.5
from pyecharts import Line

attr = ["衬衫", "羊毛衫", "雪纺衫", "裤子", "高跟鞋", "袜子"]
v1 = [5, 20, 36, 10, 10, 100]
v2 = [55, 60, 16, 20, 15, 80]
line = Line("折线图示例")
line.add("商家A", attr, v1, mark_point=["average"])
line.add("商家B", attr, v2, is_smooth=True, mark_line=["max", "average"])
line.show_config()
line.render()
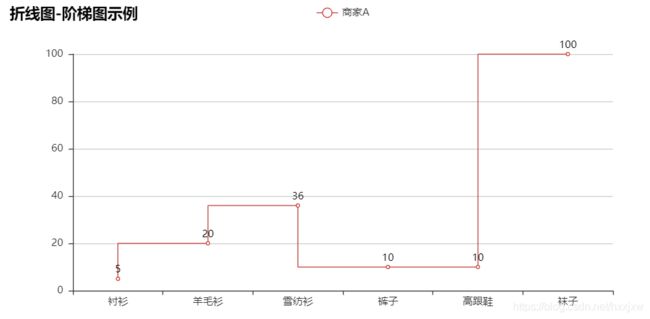
#v0.5 from pyecharts import Line attr = ["衬衫", "羊毛衫", "雪纺衫", "裤子", "高跟鞋", "袜子"] v1 = [5, 20, 36, 10, 10, 100] line = Line("折线图-阶梯图示例") line.add("商家A", attr, v1, is_step=True, is_label_show=True) line.show_config() line.render()#v0.5 from pyecharts import Line attr = ["衬衫", "羊毛衫", "雪纺衫", "裤子", "高跟鞋", "袜子"] v1 = [5, 20, 36, 10, 10, 100] v2 = [55, 60, 16, 20, 15, 80] line = Line("折线图-面积图示例") line.add("商家A", attr, v1, is_fill=True, line_opacity=0.2, area_opacity=0.4, symbol=None) line.add("商家B", attr, v2, is_fill=True, area_color='#000', area_opacity=0.3, is_smooth=True) line.show_config() line.render()#v1 import pyecharts.options as opts from pyecharts.charts import Line, Page from pyecharts.commons.utils import JsCode from pyecharts.faker import Collector, Faker C = Collector() @C.funcs def line_base() -> Line: c = ( Line() .add_xaxis(Faker.choose()) .add_yaxis("商家A", Faker.values()) .add_yaxis("商家B", Faker.values()) .set_global_opts(title_opts=opts.TitleOpts(title="Line-基本示例")) ) return c @C.funcs def line_connect_null() -> Line: y = Faker.values() y[3], y[5] = None, None c = ( Line() .add_xaxis(Faker.choose()) .add_yaxis("商家A", y, is_connect_nones=True) .set_global_opts(title_opts=opts.TitleOpts(title="Line-连接空数据")) ) return c @C.funcs def line_smooth() -> Line: c = ( Line() .add_xaxis(Faker.choose()) .add_yaxis("商家A", Faker.values(), is_smooth=True) .add_yaxis("商家B", Faker.values(), is_smooth=True) .set_global_opts(title_opts=opts.TitleOpts(title="Line-smooth")) ) return c @C.funcs def line_areastyle() -> Line: c = ( Line() .add_xaxis(Faker.choose()) .add_yaxis( "商家A", Faker.values(), areastyle_opts=opts.AreaStyleOpts(opacity=0.5) ) .add_yaxis( "商家B", Faker.values(), areastyle_opts=opts.AreaStyleOpts(opacity=0.5) ) .set_global_opts(title_opts=opts.TitleOpts(title="Line-面积图")) ) return c @C.funcs def line_areastyle_boundary_gap() -> Line: c = ( Line() .add_xaxis(Faker.choose()) .add_yaxis("商家A", Faker.values(), is_smooth=True) .add_yaxis("商家B", Faker.values(), is_smooth=True) .set_series_opts( areastyle_opts=opts.AreaStyleOpts(opacity=0.5), label_opts=opts.LabelOpts(is_show=False), ) .set_global_opts( title_opts=opts.TitleOpts(title="Line-面积图(紧贴 Y 轴)"), xaxis_opts=opts.AxisOpts( axistick_opts=opts.AxisTickOpts(is_align_with_label=True), is_scale=False, boundary_gap=False, ), ) ) return c @C.funcs def line_yaxis_log() -> Line: c = ( Line() .add_xaxis(xaxis_data=["一", "二", "三", "四", "五", "六", "七", "八", "九"]) .add_yaxis( "2 的指数", y_axis=[1, 2, 4, 8, 16, 32, 64, 128, 256], linestyle_opts=opts.LineStyleOpts(width=2), ) .add_yaxis( "3 的指数", y_axis=[1, 3, 9, 27, 81, 247, 741, 2223, 6669], linestyle_opts=opts.LineStyleOpts(width=2), ) .set_global_opts( title_opts=opts.TitleOpts(title="Line-对数轴示例"), xaxis_opts=opts.AxisOpts(name="x"), yaxis_opts=opts.AxisOpts( type_="log", name="y", splitline_opts=opts.SplitLineOpts(is_show=True), is_scale=True, ), ) ) return c @C.funcs def line_markpoint_custom() -> Line: x, y = Faker.choose(), Faker.values() c = ( Line() .add_xaxis(x) .add_yaxis( "商家A", y, markpoint_opts=opts.MarkPointOpts( data=[opts.MarkPointItem(name="自定义标记点", coord=[x[2], y[2]], value=y[2])] ), ) .set_global_opts(title_opts=opts.TitleOpts(title="Line-MarkPoint(自定义)")) ) return c @C.funcs def line_markpoint() -> Line: c = ( Line() .add_xaxis(Faker.choose()) .add_yaxis( "商家A", Faker.values(), markpoint_opts=opts.MarkPointOpts(data=[opts.MarkPointItem(type_="min")]), ) .add_yaxis( "商家B", Faker.values(), markpoint_opts=opts.MarkPointOpts(data=[opts.MarkPointItem(type_="max")]), ) .set_global_opts(title_opts=opts.TitleOpts(title="Line-MarkPoint")) ) return c @C.funcs def line_markline() -> Line: c = ( Line() .add_xaxis(Faker.choose()) .add_yaxis( "商家A", Faker.values(), markline_opts=opts.MarkLineOpts(data=[opts.MarkLineItem(type_="average")]), ) .add_yaxis( "商家B", Faker.values(), markline_opts=opts.MarkLineOpts(data=[opts.MarkLineItem(type_="average")]), ) .set_global_opts(title_opts=opts.TitleOpts(title="Line-MarkLine")) ) return c @C.funcs def line_step() -> Line: c = ( Line() .add_xaxis(Faker.choose()) .add_yaxis("商家A", Faker.values(), is_step=True) .set_global_opts(title_opts=opts.TitleOpts(title="Line-阶梯图")) ) return c @C.funcs def line_itemstyle() -> Line: c = ( Line() .add_xaxis(xaxis_data=Faker.choose()) .add_yaxis( "商家A", Faker.values(), symbol="triangle", symbol_size=20, linestyle_opts=opts.LineStyleOpts(color="green", width=4, type_="dashed"), itemstyle_opts=opts.ItemStyleOpts( border_width=3, border_color="yellow", color="blue" ), ) .set_global_opts(title_opts=opts.TitleOpts(title="Line-ItemStyle")) ) return c @C.funcs def line_color_with_js_func() -> Line: x_data = ["14", "15", "16", "17", "18", "19", "20", "21", "22", "23"] y_data = [393, 438, 485, 631, 689, 824, 987, 1000, 1100, 1200] background_color_js = ( "new echarts.graphic.LinearGradient(0, 0, 0, 1, " "[{offset: 0, color: '#c86589'}, {offset: 1, color: '#06a7ff'}], false)" ) area_color_js = ( "new echarts.graphic.LinearGradient(0, 0, 0, 1, " "[{offset: 0, color: '#eb64fb'}, {offset: 1, color: '#3fbbff0d'}], false)" ) c = ( Line(init_opts=opts.InitOpts(bg_color=JsCode(background_color_js))) .add_xaxis(xaxis_data=x_data) .add_yaxis( series_name="注册总量", y_axis=y_data, is_smooth=True, is_symbol_show=True, symbol="circle", symbol_size=6, linestyle_opts=opts.LineStyleOpts(color="#fff"), label_opts=opts.LabelOpts(is_show=True, position="top", color="white"), itemstyle_opts=opts.ItemStyleOpts( color="red", border_color="#fff", border_width=3 ), tooltip_opts=opts.TooltipOpts(is_show=False), areastyle_opts=opts.AreaStyleOpts(color=JsCode(area_color_js), opacity=1), ) .set_global_opts( title_opts=opts.TitleOpts( title="OCTOBER 2015", pos_bottom="5%", pos_left="center", title_textstyle_opts=opts.TextStyleOpts(color="#fff", font_size=16), ), xaxis_opts=opts.AxisOpts( type_="category", boundary_gap=False, axislabel_opts=opts.LabelOpts(margin=30, color="#ffffff63"), axisline_opts=opts.AxisLineOpts(is_show=False), axistick_opts=opts.AxisTickOpts( is_show=True, length=25, linestyle_opts=opts.LineStyleOpts(color="#ffffff1f"), ), splitline_opts=opts.SplitLineOpts( is_show=True, linestyle_opts=opts.LineStyleOpts(color="#ffffff1f") ), ), yaxis_opts=opts.AxisOpts( type_="value", position="right", axislabel_opts=opts.LabelOpts(margin=20, color="#ffffff63"), axisline_opts=opts.AxisLineOpts( linestyle_opts=opts.LineStyleOpts(width=2, color="#fff") ), axistick_opts=opts.AxisTickOpts( is_show=True, length=15, linestyle_opts=opts.LineStyleOpts(color="#ffffff1f"), ), splitline_opts=opts.SplitLineOpts( is_show=True, linestyle_opts=opts.LineStyleOpts(color="#ffffff1f") ), ), legend_opts=opts.LegendOpts(is_show=False), ) ) return c Page().add(*[fn() for fn, _ in C.charts]).render()Parallel(平行坐标系)
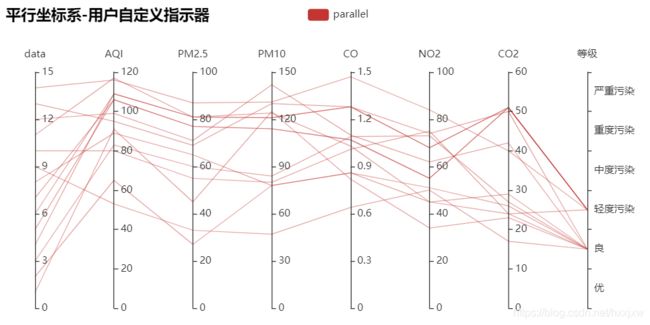
#v0.5
from pyecharts import Parallel

c_schema = [
    {"dim": 0, "name": "data"},
    {"dim": 1, "name": "AQI"},
    {"dim": 2, "name": "PM2.5"},
    {"dim": 3, "name": "PM10"},
    {"dim": 4, "name": "CO"},
    {"dim": 5, "name": "NO2"},
    {"dim": 6, "name": "CO2"},
    {"dim": 7, "name": "等级",
    "type": "category", "data": ['优', '良', '轻度污染', '中度污染', '重度污染', '严重污染']}
]
data = [
    [1, 91, 45, 125, 0.82, 34, 23, "良"],
    [2, 65, 27, 78, 0.86, 45, 29, "良"],
    [3, 83, 60, 84, 1.09, 73, 27, "良"],
    [4, 109, 81, 121, 1.28, 68, 51, "轻度污染"],
    [5, 106, 77, 114, 1.07, 55, 51, "轻度污染"],
    [6, 109, 81, 121, 1.28, 68, 51, "轻度污染"],
    [7, 106, 77, 114, 1.07, 55, 51, "轻度污染"],
    [8, 89, 65, 78, 0.86, 51, 26, "良"],
    [9, 53, 33, 47, 0.64, 50, 17, "良"],
    [10, 80, 55, 80, 1.01, 75, 24, "良"],
    [11, 117, 81, 124, 1.03, 45, 24, "轻度污染"],
    [12, 99, 71, 142, 1.1, 62, 42, "良"],
    [13, 95, 69, 130, 1.28, 74, 50, "良"],
    [14, 116, 87, 131, 1.47, 84, 40, "轻度污染"]
]
parallel = Parallel("平行坐标系-用户自定义指示器")
parallel.config(c_schema=c_schema)
parallel.add("parallel", data)
parallel.show_config()
parallel.render()
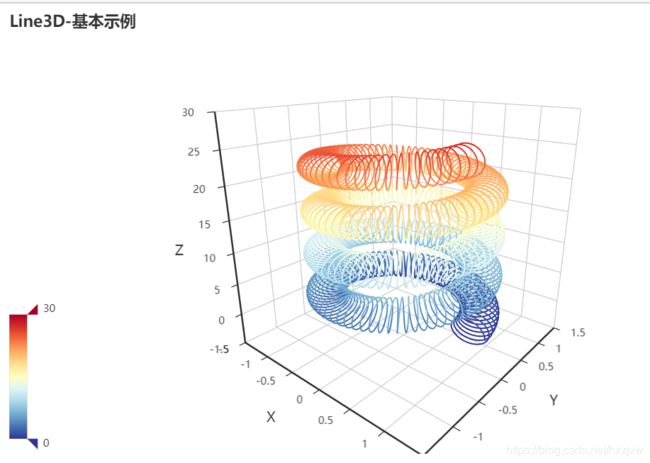
3d折线图
import math

from pyecharts import options as opts
from pyecharts.charts import Line3D, Page
from pyecharts.faker import Collector, Faker

C = Collector()


@C.funcs
def line3d_base() -> Line3D:
    data = []
    for t in range(0, 25000):
        _t = t / 1000
        x = (1 + 0.25 * math.cos(75 * _t)) * math.cos(_t)
        y = (1 + 0.25 * math.cos(75 * _t)) * math.sin(_t)
        z = _t + 2.0 * math.sin(75 * _t)
        data.append([x, y, z])
    c = (
        Line3D()
        .add(
            "",
            data,
            xaxis3d_opts=opts.Axis3DOpts(Faker.clock, type_="value"),
            yaxis3d_opts=opts.Axis3DOpts(Faker.week_en, type_="value"),
            grid3d_opts=opts.Grid3DOpts(width=100, height=100, depth=100),
        )
        .set_global_opts(
            visualmap_opts=opts.VisualMapOpts(
                max_=30, min_=0, range_color=Faker.visual_color
            ),
            title_opts=opts.TitleOpts(title="Line3D-基本示例"),
        )
    )
    return c


@C.funcs
def line3d_auto_rotate() -> Line3D:
    data = []
    for t in range(0, 25000):
        _t = t / 1000
        x = (1 + 0.25 * math.cos(75 * _t)) * math.cos(_t)
        y = (1 + 0.25 * math.cos(75 * _t)) * math.sin(_t)
        z = _t + 2.0 * math.sin(75 * _t)
        data.append([x, y, z])
    c = (
        Line3D()
        .add(
            "",
            data,
            xaxis3d_opts=opts.Axis3DOpts(Faker.clock, type_="value"),
            yaxis3d_opts=opts.Axis3DOpts(Faker.week_en, type_="value"),
            grid3d_opts=opts.Grid3DOpts(
                width=100, depth=100, rotate_speed=150, is_rotate=True
            ),
        )
        .set_global_opts(
            visualmap_opts=opts.VisualMapOpts(
                max_=30, min_=0, range_color=Faker.visual_color
            ),
            title_opts=opts.TitleOpts(title="Line3D-旋转的弹簧"),
        )
    )
    return c


Page().add(*[fn() for fn, _ in C.charts]).render()
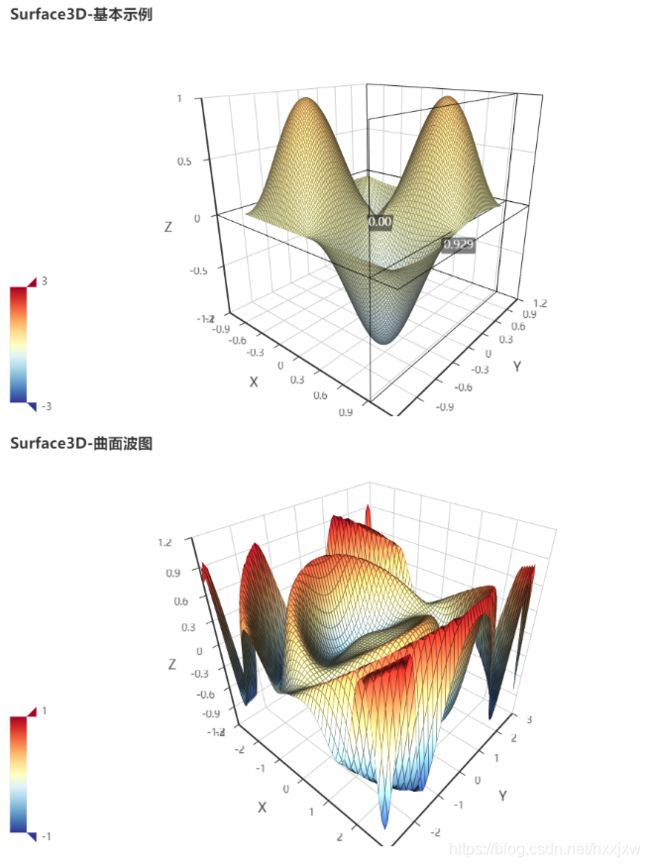
surface3D
#v1

import math

from pyecharts import options as opts
from pyecharts.charts import Page, Surface3D
from pyecharts.faker import Collector, Faker

C = Collector()


@C.funcs
def surface3d_base() -> Surface3D:
    def surface3d_data():
        for t0 in range(-60, 60, 1):
            y = t0 / 60
            for t1 in range(-60, 60, 1):
                x = t1 / 60
                if math.fabs(x) < 0.1 and math.fabs(y) < 0.1:
                    z = "-"
                else:
                    z = math.sin(x * math.pi) * math.sin(y * math.pi)
                yield [x, y, z]

    c = (
        Surface3D()
        .add(
            "",
            list(surface3d_data()),
            xaxis3d_opts=opts.Axis3DOpts(type_="value"),
            yaxis3d_opts=opts.Axis3DOpts(type_="value"),
            grid3d_opts=opts.Grid3DOpts(width=100, height=100, depth=100),
        )
        .set_global_opts(
            title_opts=opts.TitleOpts(title="Surface3D-基本示例"),
            visualmap_opts=opts.VisualMapOpts(
                max_=3, min_=-3, range_color=Faker.visual_color
            ),
        )
    )
    return c


@C.funcs
def surface3D_flower() -> Surface3D:
    def surface3d_data():
        for t0 in range(-30, 30, 1):
            y = t0 / 10
            for t1 in range(-30, 30, 1):
                x = t1 / 10
                z = math.sin(x * x + y * y) * x / 3.14
                yield [x, y, z]

    c = (
        Surface3D()
        .add(
            "",
            list(surface3d_data()),
            xaxis3d_opts=opts.Axis3DOpts(type_="value"),
            yaxis3d_opts=opts.Axis3DOpts(type_="value"),
            grid3d_opts=opts.Grid3DOpts(width=100, height=100, depth=100),
        )
        .set_global_opts(
            title_opts=opts.TitleOpts(title="Surface3D-曲面波图"),
            visualmap_opts=opts.VisualMapOpts(
                max_=1, min_=-1, range_color=Faker.visual_color
            ),
        )
    )
    return c


Page().add(*[fn() for fn, _ in C.charts]).render()
河流图
#v1

from pyecharts import options as opts
from pyecharts.charts import Page, ThemeRiver
from pyecharts.faker import Collector

C = Collector()


@C.funcs
def themeriver_example() -> ThemeRiver:
    data = [
        ["2015/11/08", 10, "DQ"],
        ["2015/11/09", 15, "DQ"],
        ["2015/11/10", 35, "DQ"],
        ["2015/11/14", 7, "DQ"],
        ["2015/11/15", 2, "DQ"],
        ["2015/11/16", 17, "DQ"],
        ["2015/11/17", 33, "DQ"],
        ["2015/11/18", 40, "DQ"],
        ["2015/11/19", 32, "DQ"],
        ["2015/11/20", 26, "DQ"],
        ["2015/11/08", 35, "TY"],
        ["2015/11/09", 36, "TY"],
        ["2015/11/10", 37, "TY"],
        ["2015/11/11", 22, "TY"],
        ["2015/11/12", 24, "TY"],
        ["2015/11/13", 26, "TY"],
        ["2015/11/14", 34, "TY"],
        ["2015/11/15", 21, "TY"],
        ["2015/11/16", 18, "TY"],
        ["2015/11/17", 45, "TY"],
        ["2015/11/18", 32, "TY"],
        ["2015/11/19", 35, "TY"],
        ["2015/11/20", 30, "TY"],
        ["2015/11/08", 21, "SS"],
        ["2015/11/09", 25, "SS"],
        ["2015/11/10", 27, "SS"],
        ["2015/11/11", 23, "SS"],
        ["2015/11/12", 24, "SS"],
        ["2015/11/13", 21, "SS"],
        ["2015/11/14", 35, "SS"],
        ["2015/11/15", 39, "SS"],
        ["2015/11/16", 40, "SS"],
        ["2015/11/17", 36, "SS"],
        ["2015/11/18", 33, "SS"],
        ["2015/11/19", 43, "SS"],
        ["2015/11/20", 40, "SS"],
        ["2015/11/14", 7, "QG"],
        ["2015/11/15", 2, "QG"],
        ["2015/11/16", 17, "QG"],
        ["2015/11/17", 33, "QG"],
        ["2015/11/18", 40, "QG"],
        ["2015/11/19", 32, "QG"],
        ["2015/11/20", 26, "QG"],
        ["2015/11/21", 35, "QG"],
        ["2015/11/22", 40, "QG"],
        ["2015/11/23", 32, "QG"],
        ["2015/11/24", 26, "QG"],
        ["2015/11/25", 22, "QG"],
        ["2015/11/08", 10, "SY"],
        ["2015/11/09", 15, "SY"],
        ["2015/11/10", 35, "SY"],
        ["2015/11/11", 38, "SY"],
        ["2015/11/12", 22, "SY"],
        ["2015/11/13", 16, "SY"],
        ["2015/11/14", 7, "SY"],
        ["2015/11/15", 2, "SY"],
        ["2015/11/16", 17, "SY"],
        ["2015/11/17", 33, "SY"],
        ["2015/11/18", 40, "SY"],
        ["2015/11/19", 32, "SY"],
        ["2015/11/20", 26, "SY"],
        ["2015/11/21", 35, "SY"],
        ["2015/11/22", 4, "SY"],
        ["2015/11/23", 32, "SY"],
        ["2015/11/24", 26, "SY"],
        ["2015/11/25", 22, "SY"],
        ["2015/11/08", 10, "DD"],
        ["2015/11/09", 15, "DD"],
        ["2015/11/10", 35, "DD"],
        ["2015/11/11", 38, "DD"],
        ["2015/11/12", 22, "DD"],
        ["2015/11/13", 16, "DD"],
        ["2015/11/14", 7, "DD"],
        ["2015/11/15", 2, "DD"],
        ["2015/11/16", 17, "DD"],
        ["2015/11/17", 33, "DD"],
        ["2015/11/18", 4, "DD"],
        ["2015/11/19", 32, "DD"],
        ["2015/11/20", 26, "DD"],
    ]
    c = (
        ThemeRiver()
        .add(
            ["DQ", "TY", "SS", "QG", "SY", "DD"],
            data,
            singleaxis_opts=opts.SingleAxisOpts(type_="time", pos_bottom="10%"),
        )
        .set_global_opts(title_opts=opts.TitleOpts(title="ThemeRiver-基本示例"))
    )
    return c


Page().add(*[fn() for fn, _ in C.charts]).render()
树形图
#v1

import json
import os

from pyecharts import options as opts
from pyecharts.charts import Page, Tree
from pyecharts.faker import Collector

C = Collector()


@C.funcs
def tree_base() -> Tree:
    data = [
        {
            "children": [
                {"name": "B"},
                {
                    "children": [
                        {"children": [{"name": "I"}], "name": "E"},
                        {"name": "F"},
                    ],
                    "name": "C",
                },
                {
                    "children": [
                        {"children": [{"name": "J"}, {"name": "K"}], "name": "G"},
                        {"name": "H"},
                    ],
                    "name": "D",
                },
            ],
            "name": "A",
        }
    ]
    c = (
        Tree()
        .add("", data)
        .set_global_opts(title_opts=opts.TitleOpts(title="Tree-基本示例"))
    )
    return c


@C.funcs
def tree_lr() -> Tree:
    with open(os.path.join("fixtures", "flare.json"), "r", encoding="utf-8") as f:
        j = json.load(f)
    c = (
        Tree()
        .add("", [j], collapse_interval=2)
        .set_global_opts(title_opts=opts.TitleOpts(title="Tree-左右方向"))
    )
    return c


@C.funcs
def tree_rl() -> Tree:
    with open(os.path.join("fixtures", "flare.json"), "r", encoding="utf-8") as f:
        j = json.load(f)
    c = (
        Tree()
        .add("", [j], collapse_interval=2, orient="RL")
        .set_global_opts(title_opts=opts.TitleOpts(title="Tree-右左方向"))
    )
    return c


@C.funcs
def tree_tb() -> Tree:
    with open(os.path.join("fixtures", "flare.json"), "r", encoding="utf-8") as f:
        j = json.load(f)
    c = (
        Tree()
        .add(
            "",
            [j],
            collapse_interval=2,
            orient="TB",
            label_opts=opts.LabelOpts(
                position="top",
                horizontal_align="right",
                vertical_align="middle",
                rotate=-90,
            ),
        )
        .set_global_opts(title_opts=opts.TitleOpts(title="Tree-上下方向"))
    )
    return c


@C.funcs
def tree_bt() -> Tree:
    with open(os.path.join("fixtures", "flare.json"), "r", encoding="utf-8") as f:
        j = json.load(f)
    c = (
        Tree()
        .add(
            "",
            [j],
            collapse_interval=2,
            orient="BT",
            label_opts=opts.LabelOpts(
                position="top",
                horizontal_align="right",
                vertical_align="middle",
                rotate=-90,
            ),
        )
        .set_global_opts(title_opts=opts.TitleOpts(title="Tree-下上方向"))
    )
    return c


@C.funcs
def tree_layout() -> Tree:
    with open(os.path.join("fixtures", "flare.json"), "r", encoding="utf-8") as f:
        j = json.load(f)
    c = (
        Tree()
        .add("", [j], collapse_interval=2, layout="radial")
        .set_global_opts(title_opts=opts.TitleOpts(title="Tree-Layout"))
    )
    return c


Page().add(*[fn() for fn, _ in C.charts]).render()
TreeMap
#v1

import json
import os

from pyecharts import options as opts
from pyecharts.charts import Page, TreeMap
from pyecharts.faker import Collector

C = Collector()


@C.funcs
def treemap_base() -> TreeMap:
    data = [
        {"value": 40, "name": "我是A"},
        {
            "value": 180,
            "name": "我是B",
            "children": [
                {
                    "value": 76,
                    "name": "我是B.children",
                    "children": [
                        {"value": 12, "name": "我是B.children.a"},
                        {"value": 28, "name": "我是B.children.b"},
                        {"value": 20, "name": "我是B.children.c"},
                        {"value": 16, "name": "我是B.children.d"},
                    ],
                }
            ],
        },
    ]

    c = (
        TreeMap()
        .add("演示数据", data)
        .set_global_opts(title_opts=opts.TitleOpts(title="TreeMap-基本示例"))
    )
    return c


@C.funcs
def treemap_official():
    with open(os.path.join("fixtures", "treemap.json"), "r", encoding="utf-8") as f:
        data = json.load(f)
    c = (
        TreeMap()
        .add("演示数据", data)
        .set_global_opts(title_opts=opts.TitleOpts(title="TreeMap-官方示例"))
    )
    return c


Page().add(*[fn() for fn, _ in C.charts]).render()
条形图
#v0.5
from pyecharts import Bar

bar = Bar('设置堆叠效果')

attr = ["衬衫", "羊毛衫", "雪纺衫", "裤子", "高跟鞋", "袜子"]
v1 = [5, 20, 36, 10, 75, 90]
v2 = [10, 25, 8, 60, 20, 80]

bar.add('商家A', attr, v1, is_stack=True)
bar.add("商家B", attr, v2, is_stack=True)
bar.render()
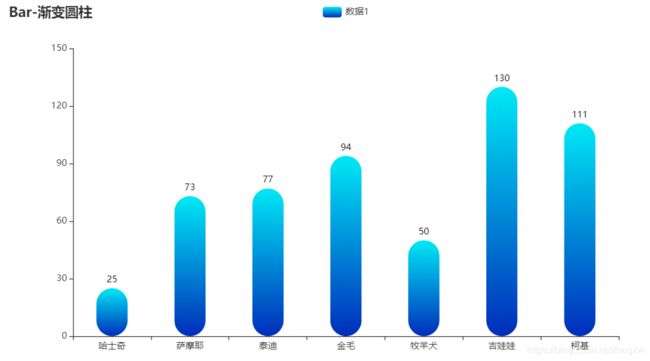
#v0.5 from pyecharts import Bar #configure(output_image=True) bar = Bar('各个城市的人口','虚构的',background_color = 'white',title_text_size = 25,subtitle_text_size = 15) attr = ['惠州','东莞','广州','深圳','佛山','江门','珠海'] v1 = [23,45,68,58,32,28,36] v2 = [12,22,34,29,16,14,18] bar.add('举例数字1',attr,v1,is_label_show = True,mark_point = ['min','max'], mark_point_symbol = 'diamond',xaxis_rotate = 30,xaxis_label_textsize = 15,yaxis_label_textsize = 15) bar.add('举例数字2',attr,v2,is_label_show = True,mark_point = ['min','max'], mark_point_symbol = 'triangle',xaxis_rotate = 30,xaxis_label_textsize = 15,yaxis_label_textsize = 15) bar.render()#v1 from pyecharts.commons.utils import JsCode # 导入js代码库,可以调用一些js方法 from pyecharts.faker import Faker from pyecharts import options as opts from pyecharts.charts import Bar, Grid # 导入网格库 from pyecharts.globals import ThemeType # 导入主题库 # 例2 渐变圆柱 bar2=( Bar() .add_xaxis(Faker.choose()) .add_yaxis("数据1",Faker.values(),category_gap="60%") # category_gap是同一系列的柱间距离,默认为类目间距的 20%,可设固定值 .set_series_opts(itemstyle_opts={# set_series_opts设置系列配置 "normal":{ # normal代表一般、正常情况 # LinearGradient 设置线性渐变,offset为0是柱子0%处颜色,为1是100%处颜色 "color": JsCode("""new echarts.graphic.LinearGradient(0, 0, 0, 1, [{ offset: 0, color: 'rgba(0, 233, 245, 1)' }, { offset: 1, color: 'rgba(0, 45, 187, 1)' }], false)"""), "barBorderRadius": [30, 30, 30, 30],# 设置柱子4个角为30变成圆柱 "shadowColor": 'red',# 阴影颜色 }}) .set_global_opts(title_opts=opts.TitleOpts(title="Bar-渐变圆柱")) ) bar2.render()注意是v1版本
#v1

from pyecharts.commons.utils import JsCode # 导入js代码库,可以调用一些js方法
from pyecharts.faker import Faker
from pyecharts import options as opts
from pyecharts.charts import Bar, Grid # 导入网格库
from pyecharts.globals import ThemeType # 导入主题库


# 例4 背景图基本示例
bar4=(
        Bar(
            init_opts=opts.InitOpts(
                bg_color={
                    "type":"pattern",
                    "image":JsCode("img"),
                    "repeat":"no-repeat",
                }# bg_color是设置背景颜色,这里image是设置图片背景,repeat设置no-repeat不重复
            )
        )
        .add_xaxis(Faker.choose())
        .add_yaxis("数据1",Faker.values())
        .add_yaxis("数据2",Faker.values())
        .set_global_opts(
            title_opts=opts.TitleOpts(
                title="Bar-背景图基本示例",
                subtitle="副标题",
                title_textstyle_opts=opts.TextStyleOpts(color='red'),
            )
        )
    )
# 这里添加图片src连接,也可以换其他图片的网址
bar4.add_js_funcs(
        '''
        var img=new Image();img.src='https://timgsa.baidu.com/timg?image&quality=80&size=b9999_10000&sec=1571897969384&di=e417611ecd20f69eee6c549ef44e357e&imgtype=0&src=http%3A%2F%2Fimg8.zol.com.cn%2Fbbs%2Fupload%2F18863%2F18862812.JPG';
        '''
    )
bar4.render()
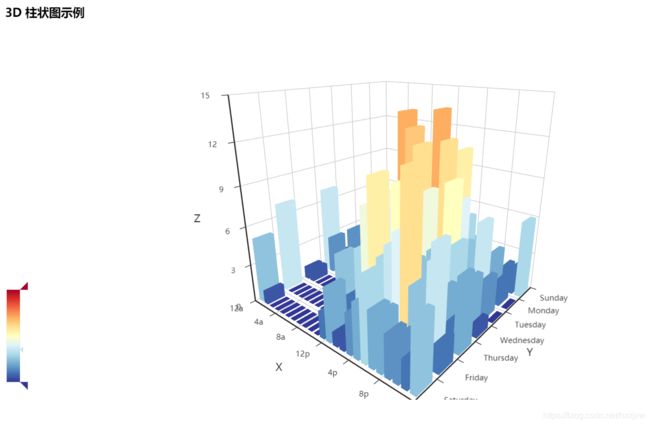
3D柱状图
blog.csdn.net/HHG20171226/article/details/103113923
#v0.5
from pyecharts import Bar3D

bar3d = Bar3D("3D 柱状图示例", width=1200, height=600)
x_axis = [
    "12a", "1a", "2a", "3a", "4a", "5a", "6a", "7a", "8a", "9a", "10a", "11a",
    "12p", "1p", "2p", "3p", "4p", "5p", "6p", "7p", "8p", "9p", "10p", "11p"
    ]
y_axis = [
    "Saturday", "Friday", "Thursday", "Wednesday", "Tuesday", "Monday", "Sunday"
    ]
data = [
    [0, 0, 5], [0, 1, 1], [0, 2, 0], [0, 3, 0], [0, 4, 0], [0, 5, 0],
    [0, 6, 0], [0, 7, 0], [0, 8, 0], [0, 9, 0], [0, 10, 0], [0, 11, 2],
    [0, 12, 4], [0, 13, 1], [0, 14, 1], [0, 15, 3], [0, 16, 4], [0, 17, 6],
    [0, 18, 4], [0, 19, 4], [0, 20, 3], [0, 21, 3], [0, 22, 2], [0, 23, 5],
    [1, 0, 7], [1, 1, 0], [1, 2, 0], [1, 3, 0], [1, 4, 0], [1, 5, 0],
    [1, 6, 0], [1, 7, 0], [1, 8, 0], [1, 9, 0], [1, 10, 5], [1, 11, 2],
    [1, 12, 2], [1, 13, 6], [1, 14, 9], [1, 15, 11], [1, 16, 6], [1, 17, 7],
    [1, 18, 8], [1, 19, 12], [1, 20, 5], [1, 21, 5], [1, 22, 7], [1, 23, 2],
    [2, 0, 1], [2, 1, 1], [2, 2, 0], [2, 3, 0], [2, 4, 0], [2, 5, 0],
    [2, 6, 0], [2, 7, 0], [2, 8, 0], [2, 9, 0], [2, 10, 3], [2, 11, 2],
    [2, 12, 1], [2, 13, 9], [2, 14, 8], [2, 15, 10], [2, 16, 6], [2, 17, 5],
    [2, 18, 5], [2, 19, 5], [2, 20, 7], [2, 21, 4], [2, 22, 2], [2, 23, 4],
    [3, 0, 7], [3, 1, 3], [3, 2, 0], [3, 3, 0], [3, 4, 0], [3, 5, 0],
    [3, 6, 0], [3, 7, 0], [3, 8, 1], [3, 9, 0], [3, 10, 5], [3, 11, 4],
    [3, 12, 7], [3, 13, 14], [3, 14, 13], [3, 15, 12], [3, 16, 9], [3, 17, 5],
    [3, 18, 5], [3, 19, 10], [3, 20, 6], [3, 21, 4], [3, 22, 4], [3, 23, 1],
    [4, 0, 1], [4, 1, 3], [4, 2, 0], [4, 3, 0], [4, 4, 0], [4, 5, 1],
    [4, 6, 0], [4, 7, 0], [4, 8, 0], [4, 9, 2], [4, 10, 4], [4, 11, 4],
    [4, 12, 2], [4, 13, 4], [4, 14, 4], [4, 15, 14], [4, 16, 12], [4, 17, 1],
    [4, 18, 8], [4, 19, 5], [4, 20, 3], [4, 21, 7], [4, 22, 3], [4, 23, 0],
    [5, 0, 2], [5, 1, 1], [5, 2, 0], [5, 3, 3], [5, 4, 0], [5, 5, 0],
    [5, 6, 0], [5, 7, 0], [5, 8, 2], [5, 9, 0], [5, 10, 4], [5, 11, 1],
    [5, 12, 5], [5, 13, 10], [5, 14, 5], [5, 15, 7], [5, 16, 11], [5, 17, 6],
    [5, 18, 0], [5, 19, 5], [5, 20, 3], [5, 21, 4], [5, 22, 2], [5, 23, 0],
    [6, 0, 1], [6, 1, 0], [6, 2, 0], [6, 3, 0], [6, 4, 0], [6, 5, 0],
    [6, 6, 0], [6, 7, 0], [6, 8, 0], [6, 9, 0], [6, 10, 1], [6, 11, 0],
    [6, 12, 2], [6, 13, 1], [6, 14, 3], [6, 15, 4], [6, 16, 0], [6, 17, 0],
    [6, 18, 0], [6, 19, 0], [6, 20, 1], [6, 21, 2], [6, 22, 2], [6, 23, 6]
    ]
range_color = ['#313695', '#4575b4', '#74add1', '#abd9e9', '#e0f3f8', '#ffffbf',
               '#fee090', '#fdae61', '#f46d43', '#d73027', '#a50026']
bar3d.add(
    "",
    x_axis,
    y_axis,
    [[d[1], d[0], d[2]] for d in data],
    is_visualmap=True,
    visual_range=[0, 20],
    visual_range_color=range_color,
    grid3d_width=200,
    grid3d_depth=80,
)
bar3d.render()
拖动鼠标还可以转动坐标轴
桑基图
#v1
import json
import os

from pyecharts import options as opts
from pyecharts.charts import Page, Sankey
from pyecharts.faker import Collector

C = Collector()


@C.funcs
def sankey_base() -> Sankey:
    nodes = [
        {"name": "category1"},
        {"name": "category2"},
        {"name": "category3"},
        {"name": "category4"},
        {"name": "category5"},
        {"name": "category6"},
    ]

    links = [
        {"source": "category1", "target": "category2", "value": 10},
        {"source": "category2", "target": "category3", "value": 15},
        {"source": "category3", "target": "category4", "value": 20},
        {"source": "category5", "target": "category6", "value": 25},
    ]
    c = (
        Sankey()
        .add(
            "sankey",
            nodes,
            links,
            linestyle_opt=opts.LineStyleOpts(opacity=0.2, curve=0.5, color="source"),
            label_opts=opts.LabelOpts(position="right"),
        )
        .set_global_opts(title_opts=opts.TitleOpts(title="Sankey-基本示例"))
    )
    return c


@C.funcs
def sankey_offical() -> Sankey:
    with open(os.path.join("fixtures", "energy.json"), "r", encoding="utf-8") as f:
        j = json.load(f)
    c = (
        Sankey()
        .add(
            "sankey",
            nodes=j["nodes"],
            links=j["links"],
            linestyle_opt=opts.LineStyleOpts(opacity=0.2, curve=0.5, color="source"),
            label_opts=opts.LabelOpts(position="right"),
        )
        .set_global_opts(title_opts=opts.TitleOpts(title="Sankey-官方示例"))
    )
    return c


@C.funcs
def sankey_vertical() -> Sankey:
    colors = [
        "#67001f",
        "#b2182b",
        "#d6604d",
        "#f4a582",
        "#fddbc7",
        "#d1e5f0",
        "#92c5de",
        "#4393c3",
        "#2166ac",
        "#053061",
    ]
    nodes = [
        {"name": "a"},
        {"name": "b"},
        {"name": "a1"},
        {"name": "b1"},
        {"name": "c"},
        {"name": "e"},
    ]
    links = [
        {"source": "a", "target": "a1", "value": 5},
        {"source": "e", "target": "b", "value": 3},
        {"source": "a", "target": "b1", "value": 3},
        {"source": "b1", "target": "a1", "value": 1},
        {"source": "b1", "target": "c", "value": 2},
        {"source": "b", "target": "c", "value": 1},
    ]
    c = (
        Sankey()
        .set_colors(colors)
        .add(
            "sankey",
            nodes=nodes,
            links=links,
            pos_bottom="10%",
            focus_node_adjacency="allEdges",
            orient="vertical",
            linestyle_opt=opts.LineStyleOpts(opacity=0.2, curve=0.5, color="source"),
            label_opts=opts.LabelOpts(position="top"),
        )
        .set_global_opts(
            title_opts=opts.TitleOpts(title="Sankey-Vertical"),
            tooltip_opts=opts.TooltipOpts(trigger="item", trigger_on="mousemove"),
        )
    )
    return c


@C.funcs
def sankey_with_level_setting() -> Sankey:
    with open(os.path.join("fixtures", "product.json"), "r", encoding="utf-8") as f:
        j = json.load(f)
    c = (
        Sankey()
        .add(
            "sankey",
            nodes=j["nodes"],
            links=j["links"],
            pos_top="10%",
            focus_node_adjacency=True,
            levels=[
                opts.SankeyLevelsOpts(
                    depth=0,
                    itemstyle_opts=opts.ItemStyleOpts(color="#fbb4ae"),
                    linestyle_opts=opts.LineStyleOpts(color="source", opacity=0.6),
                ),
                opts.SankeyLevelsOpts(
                    depth=1,
                    itemstyle_opts=opts.ItemStyleOpts(color="#b3cde3"),
                    linestyle_opts=opts.LineStyleOpts(color="source", opacity=0.6),
                ),
                opts.SankeyLevelsOpts(
                    depth=2,
                    itemstyle_opts=opts.ItemStyleOpts(color="#ccebc5"),
                    linestyle_opts=opts.LineStyleOpts(color="source", opacity=0.6),
                ),
                opts.SankeyLevelsOpts(
                    depth=3,
                    itemstyle_opts=opts.ItemStyleOpts(color="#decbe4"),
                    linestyle_opts=opts.LineStyleOpts(color="source", opacity=0.6),
                ),
            ],
            linestyle_opt=opts.LineStyleOpts(curve=0.5),
        )
        .set_global_opts(
            title_opts=opts.TitleOpts(title="Sankey-Level Settings"),
            tooltip_opts=opts.TooltipOpts(trigger="item", trigger_on="mousemove"),
        )
    )
    return c


Page().add(*[fn() for fn, _ in C.charts]).render()
3D散点图
#v1

import random

from pyecharts import options as opts
from pyecharts.charts import Page, Scatter3D
from pyecharts.faker import Collector, Faker

C = Collector()


@C.funcs
def scatter3d_base() -> Scatter3D:
    data = [
        [random.randint(0, 100), random.randint(0, 100), random.randint(0, 100)]
        for _ in range(80)
    ]
    c = (
        Scatter3D()
        .add("", data)
        .set_global_opts(
            title_opts=opts.TitleOpts("Scatter3D-基本示例"),
            visualmap_opts=opts.VisualMapOpts(range_color=Faker.visual_color),
        )
    )
    return c


@C.funcs
def scatter3d_muti_visualmap_channel():
    data = [
        [random.randint(0, 100), random.randint(0, 100), random.randint(0, 100)]
        for _ in range(80)
    ]
    c = (
        Scatter3D()
        .add("", data)
        .set_global_opts(
            title_opts=opts.TitleOpts("Scatter3D-多视觉映射通道"),
            visualmap_opts=[
                opts.VisualMapOpts(range_color=Faker.visual_color),
                opts.VisualMapOpts(type_="size", range_size=[10, 50], pos_top="20%"),
            ],
        )
    )
    return c


Page().add(*[fn() for fn, _ in C.charts]).render()
旭日图
#v1

import json
import os

from pyecharts import options as opts
from pyecharts.charts import Page, Sunburst
from pyecharts.faker import Collector

C = Collector()


@C.funcs
def sunburst_base() -> Sunburst:
    data = [
        opts.SunburstItem(
            name="Grandpa",
            children=[
                opts.SunburstItem(
                    name="Uncle Leo",
                    value=15,
                    children=[
                        opts.SunburstItem(name="Cousin Jack", value=2),
                        opts.SunburstItem(
                            name="Cousin Mary",
                            value=5,
                            children=[opts.SunburstItem(name="Jackson", value=2)],
                        ),
                        opts.SunburstItem(name="Cousin Ben", value=4),
                    ],
                ),
                opts.SunburstItem(
                    name="Father",
                    value=10,
                    children=[
                        opts.SunburstItem(name="Me", value=5),
                        opts.SunburstItem(name="Brother Peter", value=1),
                    ],
                ),
            ],
        ),
        opts.SunburstItem(
            name="Nancy",
            children=[
                opts.SunburstItem(
                    name="Uncle Nike",
                    children=[
                        opts.SunburstItem(name="Cousin Betty", value=1),
                        opts.SunburstItem(name="Cousin Jenny", value=2),
                    ],
                )
            ],
        ),
    ]

    c = (
        Sunburst(init_opts=opts.InitOpts(width="1000px", height="600px"))
        .add(series_name="", data_pair=data, radius=[0, "90%"])
        .set_global_opts(title_opts=opts.TitleOpts(title="Sunburst-基本示例"))
        .set_series_opts(label_opts=opts.LabelOpts(formatter="{b}"))
    )
    return c


@C.funcs
def sunburst_official() -> Sunburst:
    with open(os.path.join("fixtures", "drink.json"), "r", encoding="utf-8") as f:
        j = json.load(f)

    c = (
        Sunburst(init_opts=opts.InitOpts(width="1000px", height="600px"))
        .add(
            "",
            data_pair=j,
            highlight_policy="ancestor",
            radius=[0, "95%"],
            sort_="null",
            levels=[
                {},
                {
                    "r0": "15%",
                    "r": "35%",
                    "itemStyle": {"borderWidth": 2},
                    "label": {"rotate": "tangential"},
                },
                {"r0": "35%", "r": "70%", "label": {"align": "right"}},
                {
                    "r0": "70%",
                    "r": "72%",
                    "label": {"position": "outside", "padding": 3, "silent": False},
                    "itemStyle": {"borderWidth": 3},
                },
            ],
        )
        .set_global_opts(title_opts=opts.TitleOpts(title="Sunburst-官方示例"))
        .set_series_opts(label_opts=opts.LabelOpts(formatter="{b}"))
    )
    return c


Page().add(*[fn() for fn, _ in C.charts]).render()
Geo(地理坐标系)
#v0.5
from pyecharts import Geo

data = [
    ("海门", 90),("鄂尔多斯", 150),("招远", 12),("舟山", 122),("齐齐哈尔", 14),("盐城", 15),
    ("赤峰", 16),("青岛", 18),("乳山", 180),("金昌", 19),("泉州", 21),("莱西", 21),
    ("日照", 21),("胶南", 220),("南通", 23),("拉萨", 100),("云浮", 24),("梅州", 25)]
geo = Geo("全国主要城市空气质量", "data from pm2.5", title_color="#fff", title_pos="center",
width=1200, height=600, background_color='#404a59')
attr, value = geo.cast(data)
geo.add("", attr, value, visual_range=[0, 200], visual_text_color="#fff", symbol_size=15, is_visualmap=True)
geo.show_config()
geo.render()
左下角可以上下拖动
#v0.5
from pyecharts import Geo

data = [("海门", 9), ("鄂尔多斯", 12), ("招远", 12), ("舟山", 12), ("齐齐哈尔", 14), ("盐城", 15)]
geo = Geo("全国主要城市空气质量", "data from pm2.5", title_color="#fff", title_pos="center",
          width=1200, height=600, background_color='#404a59')
attr, value = geo.cast(data)
geo.add("", attr, value, type="effectScatter", is_random=True, effect_scale=5)
geo.show_config()
geo.render()
#v1 from pyecharts import options as opts from pyecharts.charts import Geo, Page from pyecharts.faker import Collector, Faker from pyecharts.globals import ChartType, SymbolType C = Collector() @C.funcs def geo_base() -> Geo: c = ( Geo() .add_schema(maptype="china") .add("geo", [list(z) for z in zip(Faker.provinces, Faker.values())]) .set_series_opts(label_opts=opts.LabelOpts(is_show=False)) .set_global_opts( visualmap_opts=opts.VisualMapOpts(), title_opts=opts.TitleOpts(title="Geo-基本示例"), ) ) return c @C.funcs def geo_visualmap_piecewise() -> Geo: c = ( Geo() .add_schema(maptype="china") .add("geo", [list(z) for z in zip(Faker.provinces, Faker.values())]) .set_series_opts(label_opts=opts.LabelOpts(is_show=False)) .set_global_opts( visualmap_opts=opts.VisualMapOpts(is_piecewise=True), title_opts=opts.TitleOpts(title="Geo-VisualMap(分段型)"), ) ) return c @C.funcs def geo_effectscatter() -> Geo: c = ( Geo() .add_schema(maptype="china") .add( "geo", [list(z) for z in zip(Faker.provinces, Faker.values())], type_=ChartType.EFFECT_SCATTER, ) .set_series_opts(label_opts=opts.LabelOpts(is_show=False)) .set_global_opts(title_opts=opts.TitleOpts(title="Geo-EffectScatter")) ) return c @C.funcs def geo_heatmap() -> Geo: c = ( Geo() .add_schema(maptype="china") .add( "geo", [list(z) for z in zip(Faker.provinces, Faker.values())], type_=ChartType.HEATMAP, ) .set_series_opts(label_opts=opts.LabelOpts(is_show=False)) .set_global_opts( visualmap_opts=opts.VisualMapOpts(), title_opts=opts.TitleOpts(title="Geo-HeatMap"), ) ) return c @C.funcs def geo_guangdong() -> Geo: c = ( Geo() .add_schema(maptype="广东") .add( "geo", [list(z) for z in zip(Faker.guangdong_city, Faker.values())], type_=ChartType.HEATMAP, ) .set_series_opts(label_opts=opts.LabelOpts(is_show=False)) .set_global_opts( visualmap_opts=opts.VisualMapOpts(), title_opts=opts.TitleOpts(title="Geo-广东地图"), ) ) return c @C.funcs def geo_lines() -> Geo: c = ( Geo() .add_schema(maptype="china") .add( "", [("广州", 55), ("北京", 66), ("杭州", 77), ("重庆", 88)], type_=ChartType.EFFECT_SCATTER, color="white", ) .add( "geo", [("广州", "上海"), ("广州", "北京"), ("广州", "杭州"), ("广州", "重庆")], type_=ChartType.LINES, effect_opts=opts.EffectOpts( symbol=SymbolType.ARROW, symbol_size=6, color="blue" ), linestyle_opts=opts.LineStyleOpts(curve=0.2), ) .set_series_opts(label_opts=opts.LabelOpts(is_show=False)) .set_global_opts(title_opts=opts.TitleOpts(title="Geo-Lines")) ) return c @C.funcs def geo_lines_background() -> Geo: c = ( Geo() .add_schema( maptype="china", itemstyle_opts=opts.ItemStyleOpts(color="#323c48", border_color="#111"), ) .add( "", [("广州", 55), ("北京", 66), ("杭州", 77), ("重庆", 88)], type_=ChartType.EFFECT_SCATTER, color="white", ) .add( "geo", [("广州", "上海"), ("广州", "北京"), ("广州", "杭州"), ("广州", "重庆")], type_=ChartType.LINES, effect_opts=opts.EffectOpts( symbol=SymbolType.ARROW, symbol_size=6, color="blue" ), linestyle_opts=opts.LineStyleOpts(curve=0.2), ) .set_series_opts(label_opts=opts.LabelOpts(is_show=False)) .set_global_opts(title_opts=opts.TitleOpts(title="Geo-Lines-background")) ) return c Page().add(*[fn() for fn, _ in C.charts]).render()
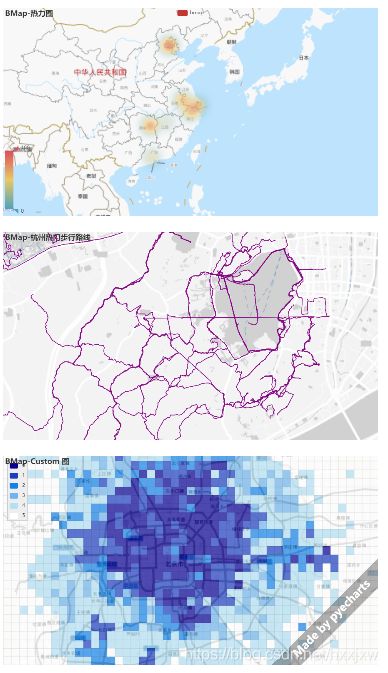
#v1 import json import os from pyecharts import options as opts from pyecharts.charts import BMap, Page from pyecharts.commons.utils import JsCode from pyecharts.faker import Collector, Faker from pyecharts.globals import BMapType, ChartType C = Collector() BAIDU_MAP_AK = os.environ.get("BAIDU_MAP_AK", "FAKE_AK") @C.funcs def bmap_base() -> BMap: c = ( BMap() .add_schema(baidu_ak=BAIDU_MAP_AK, center=[120.13066322374, 30.240018034923]) .add( "bmap", [list(z) for z in zip(Faker.provinces, Faker.values())], label_opts=opts.LabelOpts(formatter="{b}"), ) .set_global_opts(title_opts=opts.TitleOpts(title="BMap-基本示例")) ) return c @C.funcs def bmap_heatmap() -> BMap: c = ( BMap() .add_schema(baidu_ak=BAIDU_MAP_AK, center=[120.13066322374, 30.240018034923]) .add( "bmap", [list(z) for z in zip(Faker.provinces, Faker.values())], type_="heatmap", label_opts=opts.LabelOpts(formatter="{b}"), ) .set_global_opts( title_opts=opts.TitleOpts(title="BMap-热力图"), visualmap_opts=opts.VisualMapOpts(), ) ) return c @C.funcs def bmap_lines() -> BMap: with open( os.path.join("fixtures", "hangzhou-tracks.json"), "r", encoding="utf-8" ) as f: j = json.load(f) c = ( BMap() .add_schema( baidu_ak=BAIDU_MAP_AK, center=[120.13066322374, 30.240018034923], zoom=14, is_roam=True, map_style={ "styleJson": [ { "featureType": "water", "elementType": "all", "stylers": {"color": "#d1d1d1"}, }, { "featureType": "land", "elementType": "all", "stylers": {"color": "#f3f3f3"}, }, { "featureType": "railway", "elementType": "all", "stylers": {"visibility": "off"}, }, { "featureType": "highway", "elementType": "all", "stylers": {"color": "#fdfdfd"}, }, { "featureType": "highway", "elementType": "labels", "stylers": {"visibility": "off"}, }, { "featureType": "arterial", "elementType": "geometry", "stylers": {"color": "#fefefe"}, }, { "featureType": "arterial", "elementType": "geometry.fill", "stylers": {"color": "#fefefe"}, }, { "featureType": "poi", "elementType": "all", "stylers": {"visibility": "off"}, }, { "featureType": "green", "elementType": "all", "stylers": {"visibility": "off"}, }, { "featureType": "subway", "elementType": "all", "stylers": {"visibility": "off"}, }, { "featureType": "manmade", "elementType": "all", "stylers": {"color": "#d1d1d1"}, }, { "featureType": "local", "elementType": "all", "stylers": {"color": "#d1d1d1"}, }, { "featureType": "arterial", "elementType": "labels", "stylers": {"visibility": "off"}, }, { "featureType": "boundary", "elementType": "all", "stylers": {"color": "#fefefe"}, }, { "featureType": "building", "elementType": "all", "stylers": {"color": "#d1d1d1"}, }, { "featureType": "label", "elementType": "labels.text.fill", "stylers": {"color": "#999999"}, }, ] }, ) .add( "", type_="lines", data_pair=j, is_polyline=True, is_large=True, linestyle_opts=opts.LineStyleOpts(color="purple", opacity=0.6, width=1), ) .add_control_panel( maptype_control_opts=opts.BMapTypeControlOpts( type_=BMapType.MAPTYPE_CONTROL_DROPDOWN ), scale_control_opts=opts.BMapScaleControlOpts(), overview_map_opts=opts.BMapOverviewMapControlOpts(is_open=True), ) .set_global_opts(title_opts=opts.TitleOpts(title="BMap-杭州热门步行路线")) ) return c @C.funcs def bmap_custom() -> BMap: with open( os.path.join("fixtures", "bmap-custom-data.json"), "r", encoding="utf-8" ) as f: j = json.load(f) color_list = ["#070093", "#1c3fbf", "#1482e5", "#70b4eb", "#b4e0f3", "#ffffff"] c = ( BMap() .add_schema( baidu_ak=BAIDU_MAP_AK, center=[116.46, 39.92], zoom=11.8, is_roam=True, map_style={ "styleJson": [ { "featureType": "water", "elementType": "all", "stylers": {"color": "#d1d1d1"}, }, { "featureType": "land", "elementType": "all", "stylers": {"color": "#f3f3f3"}, }, { "featureType": "railway", "elementType": "all", "stylers": {"visibility": "off"}, }, { "featureType": "highway", "elementType": "all", "stylers": {"color": "#999999"}, }, { "featureType": "highway", "elementType": "labels", "stylers": {"visibility": "off"}, }, { "featureType": "arterial", "elementType": "geometry", "stylers": {"color": "#fefefe"}, }, { "featureType": "arterial", "elementType": "geometry.fill", "stylers": {"color": "#fefefe"}, }, { "featureType": "poi", "elementType": "all", "stylers": {"visibility": "off"}, }, { "featureType": "green", "elementType": "all", "stylers": {"visibility": "off"}, }, { "featureType": "subway", "elementType": "all", "stylers": {"visibility": "off"}, }, { "featureType": "manmade", "elementType": "all", "stylers": {"color": "#d1d1d1"}, }, { "featureType": "local", "elementType": "all", "stylers": {"color": "#d1d1d1"}, }, { "featureType": "arterial", "elementType": "labels", "stylers": {"visibility": "off"}, }, { "featureType": "boundary", "elementType": "all", "stylers": {"color": "#fefefe"}, }, { "featureType": "building", "elementType": "all", "stylers": {"color": "#d1d1d1"}, }, { "featureType": "label", "elementType": "labels.text.fill", "stylers": {"color": "rgba(0,0,0,0)"}, }, ] }, ) .add_js_funcs( """ var lngExtent = [39.5, 40.6]; var latExtent = [115.9, 116.8]; var cellCount = [50, 50]; var cellSizeCoord = [ (lngExtent[1] - lngExtent[0]) / cellCount[0], (latExtent[1] - latExtent[0]) / cellCount[1] ]; var gapSize = 0; function renderItem(params, api) { var lngIndex = api.value(0); var latIndex = api.value(1); var pointLeftTop = getCoord(params, api, lngIndex, latIndex); var pointRightBottom = getCoord(params, api, lngIndex + 1, latIndex + 1); return { type: 'rect', shape: { x: pointLeftTop[0], y: pointLeftTop[1], width: pointRightBottom[0] - pointLeftTop[0], height: pointRightBottom[1] - pointLeftTop[1] }, style: api.style({ stroke: 'rgba(0,0,0,0.1)' }), styleEmphasis: api.styleEmphasis() }; } function getCoord(params, api, lngIndex, latIndex) { var coords = params.context.coords || (params.context.coords = []); var key = lngIndex + '-' + latIndex; return coords[key] || (coords[key] = api.coord([ +(latExtent[0] + lngIndex * cellSizeCoord[0]).toFixed(6), +(lngExtent[0] + latIndex * cellSizeCoord[1]).toFixed(6) ])); } """ ) .add( series_name="", data_pair=j["data"], type_=ChartType.CUSTOM, render_item=JsCode("renderItem"), itemstyle_opts=opts.ItemStyleOpts(color="yellow"), encode={"tooltip": 2}, ) .set_global_opts( title_opts=opts.TitleOpts(title="BMap-Custom 图"), tooltip_opts=opts.TooltipOpts(is_show=True, formatter=None), visualmap_opts=opts.VisualMapOpts( is_piecewise=True, pos_top="10", pos_left="10", is_inverse=True, pieces=[ {"value": i, "color": color_list[i]} for i in range(len(color_list)) ], dimension=2, border_color="#ccc", border_width=2, background_color="#eee", range_opacity=0.7, ), graphic_opts=[ opts.GraphicGroup( graphic_item=opts.GraphicItem( rotation=JsCode("Math.PI / 4"), bounding="raw", right=110, bottom=110, z=100, ), children=[ opts.GraphicRect( graphic_item=opts.GraphicItem( left="center", top="center", z=100 ), graphic_shape_opts=opts.GraphicShapeOpts( width=400, height=50 ), graphic_basicstyle_opts=opts.GraphicBasicStyleOpts( fill="rgba(0,0,0,0.3)" ), ), opts.GraphicText( graphic_item=opts.GraphicItem( left="center", top="center", z=100 ), graphic_textstyle_opts=opts.GraphicTextStyleOpts( text="Made by pyecharts", font="bold 26px Microsoft YaHei", graphic_basicstyle_opts=opts.GraphicBasicStyleOpts( fill="#fff" ), ), ), ], ) ], ) ) return c Page().add(*[fn() for fn, _ in C.charts]).render()地图热力图
#v0.5
from pyecharts import Map

value = [155, 10, 66, 78, 33, 80, 190, 53, 49.6]
attr = ["福建", "山东", "北京", "上海", "甘肃", "新疆", "河南", "广西", "西藏"]
map = Map("Map 结合 VisualMap 示例", width=1200, height=600)
map.add("", attr, value, maptype='china', is_visualmap=True, visual_text_color='#000')
map.show_config()
map.render()
左下角可以上下拖动
#v0.5
from pyecharts import Geo,Map

value = [95.1, 23.2, 43.3, 66.4, 88.5]
attr= ["China", "Canada", "Brazil", "Russia", "United States"]
map = Map("世界地图示例", width=1200, height=600)
map.add("", attr, value, maptype="world", is_visualmap=True, visual_text_color='#000')
map.render()
广东地图
#v0.5
from pyecharts import Map

value = [20, 190, 253, 77, 65]
attr = ['汕头市', '汕尾市', '揭阳市', '阳江市', '肇庆市']
map = Map("广东地图示例", width=1200, height=600)
map.add("", attr, value, maptype='广东', is_visualmap=True, visual_text_color='#000')
map.show_config()
map.render()
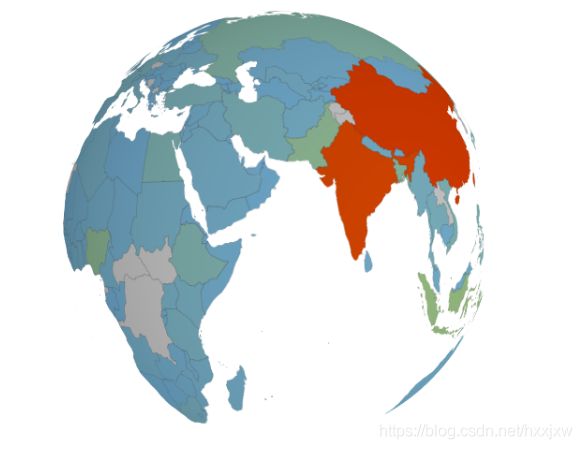
#v1 import pyecharts.options as opts from pyecharts.charts import MapGlobe from pyecharts.faker import POPULATION def map_globe_base(): data = [x for _, x in POPULATION[1:]] low, high = min(data), max(data) mg = ( MapGlobe() .add_schema() .add( maptype="world", series_name="World Population", data_pair=POPULATION[1:], is_map_symbol_show=False, label_opts=opts.LabelOpts(is_show=False), ) .set_global_opts( visualmap_opts=opts.VisualMapOpts( min_=low, max_=high, range_text=["max", "min"], is_calculable=True, range_color=["lightskyblue", "yellow", "orangered"], ) ) ) mg.render() map_globe_base()能旋转
#v1

from pyecharts import options as opts
from pyecharts.charts import Map3D, Page
from pyecharts.faker import Collector
from pyecharts.globals import ChartType
from pyecharts.commons.utils import JsCode

C = Collector()


@C.funcs
def map3d_china_base() -> Map3D:
    c = (
        Map3D()
        .add_schema(
            itemstyle_opts=opts.ItemStyleOpts(
                color="rgb(5,101,123)",
                opacity=1,
                border_width=0.8,
                border_color="rgb(62,215,213)",
            ),
            map3d_label=opts.Map3DLabelOpts(
                is_show=True,
                text_style=opts.TextStyleOpts(
                    color="#fff", font_size=16, background_color="rgba(0,0,0,0)"
                ),
            ),
            emphasis_label_opts=opts.LabelOpts(is_show=True),
            light_opts=opts.Map3DLightOpts(
                main_color="#fff",
                main_intensity=1.2,
                is_main_shadow=False,
                main_alpha=55,
                main_beta=10,
                ambient_intensity=0.3,
            ),
        )
        .add(series_name="", data_pair="", maptype=ChartType.MAP3D)
        .set_global_opts(
            title_opts=opts.TitleOpts(title="全国行政区划地图-Base"),
            visualmap_opts=opts.VisualMapOpts(is_show=False),
            tooltip_opts=opts.TooltipOpts(is_show=True),
        )
    )
    return c


@C.funcs
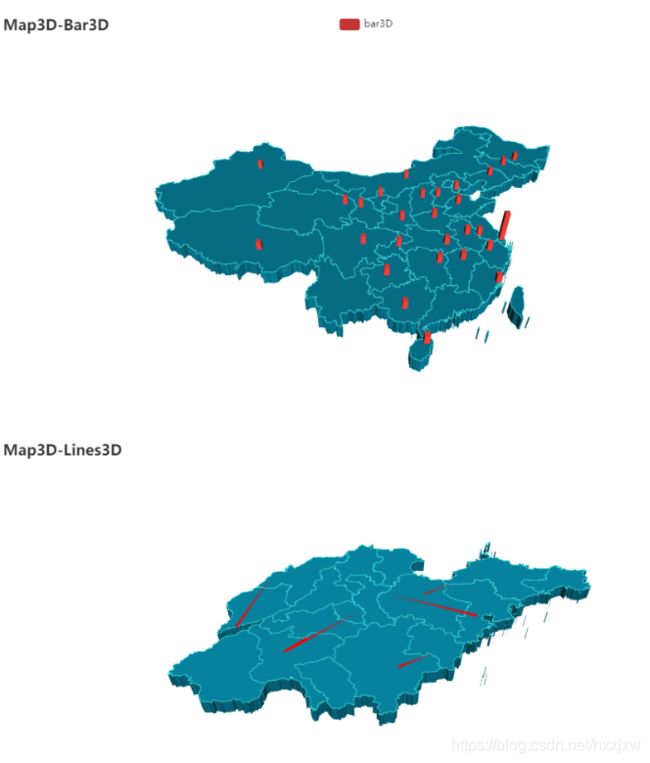
def map3d_with_bar3d() -> Map3D:
    example_data = [
        ("黑龙江", [127.9688, 45.368, 100]),
        ("内蒙古", [110.3467, 41.4899, 300]),
        ("吉林", [125.8154, 44.2584, 300]),
        ("辽宁", [123.1238, 42.1216, 300]),
        ("河北", [114.4995, 38.1006, 300]),
        ("天津", [117.4219, 39.4189, 300]),
        ("山西", [112.3352, 37.9413, 300]),
        ("陕西", [109.1162, 34.2004, 300]),
        ("甘肃", [103.5901, 36.3043, 300]),
        ("宁夏", [106.3586, 38.1775, 300]),
        ("青海", [101.4038, 36.8207, 300]),
        ("新疆", [87.9236, 43.5883, 300]),
        ("西藏", [91.11, 29.97, 300]),
        ("四川", [103.9526, 30.7617, 300]),
        ("重庆", [108.384366, 30.439702, 300]),
        ("山东", [117.1582, 36.8701, 300]),
        ("河南", [113.4668, 34.6234, 300]),
        ("江苏", [118.8062, 31.9208, 300]),
        ("安徽", [117.29, 32.0581, 300]),
        ("湖北", [114.3896, 30.6628, 300]),
        ("浙江", [119.5313, 29.8773, 300]),
        ("福建", [119.4543, 25.9222, 300]),
        ("江西", [116.0046, 28.6633, 300]),
        ("湖南", [113.0823, 28.2568, 300]),
        ("贵州", [106.6992, 26.7682, 300]),
        ("广西", [108.479, 23.1152, 300]),
        ("海南", [110.3893, 19.8516, 300]),
        ("上海", [121.4648, 31.2891, 1300]),
    ]

    c = (
        Map3D()
        .add_schema(
            itemstyle_opts=opts.ItemStyleOpts(
                color="rgb(5,101,123)",
                opacity=1,
                border_width=0.8,
                border_color="rgb(62,215,213)",
            ),
            map3d_label=opts.Map3DLabelOpts(
                is_show=False,
                formatter=JsCode(
                    "function(data){return data.name + " " + data.value[2];}"
                ),
            ),
            emphasis_label_opts=opts.LabelOpts(
                is_show=False,
                color="#fff",
                font_size=10,
                background_color="rgba(0,23,11,0)",
            ),
            light_opts=opts.Map3DLightOpts(
                main_color="#fff",
                main_intensity=1.2,
                main_shadow_quality="high",
                is_main_shadow=False,
                main_beta=10,
                ambient_intensity=0.3,
            ),
        )
        .add(
            series_name="bar3D",
            data_pair=example_data,
            type_=ChartType.BAR3D,
            bar_size=1,
            shading="lambert",
            label_opts=opts.LabelOpts(
                is_show=False,
                formatter=JsCode(
                    "function(data){return data.name + ' ' + data.value[2];}"
                ),
            ),
        )
        .set_global_opts(title_opts=opts.TitleOpts(title="Map3D-Bar3D"))
    )
    return c


@C.funcs
def map3d_with_lines3d() -> Map3D:
    example_data = [
        [[119.107078, 36.70925, 1000], [116.587245, 35.415393, 1000]],
        [[117.000923, 36.675807], [120.355173, 36.082982]],
        [[118.047648, 36.814939], [118.66471, 37.434564]],
        [[121.391382, 37.539297], [119.107078, 36.70925]],
        [[116.587245, 35.415393], [122.116394, 37.509691]],
        [[119.461208, 35.428588], [118.326443, 35.065282]],
        [[116.307428, 37.453968], [115.469381, 35.246531]],
    ]
    c = (
        Map3D()
        .add_schema(
            maptype="山东",
            itemstyle_opts=opts.ItemStyleOpts(
                color="rgb(5,101,123)",
                opacity=1,
                border_width=0.8,
                border_color="rgb(62,215,213)",
            ),
            light_opts=opts.Map3DLightOpts(
                main_color="#fff",
                main_intensity=1.2,
                is_main_shadow=False,
                main_alpha=55,
                main_beta=10,
                ambient_intensity=0.3,
            ),
            view_control_opts=opts.Map3DViewControlOpts(center=[-10, 0, 10]),
            post_effect_opts=opts.Map3DPostEffectOpts(is_enable=False),
        )
        .add(
            series_name="",
            data_pair=example_data,
            type_=ChartType.LINES3D,
            effect=opts.Lines3DEffectOpts(
                is_show=True,
                period=4,
                trail_width=3,
                trail_length=0.5,
                trail_color="#f00",
                trail_opacity=1,
            ),
            linestyle_opts=opts.LineStyleOpts(is_show=False, color="#fff", opacity=0),
        )
        .set_global_opts(title_opts=opts.TitleOpts(title="Map3D-Lines3D"))
    )
    return c


@C.funcs
def map3d_with_scatter3d() -> Map3D:
    example_data = [
        ("黑龙江", [127.9688, 45.368, 100]),
        ("内蒙古", [110.3467, 41.4899, 100]),
        ("吉林", [125.8154, 44.2584, 100]),
        ("辽宁", [123.1238, 42.1216, 100]),
        ("河北", [114.4995, 38.1006, 100]),
        ("天津", [117.4219, 39.4189, 100]),
        ("山西", [112.3352, 37.9413, 100]),
        ("陕西", [109.1162, 34.2004, 100]),
        ("甘肃", [103.5901, 36.3043, 100]),
        ("宁夏", [106.3586, 38.1775, 100]),
        ("青海", [101.4038, 36.8207, 100]),
        ("新疆", [87.9236, 43.5883, 100]),
        ("西藏", [91.11, 29.97, 100]),
        ("四川", [103.9526, 30.7617, 100]),
        ("重庆", [108.384366, 30.439702, 100]),
        ("山东", [117.1582, 36.8701, 100]),
        ("河南", [113.4668, 34.6234, 100]),
        ("江苏", [118.8062, 31.9208, 100]),
        ("安徽", [117.29, 32.0581, 100]),
        ("湖北", [114.3896, 30.6628, 100]),
        ("浙江", [119.5313, 29.8773, 100]),
        ("福建", [119.4543, 25.9222, 100]),
        ("江西", [116.0046, 28.6633, 100]),
        ("湖南", [113.0823, 28.2568, 100]),
        ("贵州", [106.6992, 26.7682, 100]),
        ("广西", [108.479, 23.1152, 100]),
        ("海南", [110.3893, 19.8516, 100]),
        ("上海", [121.4648, 31.2891, 100]),
    ]

    c = (
        Map3D()
        .add_schema(
            itemstyle_opts=opts.ItemStyleOpts(
                color="rgb(5,101,123)",
                opacity=1,
                border_width=0.8,
                border_color="rgb(62,215,213)",
            ),
            map3d_label=opts.Map3DLabelOpts(
                is_show=False,
                formatter=JsCode(
                    "function(data){return data.name + " " + data.value[2];}"
                ),
            ),
            emphasis_label_opts=opts.LabelOpts(
                is_show=False,
                color="#fff",
                font_size=10,
                background_color="rgba(0,23,11,0)",
            ),
            light_opts=opts.Map3DLightOpts(
                main_color="#fff",
                main_intensity=1.2,
                main_shadow_quality="high",
                is_main_shadow=False,
                main_beta=10,
                ambient_intensity=0.3,
            ),
        )
        .add(
            series_name="Scatter3D",
            data_pair=example_data,
            type_=ChartType.SCATTER3D,
            bar_size=1,
            shading="lambert",
            label_opts=opts.LabelOpts(
                is_show=False,
                formatter=JsCode(
                    "function(data){return data.name + ' ' + data.value[2];}"
                ),
            ),
        )
        .set_global_opts(title_opts=opts.TitleOpts(title="Map3D-Scatter3D"))
    )
    return c


Page().add(*[fn() for fn, _ in C.charts]).render()
自定义
#v1

import json
import os

from pyecharts import options as opts
from pyecharts.charts import Page, PictorialBar
from pyecharts.faker import Collector
from pyecharts.globals import SymbolType

C = Collector()


location = ["山西", "四川", "西藏", "北京", "上海", "内蒙古", "云南", "黑龙江", "广东", "福建"]
values = [13, 42, 67, 81, 86, 94, 166, 220, 249, 262]

with open(os.path.join("fixtures", "symbol.json"), "r", encoding="utf-8") as f:
    symbols = json.load(f)


@C.funcs
def pictorialbar_base() -> PictorialBar:
    c = (
        PictorialBar()
        .add_xaxis(location)
        .add_yaxis(
            "",
            values,
            label_opts=opts.LabelOpts(is_show=False),
            symbol_size=18,
            symbol_repeat="fixed",
            symbol_offset=[0, 0],
            is_symbol_clip=True,
            symbol=SymbolType.ROUND_RECT,
        )
        .reversal_axis()
        .set_global_opts(
            title_opts=opts.TitleOpts(title="PictorialBar-各省份人口数量(虚假数据)"),
            xaxis_opts=opts.AxisOpts(is_show=False),
            yaxis_opts=opts.AxisOpts(
                axistick_opts=opts.AxisTickOpts(is_show=False),
                axisline_opts=opts.AxisLineOpts(
                    linestyle_opts=opts.LineStyleOpts(opacity=0)
                ),
            ),
        )
    )
    return c


@C.funcs
def pictorialbar_custom_symbol() -> PictorialBar:
    c = (
        PictorialBar()
        .add_xaxis(location)
        .add_yaxis(
            "",
            values,
            label_opts=opts.LabelOpts(is_show=False),
            symbol_size=22,
            symbol_repeat="fixed",
            symbol_offset=[0, -5],
            is_symbol_clip=True,
            symbol=symbols["boy"],
        )
        .reversal_axis()
        .set_global_opts(
            title_opts=opts.TitleOpts(title="PictorialBar-自定义 Symbol"),
            xaxis_opts=opts.AxisOpts(is_show=False),
            yaxis_opts=opts.AxisOpts(
                axistick_opts=opts.AxisTickOpts(is_show=False),
                axisline_opts=opts.AxisLineOpts(
                    linestyle_opts=opts.LineStyleOpts(opacity=0)
                ),
            ),
        )
    )
    return c


@C.funcs
def pictorialbar_multi_custom_symbols() -> PictorialBar:
    c = (
        PictorialBar()
        .add_xaxis(["reindeer", "ship", "plane", "train", "car"])
        .add_yaxis(
            "2015",
            [
                {"value": 157, "symbol": symbols["reindeer"]},
                {"value": 21, "symbol": symbols["ship"]},
                {"value": 66, "symbol": symbols["plane"]},
                {"value": 78, "symbol": symbols["train"]},
                {"value": 123, "symbol": symbols["car"]},
            ],
            label_opts=opts.LabelOpts(is_show=False),
            symbol_size=22,
            symbol_repeat="fixed",
            symbol_offset=[0, 5],
            is_symbol_clip=True,
        )
        .add_yaxis(
            "2016",
            [
                {"value": 184, "symbol": symbols["reindeer"]},
                {"value": 29, "symbol": symbols["ship"]},
                {"value": 73, "symbol": symbols["plane"]},
                {"value": 91, "symbol": symbols["train"]},
                {"value": 95, "symbol": symbols["car"]},
            ],
            label_opts=opts.LabelOpts(is_show=False),
            symbol_size=22,
            symbol_repeat="fixed",
            symbol_offset=[0, -25],
            is_symbol_clip=True,
        )
        .reversal_axis()
        .set_global_opts(
            title_opts=opts.TitleOpts(title="PictorialBar-Vehicles in X City"),
            xaxis_opts=opts.AxisOpts(is_show=False),
            yaxis_opts=opts.AxisOpts(
                axistick_opts=opts.AxisTickOpts(is_show=False),
                axisline_opts=opts.AxisLineOpts(
                    linestyle_opts=opts.LineStyleOpts(opacity=0)
                ),
            ),
        )
    )
    return c


Page().add(*[fn() for fn, _ in C.charts]).render()


