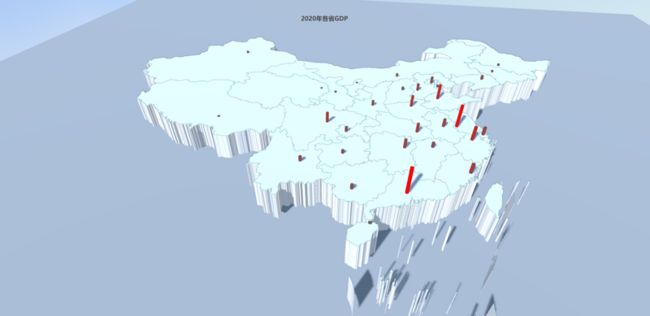
通过echarts-gl 可视化展示2020GDP 数据
效果:
3d地图和二维比起来可以随心所欲的旋转自然更受欢迎,echarts 各类文档齐全,虽然配置略显繁琐,但这也说明人家功能丰富啊,精研一下不亏
import { gdp } from './data.js'
const xhr = new XMLHttpRequest()
xhr.open('GET', './china.json', true)
xhr.send()
xhr.onreadystatechange = () => {
  if (xhr.readyState === 4 && xhr.status === 200) {
    const china = JSON.parse(xhr.responseText)
    // 获取各省经纬度中心点
    const proviceCenter = new Map()
    china.features.forEach((provice) => {
      proviceCenter.set(provice.properties.name, provice.properties.center)
    })
    // 合并数据
    const barData = gdp.map((item) => {
      return {
        name: item.name,
        value: [...proviceCenter.get(item.name), item.value]
      }
    })
    // 注册地图
    echarts.registerMap('china', china)
    const map = echarts.init(document.getElementById('chart'))

    const option = {
      title: {
        text: '2020年各省GDP',
        left: 'center',
        top: 45
      },
      visualMap: {
        show: false,
        min: 2000,
        max: 120000,
        inRange: {
          color: ['#666', 'red']
        }
      },
      geo3D: {
        map: 'china',
        // 区域边界高度
        regionHeight: 5,
        // 真实感渲染
        shading: 'realistic',
        // 将地图设置一个摆放平台
        groundPlane: {
          show: true,
          color: '#666'
        },
        // realisticMaterial: {
        //   detailTexture: './earth.jpg'
        // },
        // 视角控制
        viewControl: {
          projection: 'perspective',
          // 距离
          distance: 80,
          // 角度
          alpha: 30,
          beta: 1,
          animationDurationUpdate: 10,
          autoRotate: false,
          minBeta: -360,
          maxBeta: 360
        },
        // 灯光
        light: {
          main: {
            // color: '#687',
            intensity: 1.2, // 光照强度
            shadowQuality: 'high', // 阴影亮度
            shadow: true, // 是否显示阴影
            alpha: 45,
            beta: -25
          },
          ambientCubemap: {
            diffuseIntensity: 1.2,
            // 光源材质
            texture: './light.png'
          }
        },
        // 区块颜色及边线设置
        itemStyle: {
          borderColor: '#489',
          borderWidth: .5,
          color: '#888'
        },
        // hover时样式
        emphasis: {
          label: {
            show: false
          },
          itemStyle: {
            // color: 'transparent',
            color: '#888'
          }
        }
      },
      series: {
        type: 'bar3D',
        coordinateSystem: 'geo3D',
        // 倒角尺寸
        bevelSize: 0.5,
        bevelSmoothness: 20,
        data: barData,
        minHeight: 0.2,
        barSize: .5,
        emphasis: {
          label: {
            show: true,
            formatter: (param) => {
              return param.name + ' : ' + param.value[2] + '万亿元'
            },
            distance: 1,
            textStyle: {
              fontWeight: 'bold',
              fontSize: 18,
            }
          },
        },
        animation: true,
        animationDurationUpdate: 2000
      }
    }

    map.setOption(option)
  }
}
完整代码 github
