python可视化——常见的图表
1.常规的画图-折线图`
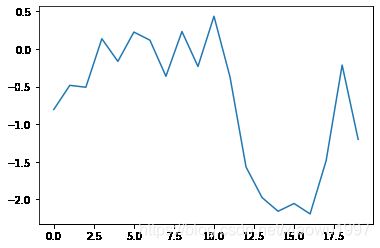
import numpy as np
import matplotlib.pyplot as plt
np.random.seed(1000)
y=np.random.standard_normal(20)
# print(y)
plt.plot(y.cumsum()) #cumsum可以获取数据的总和
import numpy as np
import matplotlib.pyplot as plt
np.random.seed(2000)
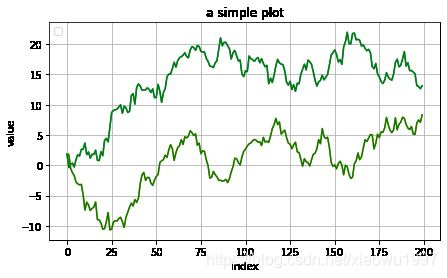
y=np.random.standard_normal((200,2)).cumsum(axis=0)
plt.figure(figsize=(7,4))
plt.plot(y,lw=1.5)
plt.plot(y,'g-')
plt.grid(True)
plt.legend(loc=2)
plt.axis('tight')
plt.xlabel('index')
plt.ylabel('value')
plt.title('a simple plot')
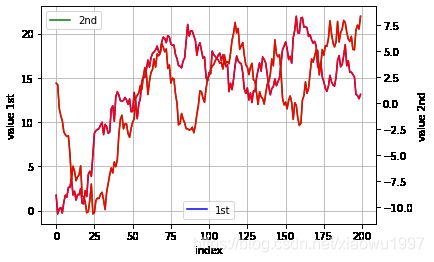
fig,ax1=plt.subplots() #使用第一个(左边)的坐标轴画第一组数据
plt.plot(y[:,0],'b',lw=1.5,label='1st')
plt.plot(y[:,0],'r')
plt.grid(True)
plt.legend(loc=8)
plt.axis('tight')
plt.xlabel('index')
plt.ylabel('value 1st')
ax2=ax1.twinx() #用第二个坐标轴(右边)画第二组数据
plt.plot(y[:,1],'g',lw=1.5,label='2nd')
plt.plot(y[:,1],'r')
plt.legend(loc=0)
plt.ylabel('value 2nd')
import numpy as np
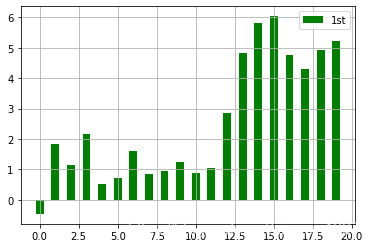
y=np.random.standard_normal((20,2)).cumsum(axis=0)
print(y)
print(y[:,0])
print(y[:,1])

plt.bar(np.arange(len(y)),y[:,0],width=0.5,color="g",label='1st')
plt.grid(True)
plt.legend(loc=0)
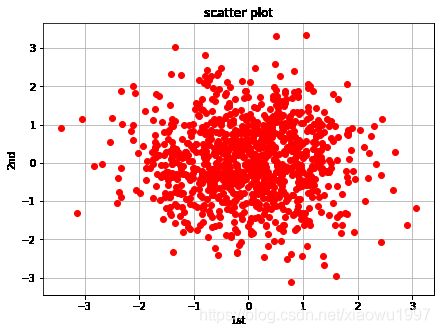
y=np.random.standard_normal((1000,2))
plt.figure(figsize=(7,5))
plt.plot(y[:,0],y[:,1],'ro')
plt.grid(True)
plt.xlabel('1st')
plt.ylabel('2nd')
plt.title('scatter plot')
c=np.random.randint(0,10,len(y)) #随机数据生成第三个数据集
plt.figure(figsize=(7,5))
plt.scatter(y[:,0],y[:,1],c=c,marker='o')
plt.colorbar()
plt.grid(True)
plt.xlabel('1st')
plt.ylabel('2nd')
plt.title('scatter plot')
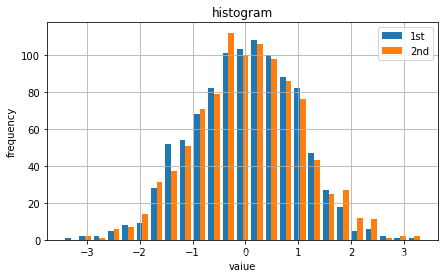
plt.figure(figsize=(7,4))
plt.hist(y,label=['1st','2nd'],bins=25)
plt.grid(True)
plt.legend(loc=0)
plt.xlabel('value')
plt.ylabel('frequency')
plt.title('histogram')
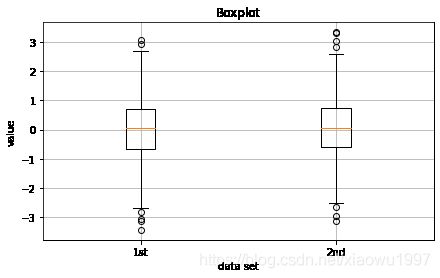
fig,ax=plt.subplots(figsize=(7,4))
plt.boxplot(y)
plt.grid(True)
plt.setp(ax,xticklabels=['1st','2nd'])
plt.xlabel('data set')
plt.ylabel('value')
plt.title('Boxplot')
