《机器学习实战》学习——k近邻算法
文章目录
- 算法原理
- 算法模板
- 实例:约会网站匹配推荐
-
- 题目描述
- 导入数据
- 分析数据
- 数据归一化
- 测试算法
- 进行预测
- 实例:手写字体识别
-
- 题目描述
- 数据预处理
- 测试算法
算法原理
k-近邻算法是一种监督学习算法,是一种“懒惰学习”(在训练阶段仅把数据保存起来,待收到测试样本后再进行处理)。
原理:给定测试样本,基于某种距离度量找出训练集中与其最靠近的k各训练样本,然后基于这k个邻居来进行预测。
分类任务——“投票法”
回归任务——“平均法”
一般步骤: 收集数据->准备数据->分析数据->测试算法->使用算法
算法模板
def classify(inX, dataSet, labels, k):
    rowNum = dataSet.shape[0]
    # 计算距离(欧式距离)
    diffMat = np.tile(inX, (rowNum, 1)) - dataSet
    sqDiffMat = diffMat ** 2
    sqDistances = sqDiffMat.sum(axis=1)
    distances = sqDistances ** 0.5
    # 距离排序
    sortedDisIndex = distances.argsort()
    # 统计距离最近前k个的类别
    classCount = {
     }
    for i in range(k):
        label = labels[sortedDisIndex[i]]
        classCount[label] = classCount.get(label, 0) + 1
    # 类别出现次数排序及选出现次数最多的
    sortedClassCount = sorted(classCount.items(), key=operator.itemgetter(1), reverse=True)
    return sortedClassCount[0][0]
实例:约会网站匹配推荐
题目描述
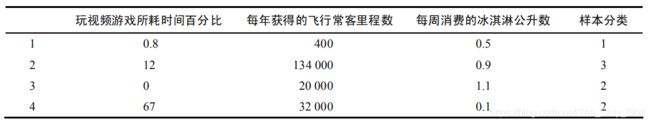
- 输入特征:
- 每年获取的飞行常客里程数
- 每周消费的冰淇凌公斤数
- 玩视频游戏所耗时间占比
- 输出
- 不喜欢的人
- 魅力一般的人
- 极具魅力的人
所用python包
import numpy as np
import operator
import matplotlib
from matplotlib import pyplot as plt

matplotlib.rc("font", family='MicroSoft YaHei')  # 设置中文字体
导入数据
# 导入数据
def file2matrix(filename):
    fr = open(filename)
    lines = fr.readlines()
    numberOfLines = len(lines)
    returnMat = np.zeros((numberOfLines, 3))
    labels = list()
    index = 0
    for line in lines:
        line = line.strip()
        colums = line.split('\t')
        returnMat[index, :] = colums[0:3]
        labels.append(int(colums[-1]))
        index += 1
    return returnMat, labels
分析数据
结果

源码
# 分析数据
def analyseData(x, y):
    x1 = np.array([])
    x2 = np.array([])
    x3 = np.array([])
    for i in range(len(x)):
        if y[i] == 1:
            if len(x1) == 0:
                x1 = np.copy(x[i])
            else:
                x1 = np.vstack((x1, x[i]))
        elif y[i] == 2:
            if len(x2) == 0:
                x2 = np.copy(x[i])
            else:
                x2 = np.vstack((x2, x[i]))
        elif y[i] == 3:
            if len(x3) == 0:
                x3 = np.copy(x[i])
            else:
                x3 = np.vstack((x3, x[i]))
    # y = x1[:,1]
    print('x1', x2)
    fig = plt.figure(figsize=(10, 10))
    ax1 = fig.add_subplot(2, 2, 1)
    ax1.scatter(x1[:, 2], x1[:, 1], s=30, c='cyan', label='不喜欢')
    ax1.scatter(x2[:, 2], x2[:, 1], s=30, c='lime', label='魅力一般')
    ax1.scatter(x3[:, 2], x3[:, 1], s=30, c='darkviolet', label='极具魅力')
    legend2 = plt.legend(loc=1)
    legend2.get_frame().set_alpha(0.3)
    # legend2.get_frame().set_facecolor('none')
    plt.xlabel("玩视频游戏所耗时间占比")
    plt.ylabel("每周消费的冰淇凌公斤数")
    plt.title("玩视频游戏所耗时间与每周消费的冰淇淋数关系")
    ax2 = fig.add_subplot(2, 2, 2)
    ax2.scatter(x1[:, 0], x1[:, 2], s=30, c='cyan', label='不喜欢')
    ax2.scatter(x2[:, 0], x2[:, 2], s=30, c='lime', label='魅力一般')
    ax2.scatter(x3[:, 0], x3[:, 2], s=30, c='darkviolet', label='极具魅力')
    legend2 = plt.legend(loc=1)
    legend2.get_frame().set_alpha(0.3)
    # legend2.get_frame().set_facecolor('none')
    plt.xlabel("每年获取的飞行常客里程数")
    plt.ylabel("玩视频游戏所耗时间占比")
    plt.title("每年获取的飞行常客里程数与玩视频游戏所耗时间关系")
    ax3 = fig.add_subplot(2, 2, 3)
    ax3.scatter(x1[:, 0], x1[:, 1], s=30, c='cyan', label='不喜欢')
    ax3.scatter(x2[:, 0], x2[:, 1], s=30, c='lime', label='魅力一般')
    ax3.scatter(x3[:, 0], x3[:, 1], s=30, c='darkviolet', label='极具魅力')
    legend3 = plt.legend(loc=1)
    legend3.get_frame().set_alpha(0.3)
    # legend3.get_frame().set_facecolor('none')
    plt.xlabel("每年获取的飞行常客里程数")
    plt.ylabel("每周消费的冰淇凌公斤数")
    plt.title("每年获取的飞行常客里程数与每周消费的冰淇凌公斤数关系")
    plt.tight_layout(3)
    plt.show()
数据归一化
# 数据归一化
def autoNorm(dataSet):
    minVals = dataSet.min(axis=0)
    maxVals = dataSet.max(axis=0)
    ranges = maxVals - minVals
    numRow = dataSet.shape[0]
    normDataSet = dataSet - np.tile(minVals, (numRow, 1))
    normDataSet = normDataSet / np.tile(ranges, (numRow, 1))
    return normDataSet, ranges, minVals
测试算法
训练数据与测试数据9:1划分
# 测试算法
def datingClassTest(dataSetFileName):
    hoRatio = 0.1
    x, y = file2matrix(dataSetFileName)
    normX = autoNorm(x)[0]
    numRows = normX.shape[0]
    numTest = int(numRows * hoRatio)
    errorCount = 0.0
    for i in range(numTest):
        res = classify(normX[i, :], normX[numTest:numRows, :], \
                       y[numTest:numRows], 3)
        print("分类器返回结果为:%d真实值为:%d" \
              % (res, y[i]))
        if (res != y[i]):
            errorCount += 1.0
    print("总错误率为:%f" % (errorCount / float(numTest)))
进行预测
# 预测
def classifyPerson(trainingDataSetFileName):
    resList = ['不喜欢', '魅力一般', '极具魅力']
    ffMiles = float(input("每年获取的飞行常客里程数:"))
    icecream = float(input('每周消费的冰淇凌公斤数:'))
    game = float(input("玩视频游戏所耗时间占比:"))
    x, y = file2matrix(trainingDataSetFileName)
    x = autoNorm(x)[0]
    inX = np.array([ffMiles, icecream, game])
    res = classify(inX, x, y, 3)
    print("您可能喜欢与'%s'的人约会:" % resList[res - 1])
实例:手写字体识别
题目描述
输入数据:手写数字图像经处理后的32*32的0/1文本文件
输出数据:图像中手写数字的数字

数据预处理
将32 * 32的n个0/1数据文件,转换成n *1024的矩阵
# 数据预处理
def img2vector(filename):
    ret = np.zeros((1, 1024))
    fr = open(filename)
    for i in range(32):
        line = fr.readline()
        for j in range(32):
            ret[0, 32 * i + j] = int(line[j])
    return ret
测试算法
# 测试算法
def handwritingClassTest():
    labels = []
    trainingFileList = os.listdir('datasets/Ch02/digits/trainingDigits')
    trainingFileNum = len(trainingFileList)
    trainingMat = np.zeros((trainingFileNum, 1024))
    for i in range(trainingFileNum):
        filename = trainingFileList[i]
        fileStr = filename.split('.')[0]
        label = int(fileStr.split('_')[0])
        labels.append(label)
        trainingMat[i, :] = img2vector('datasets/Ch02/digits/trainingDigits/%s' % filename)
    testFileList = os.listdir('datasets/Ch02/digits/testDigits')
    errorCount = 0.0
    testNum = len(testFileList)
    for i in range(testNum):
        filename = testFileList[i]
        fileStr = filename.split('.')[0]
        label = int(fileStr.split('_')[0])
        testX = img2vector('datasets/Ch02/digits/testDigits/%s' % filename)
        res = classify(testX, trainingMat, labels, 3)
        print("分类器返回结果:%d,真实值为:%d" % (res, label))
        if (res != label):
            errorCount += 1.0
    print("总错误率为:%f" % (errorCount / float(testNum)))