k近邻算法--约会网站预测案例
k近邻算法总结
一、判断分类的方法
采用测量不同特征值之间的距离方法进行分类。
给定一个有特征值和已知分类标签的样本数据集,将新的特征数据与样本数据进行距离比较,选出距离最近的前k个数据的分类标签,再在这些标签中选出频率最高的,作为新数据的的分类。
二、距离怎么算
常用欧式距离和曼哈顿距离
1)欧式距离:用于计算两点或多点之间的距离。

缺点:它将样本的不同属性(即各指标或各变量量纲)之间的差别等同看待,这一点有时不能满足实际要求。比如年龄和学历对工资的影响,将年龄和学历同等看待;收入单位为元和收入单位为万元同等看待。
标准化欧式距离,将属性进行标准化处理,区间设置在[0,1]之间,减少量纲的影响。(归一化处理)
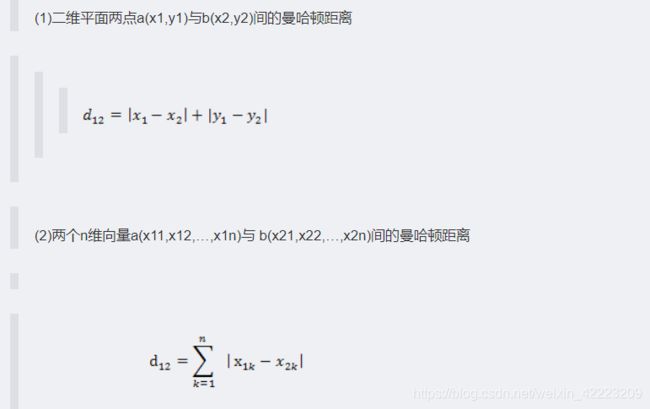
2)曼哈顿距离:欧式几何空间两点之间的距离在两个坐标轴的投影。

三、K近邻算法的优缺点
1、缺点:k-近邻算法必须保存全部数据集,如果训练数据集的很大,必须使用大量的存储空间。此外,由于必须对数据集中的每个数据计算距离值,实际使用时可能非常耗时;另一个缺陷是它无法给出任何数据的基础结构信息,因此我们也无法知晓平均实例样本和典型实例样本具有什么特征。
2、优点:精度高、对异常值不敏感、无数据输入假定
四、适用数据范围:数值型和标称型
案例------约会网站配对预测
案例背景:
卡特琳娜一直在使用约会网站寻找适合自己的约会对象。尽管约会网站会给她推荐不同的人选,但她并不是喜欢每一个人。经过一番总结,她发现她曾经交往过三种类型的人:
1)不喜欢的人
2)魅力一般的人
3)极具魅力的人
尽管发现了这样的规律,但是卡特琳娜还是没办法及那个网站推荐的人分类,这可把她给愁坏了!所以,她找到我们,希望我们可以写一个分类软件,来帮助她将匹配对象划分到确切的分类中。
卡特琳娜提供给我们一个txt文件,叫做datingSet.txt,其中每个样本占一行,总共有1000行。每个样本主要包括以下三个特征:
1)每年获得的飞行常客里程数
2)玩视频游戏所耗时间百分比
3)每周消费的冰淇淋公升数
整体思路:
1、准备数据:解析文本文件(KNN.py中添加file2matrix函数)
2、分析数据:Matplotlib画二维散点图
3、构造分类器:计算新数据点与样本数据中各点的距离,取距离最小的前K个点,找出其对应的分类标签,再在这些标签总找出频率最高的分类标签,作为新数据点的分类。(KNN.py中添加classify0函数)
4、归一化处理:剔除数值绝对大小的规模因素。如将取值范围处理为0到1或者-1到1之间。(KNN.py中添加autoNorm函数)
5、测试算法:将样本数据中的10%作为测试数据,将计算出来的分类与它本身的label进行对比,评估错误率。(KNN.py中添加datingClassTest函数)
6、构建完整可用系统
一、构造一个简单的分类器
创建一个KNN.py文件,内容:
from numpy import *
import operator

def createDataSet():
    group=array([[1.0,1.1],[1.0,1.0],[0,0],[0,0.1]])
    labels=list('AABB')
    return group,labels'''
import kNN
---------------------------------------------------------------------------

ModuleNotFoundError                       Traceback (most recent call last)

 in
----> 1 import kNN


ModuleNotFoundError: No module named 'kNN'
import sys
sys.path.append("D:/") #添加模块搜索路径
import KNN
group,labels=KNN.createDataSet()
group
array([[1. , 1.1],
       [1. , 1. ],
       [0. , 0. ],
       [0. , 0.1]])
labels
['A', 'A', 'B', 'B']
group.shape
(4, 2)
构造分类函数:
'''增加文件KNN.py内容:
def classify0(inX,dataSet,labels,k):
    dataSetsize=dataSet.shape[0]
    diffMat=tile(inX,(dataSetsize,1))-dataSet
    sqDiffMat=diffMat**2
    sqDistances=sqDiffMat.sum(axis=1)
    distances=sqDistances**0.5
    sortedDisIndicies=distances.argsort()
    classCount={}
    for i in range(k):
        voteIlabel=labels[sortedDisIndicies[i]]
        classCount[voteIlabel]=classCount.get(voteIlabel,0)+1
    sortedClassCount=sorted(classCount.iteritems(),key=operator.itemgetter(1),reverse=True)
    return sortedClassCount[0][0]'''
classify0()函数的意义:将新数据与样本数据进行距离对比,找出前k个距离最近的样本点, 再找出这些样本点对应分类频率最大的一个,作为新数据的分类
以下为函数中每行代码的测试:
KNN.classify0([1,2],group,labels,3)
#group是已知类别的训练样本集,group中每个元素对应类别在lables中。想知道[1,2]这个向量(数据点)的类型
'A'
dataSetsize=group.shape[0]
diffMat=KNN.tile([1,2],(dataSetsize,1))-group
diffMat# 向量数据与已知类别数据group的每个数据点的差
array([[0. , 0.9],
       [0. , 1. ],
       [1. , 2. ],
       [1. , 1.9]])
sqDiffMat=diffMat**2
sqDistances=sqDiffMat.sum(axis=1)
distances=sqDistances**0.5
distances  #向量数据与已知类别数据group的每个数据点的距离:差的平方和再开方(欧式距离公式)
array([0.9 , 1. , 2.23606798, 2.14709106])
sortedDisIndicies=distances.argsort()# 各距离从小到大排序的索引器
sortedDisIndicies
array([0, 1, 3, 2], dtype=int64)
# 各距离从小到大排序后,取对应训练样本集中离新数据最近的前3个数据点,计算这三个数据点对应分类的个数,看哪个分类的出现频率最大:
classCount={
     }
for i in range(3): # k=3
    voteIlabel=labels[sortedDisIndicies[i]] #labels=['A', 'A', 'B', 'B']
    classCount[voteIlabel]=classCount.get(voteIlabel,0)+1
classCount
{'A': 2, 'B': 1}
classCount.items()
dict_items([('A', 2), ('B', 1)])
看哪个分类的出现频率最大,结果是A,则以A作为新数据的类型:
sortedClassCount=sorted(classCount.items(),key=KNN.operator.itemgetter(1),reverse=True)
#降序,.operator.itemgetter(1)表示对每个元组中的第二个值来排序
sortedClassCount
[('A', 2), ('B', 1)]
二、数据解析
file2matrix()函数的含义:-----样本数据的文件解析,将特征值和分类标签分别放到数组和列表中
- 原数据文件dataSet长这样:前三列是特征值:飞行里程、玩游戏时间占比、冰淇淋公斤数,最后一列是分类标签
'''
40920	8.326976	0.953952	largeDoses
14488	7.153469	1.673904	smallDoses
26052	1.441871	0.805124	didntLike
75136	13.147394	0.428964	didntLike
38344	1.669788	0.134296	didntLike
72993	10.141740	1.032955	didntLike
35948	6.830792	1.213192	largeDoses
42666	13.276369	0.543880	largeDoses
67497	8.631577	0.749278	didntLike
35483	12.273169	1.508053	largeDoses'''
增加文件KNN.py内容:
def file2matrix(filename):
    fr=open(filename) ------打开文件
    arrayOLines=fr.readlines()------一次性读取整个文件,将每行作为一个元素,放入一个列表中
    numberOfLines=len(arrayOLines)-------文件的行数
    returnMat=zeros((numberOfLines,3))--------生成一个与文件行数相同,3列,值全为0的数组
    classLabelVector=[]
    index=0
    for line in arrayOLines:
        line=line.strip()-----去除每行首尾两端的回车字符
        listFromLine=line.split('\t')
        returnMat[index,:]=listFromLine[0:3]-----------将原文件的前3列元素(特征值)放到数组中,
        classLabelVector.append(int(listFromLine[-1]))-------原文件最后一列元素(分类标签)转换为int之后放到一个列表中
        index+=1
    return returnMat, classLabelVector--------返回由原文件前3列元素组成的数组,以及源文件最后一列元素组成的分类标签列表'''
从文本文件中导入数据:
reload(KNN) # python 2.6的写法
datingDataMat,datingLabels=KNN.file2matrix(r"D:\《机器学习实战》高清中文版PDF+高清英文版PDF+源代码\《机器学习实战》高清中文版PDF+高清英文版PDF+源代码\机器学习实战(源代码)\Ch02\datingTestSet.txt")
---------------------------------------------------------------------------

NameError                                 Traceback (most recent call last)

 in
----> 1 reload(KNN) # python 2.6的写法
      2 datingDataMat,datingLabels=KNN.file2matrix(r"D:\《机器学习实战》高清中文版PDF+高清英文版PDF+源代码\《机器学习实战》高清中文版PDF+高清英文版PDF+源代码\机器学习实战(源代码)\Ch02\datingTestSet.txt")


NameError: name 'reload' is not defined
import importlib
# 重新加载KNN包
datingDataMat,datingLabels=KNN.file2matrix(r"D:\《机器学习实战》高清中文版PDF+高清英文版PDF+源代码\《机器学习实战》高清中文版PDF+高清英文版PDF+源代码\机器学习实战(源代码)\Ch02\datingTestSet.txt")
---------------------------------------------------------------------------

ValueError                                Traceback (most recent call last)

 in
----> 1 datingDataMat,datingLabels=KNN.file2matrix(r"D:\《机器学习实战》高清中文版PDF+高清英文版PDF+源代码\《机器学习实战》高清中文版PDF+高清英文版PDF+源代码\机器学习实战(源代码)\Ch02\datingTestSet.txt")


D:\KNN.py in file2matrix(filename)
     38         listFromLine=line.split('\t')
     39         returnMat[index,:]=listFromLine[0:3]
---> 40         classLabelVector.append(int(listFromLine[-1]))
     41         index+=1
     42     return returnMat, classLabelVector


ValueError: invalid literal for int() with base 10: 'largeDoses'
注意:上面报错! 需要把第四列字符传转换为数字,我的方法:
import pandas as pd
df=pd.read_csv(r"D:\《机器学习实战》高清中文版PDF+高清英文版PDF+源代码\《机器学习实战》高清中文版PDF+高清英文版PDF+源代码\机器学习实战(源代码)\Ch02\datingTestSet.txt",
              sep='\t',header=None,names=list('ABCD'))
df_D_cat=df.D.astype('category',categories=['didntLike','smallDoses','largeDoses'], ordered=True)
df_D_cat.values
C:\ProgramData\Anaconda3\lib\site-packages\IPython\core\interactiveshell.py:3296: FutureWarning: specifying 'categories' or 'ordered' in .astype() is deprecated; pass a CategoricalDtype instead
  exec(code_obj, self.user_global_ns, self.user_ns)


[largeDoses, smallDoses, didntLike, didntLike, didntLike, ..., smallDoses, didntLike, largeDoses, largeDoses, largeDoses]
Length: 1000
Categories (3, object): [didntLike < smallDoses < largeDoses]
df.D=df_D_cat.values.codes
df.head(5)
| A | B | C | D | |
|---|---|---|---|---|
| 0 | 40920 | 8.326976 | 0.953952 | 2 |
| 1 | 14488 | 7.153469 | 1.673904 | 1 |
| 2 | 26052 | 1.441871 | 0.805124 | 0 |
| 3 | 75136 | 13.147394 | 0.428964 | 0 |
| 4 | 38344 | 1.669788 | 0.134296 | 0 |
我们直接利用资料中转换好的数据集文件:
datingDataMat,datingLabels=KNN.file2matrix(r"D:\《机器学习实战》高清中文版PDF+高清英文版PDF+源代码\《机器学习实战》高清中文版PDF+高清英文版PDF+源代码\机器学习实战(源代码)\Ch02\datingTestSet2.txt")
datingDataMat
array([[4.0920000e+04, 8.3269760e+00, 9.5395200e-01],
       [1.4488000e+04, 7.1534690e+00, 1.6739040e+00],
       [2.6052000e+04, 1.4418710e+00, 8.0512400e-01],
       ...,
       [2.6575000e+04, 1.0650102e+01, 8.6662700e-01],
       [4.8111000e+04, 9.1345280e+00, 7.2804500e-01],
       [4.3757000e+04, 7.8826010e+00, 1.3324460e+00]])
datingLabels[0:20]
[3, 2, 1, 1, 1, 1, 3, 3, 1, 3, 1, 1, 2, 1, 1, 1, 1, 1, 2, 3]
三、 分析数据,可视化分析
import matplotlib
import matplotlib.pyplot as plt
fig=plt.figure()
ax=fig.add_subplot(111)
ax.scatter(datingDataMat[:,1],datingDataMat[:,2])
import numpy as np
fig=plt.figure()
ax=fig.add_subplot(111)
ax.scatter(datingDataMat[:,1],datingDataMat[:,2],15*np.array(datingLabels),15*np.array(datingLabels))
plt.show()
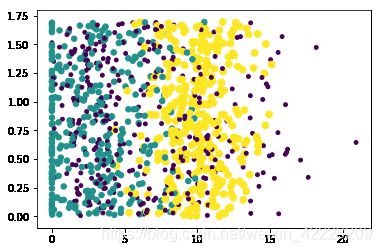
采用datingDataMat矩阵的属性列1和2展示数据,对应的分类呈现更为明显:
fig=plt.figure()
ax=fig.add_subplot(111)
datingLabels = np.array(datingLabels)
idx_1 = np.where(datingLabels==1)
p1 = ax.scatter(datingDataMat[idx_1,0],datingDataMat[idx_1,1],marker = '*',color = 'r',label='1',s=10)
idx_2 = np.where(datingLabels==2)
p2 = ax.scatter(datingDataMat[idx_2,0],datingDataMat[idx_2,1],marker = 'o',color ='g',label='2',s=20)
idx_3 = np.where(datingLabels==3)
p3 = ax.scatter(datingDataMat[idx_3,0],datingDataMat[idx_3,1],marker = '+',color ='b',label='3',s=30)
ax.set_xlabel('Flying Miles')
ax.set_ylabel("Percentage of Time Spent Playing Games")
ax.legend((p1,p2,p3),("Did Not Like","Small Doses","Large Doses"),loc=2)
plt.show()
插播:再次复习下np.where()
idx_1 = np.where(datingLabels==1) #
idx_1
(array([  2,   3,   4,   5,   8,  10,  11,  13,  14,  15,  16,  17,  21,
         29,  31,  33,  35,  36,  40,  45,  46,  47,  48,  51,  58,  60,
         69,  74,  76,  77,  80,  83,  85,  88,  89,  92,  94,  98,  99,
        101, 108, 112, 114, 116, 117, 125, 129, 134, 138, 140, 141, 147,
        155, 158, 159, 164, 166, 168, 173, 174, 175, 179, 182, 190, 191,
        193, 201, 205, 209, 210, 211, 213, 219, 220, 221, 225, 227, 232,
        234, 235, 237, 240, 242, 246, 249, 250, 251, 252, 258, 260, 261,
        262, 266, 267, 268, 272, 273, 274, 276, 277, 279, 280, 281, 290,
        293, 294, 295, 297, 301, 303, 307, 311, 314, 315, 323, 325, 328,
        331, 333, 336, 339, 341, 342, 348, 354, 355, 356, 357, 360, 361,
        364, 365, 372, 373, 374, 375, 376, 380, 382, 385, 388, 390, 391,
        397, 398, 400, 404, 408, 412, 413, 415, 416, 419, 420, 423, 425,
        426, 429, 434, 435, 436, 438, 440, 443, 444, 445, 452, 453, 454,
        456, 462, 463, 476, 480, 481, 482, 483, 489, 490, 491, 492, 494,
        495, 497, 498, 502, 508, 515, 516, 519, 523, 525, 528, 536, 543,
        545, 546, 557, 559, 561, 563, 564, 565, 567, 568, 573, 575, 576,
        580, 581, 583, 586, 589, 591, 592, 594, 596, 597, 598, 599, 601,
        603, 605, 607, 609, 610, 617, 628, 633, 635, 636, 637, 642, 645,
        647, 655, 660, 662, 664, 667, 668, 669, 673, 675, 676, 678, 681,
        684, 691, 693, 699, 704, 708, 709, 710, 713, 714, 716, 718, 722,
        726, 727, 729, 736, 748, 751, 754, 758, 762, 770, 772, 773, 775,
        777, 780, 783, 789, 792, 794, 796, 799, 800, 806, 807, 808, 809,
        813, 815, 818, 820, 822, 823, 827, 828, 833, 837, 838, 844, 846,
        848, 851, 855, 861, 863, 869, 870, 873, 880, 886, 887, 890, 892,
        900, 902, 905, 906, 910, 911, 912, 913, 920, 930, 931, 932, 935,
        936, 937, 941, 943, 944, 947, 948, 949, 951, 952, 957, 959, 962,
        971, 973, 976, 996], dtype=int64),)
四、准备数据:归一化
补充:np.tile()的用法:
a=np.array([[3,5,2],[6,4,1]])
a.min(0)
array([3, 4, 1])
np.tile(a.min(0),(2,1))
array([[3, 4, 1],
       [3, 4, 1]])
- 剔除数值绝对大小的规模因素:在处理这种不同取值范围的特征值时,我们通常就需要采用归一化,如将取值范围处理为0到1或者-1到1之间。下面的公式可以将任意取值范围的特征值转化为0-到1区间的值:
n e w V a l u e = ( o l d V a l u e − m i n ) / ( m a x − m i n ) newValue = (oldValue - min) / (max - min) newValue=(oldValue−min)/(max−min)
自动归一化函数,添加到KNN.py:
def autoNorm(dataSet):
    minVals=dataSet.min(0)------# 存储每列的最小值
    maxVals=dataSet.max(0)
    ranges=maxVals-minVals
    normDataSet=zeros(shape(dataSet))
    m=dataSet.shape[0] ----------m为dataset的行数
    normDataSet=dataSet-tile(minVals,(m,1))
    normDataSet=normDataSet/tile(ranges,(m,1))
    return normDataSet,ranges,minVals'''
importlib.reload(KNN)
normMat,ranges,minVals=KNN.autoNorm(datingDataMat)
normMat  #每个元素都进行了归一化
array([[0.44832535, 0.39805139, 0.56233353],
       [0.15873259, 0.34195467, 0.98724416],
       [0.28542943, 0.06892523, 0.47449629],
       ...,
       [0.29115949, 0.50910294, 0.51079493],
       [0.52711097, 0.43665451, 0.4290048 ],
       [0.47940793, 0.3768091 , 0.78571804]])
ranges
array([9.1273000e+04, 2.0919349e+01, 1.6943610e+00])
minVals
array([0. , 0. , 0.001156])
五、测试算法:作为完整程序验证分类器
- 计算分类的错误率:取样本数据的10%作为测试数据,剩下90%作为参考样本,先利用classify0()函数计算出这10%个数据点的分类
- 再将计算出来的分类与它本身的label进行对比,若错了一个,则在计数器中加1,最后计数器统计出错误的总数,再计算错误率。
def datingClassTest():
    hoRatio = 0.10---------10%的样本数据
    datingDataMat,datingLabels=KNN.file2matrix(r"D:\《机器学习实战》高清中文版PDF+高清英文版PDF+源代码\《机器学习实战》高清中文版PDF+高清英文版PDF+源代码\机器学习实战(源代码)\Ch02\datingTestSet2.txt")       #load data setfrom file
    normMat, ranges, minVals = autoNorm(datingDataMat)
    m = normMat.shape[0]
    numTestVecs = int(m*hoRatio)
    errorCount = 0.0
    for i in range(numTestVecs):
        classifierResult = classify0(normMat[i,:],normMat[numTestVecs:m,:],datingLabels[numTestVecs:m],3)-------k=3
        print ("the classifier came back with: %d, the real answer is: %d" % (classifierResult, datingLabels[i]))
        if (classifierResult != datingLabels[i]): errorCount += 1.0
    print ("the total error rate is: %f" % (errorCount/float(numTestVecs)))
    print errorCount
importlib.reload(KNN)
KNN.datingClassTest()
(改变hoRatio和k,监测错误率是否随之增加而增加)
上面的运行结果最后几行:
'''
the classifier came back with: 1, the real answer is: 1
the classifier came back with: 3, the real answer is: 3
the classifier came back with: 1, the real answer is: 1
the classifier came back with: 2, the real answer is: 1
the classifier came back with: 2, the real answer is: 2
the classifier came back with: 1, the real answer is: 1
the classifier came back with: 1, the real answer is: 1
the classifier came back with: 2, the real answer is: 2
the total error rate is: 0.066000
33.0
'''
六、构建完整可用系统
- 构建一个程序,使得输入进去一个新的数据点,就能判断它的类别。(跟原样本数据进行距离判断)
def classifyPerson():
    resultList = ['一点也不喜欢','有一丢丢喜欢','灰常喜欢']
    percentTats = float(input("玩视频所占的时间比?"))
    miles = float(input("每年获得的飞行常客里程数?"))
    iceCream = float(input("每周所消费的冰淇淋公升数?"))
    datingDataMat,datingLabels = file2matrix(r"D:\《机器学习实战》高清中文版PDF+高清英文版PDF+源代码\《机器学习实战》高清中文版PDF+高清英文版PDF+源代码\机器学习实战(源代码)\Ch02\datingTestSet2.txt")
    normMat,ranges,minVals = autoNorm(datingDataMat)
    inArr = array([miles,percentTats,iceCream])
    classifierResult = classify0((inArr-minVals)/ranges,normMat,datingLabels,3)-----新数据inArr的归一化,也是用的样本数据的minVals和ranges
    print("你对这个人的喜欢程度:",resultList[classifierResult - 1])
importlib.reload(KNN)
KNN.classifyPerson()
玩视频所占的时间比?20
每年获得的飞行常客里程数?4000
每周所消费的冰淇淋公升数?1
你对这个人的喜欢程度: 灰常喜欢

