布局效果:
1)设置垂直方向的三个div,宽度均设为100%,里面文字居中
2)设置水平方向的div,利用float:left;使其水平排列
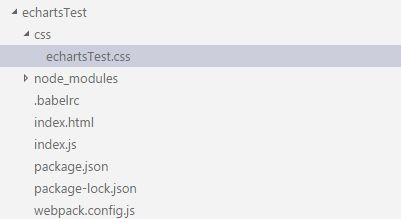
代码结构:
1)入口 index.html
2)index.js
import echarts from 'echarts';
/*日历*/
var graphData = [
[
1485878400000,
260
],
[
1486137600000,
200
],
[
1486569600000,
279
],
[
1486915200000,
847
],
[
1487347200000,
241
],
[
1487779200000 + 3600 * 24 * 1000 * 15,
411
],
[
1488124800000 + 3600 * 24 * 1000 * 23,
985
]
];
var links = graphData.map(function (item, idx) {
return {
source: idx,
target: idx + 1
};
});
links.pop();
function getVirtulData(year) {
year = year || '2017';
var date = +echarts.number.parseDate(year + '-01-01');
var end = +echarts.number.parseDate((+year + 1) + '-01-01');
var dayTime = 3600 * 24 * 1000;
var data = [];
for (var time = date; time < end; time += dayTime) {
data.push([
echarts.format.formatTime('yyyy-MM-dd', time),
Math.floor(Math.random() * 1000)
]);
}
return data;
}
var calendarChart = echarts.init(document.getElementById('calendar'));
calendarChart.setOption({
tooltip : {},
calendar: {
top: 'middle',
left: 'center',
orient: 'vertical',
cellSize: 40,
yearLabel: {
margin: 50,
textStyle: {
fontSize: 30
}
},
dayLabel: {
firstDay: 1,
nameMap: 'cn'
},
monthLabel: {
nameMap: 'cn',
margin: 15,
textStyle: {
fontSize: 20,
color: '#999'
}
},
range: ['2017-02', '2017-03-31']
},
visualMap: {
min: 0,
max: 1000,
type: 'piecewise',
left: 'center',
bottom: 20,
inRange: {
color: ['#5291FF', '#C7DBFF']
},
seriesIndex: [1],
orient: 'horizontal'
},
series: [{
type: 'graph',
edgeSymbol: ['none', 'arrow'],
coordinateSystem: 'calendar',
links: links,
symbolSize: 15,
calendarIndex: 0,
itemStyle: {
normal: {
color: 'yellow',
shadowBlue: 9,
shadowOffsetX: 1.5,
shadowOffsetY: 3,
shadowColor: '#555'
}
},
lineStyle: {
normal: {
color: '#D10E00',
width: 1,
opacity: 1
}
},
data: graphData,
z: 20
}, {
type: 'heatmap',
coordinateSystem: 'calendar',
data: getVirtulData(2017)
}]
});
/*折线/柱状图 */
var category = [];
var dottedBase = +new Date();
var lineData = [];
var barData = [];
for (var i = 0; i < 20; i++) {
var date = new Date(dottedBase += 3600 * 24 * 1000);
category.push([
date.getFullYear(),
date.getMonth() + 1,
date.getDate()
].join('-'));
var b = Math.random() * 200;
var d = Math.random() * 200;
barData.push(b)
lineData.push(d + b);
}
var barChart = echarts.init(document.getElementById('bar'));
barChart.setOption({
backgroundColor: '#0f375f',
tooltip: {
trigger: 'axis',
axisPointer: {
type: 'shadow'
}
},
legend: {
data: ['line', 'bar'],
textStyle: {
color: '#ccc'
}
},
xAxis: {
data: category,
axisLine: {
lineStyle: {
color: '#ccc'
}
}
},
yAxis: {
splitLine: {show: false},
axisLine: {
lineStyle: {
color: '#ccc'
}
}
},
series: [{
name: 'line',
type: 'line',
smooth: true,
showAllSymbol: true,
symbol: 'emptyCircle',
symbolSize: 15,
data: lineData
}, {
name: 'bar',
type: 'bar',
barWidth: 10,
itemStyle: {
normal: {
barBorderRadius: 5,
color: new echarts.graphic.LinearGradient(
0, 0, 0, 1,
[
{offset: 0, color: '#14c8d4'},
{offset: 1, color: '#43eec6'}
]
)
}
},
data: barData
}, {
name: 'line',
type: 'bar',
barGap: '-100%',
barWidth: 10,
itemStyle: {
normal: {
color: new echarts.graphic.LinearGradient(
0, 0, 0, 1,
[
{offset: 0, color: 'rgba(20,200,212,0.5)'},
{offset: 0.2, color: 'rgba(20,200,212,0.2)'},
{offset: 1, color: 'rgba(20,200,212,0)'}
]
)
}
},
z: -12,
data: lineData
}, {
name: 'dotted',
type: 'pictorialBar',
symbol: 'rect',
itemStyle: {
normal: {
color: '#0f375f'
}
},
symbolRepeat: true,
symbolSize: [12, 4],
symbolMargin: 1,
z: -10,
data: lineData
}]
});
/*仪表盘 */
var gaugeChart = echarts.init(document.getElementById('gauge'));
var gaugeOption = {
tooltip : {
formatter: "{a}
{b} : {c}%"
},
toolbox: {
feature: {
restore: {},
saveAsImage: {}
}
},
series: [
{
name: '业务指标',
type: 'gauge',
detail: {formatter:'{value}%'},
data: [{value: 50, name: '完成率'}]
}
]
};
gaugeChart.setOption(gaugeOption);
//定时任务,两秒修改一次
setInterval(function () {
console.log(gaugeOption);
// let option = gaugeChart.option;
gaugeOption.series[0].data[0].value = (Math.random() * 100).toFixed(2) - 0;
gaugeChart.setOption(gaugeOption, true);
},2000);
3)echartsTest.css
/*主面板样式*/
#container {
height:800px;
margin:0px auto;/*主面板DIV居中*/
}
/*顶部面板样式*/
#header {
width:100%;
height:150px;
border:1px #F00 solid;
text-align:center; /*水平居中*/
line-height:150px; /*垂直居中,文字与div高度一致*/
font-size: 40px;
font-family: Arial;
}
/*中间部分面板样式*/
#main {
width:100%;
height:550px;
border:1px #F00 solid;
}
/*底部面板样式*/
#footer {
width:100%;
height:100px;
border:1px #F00 solid;
text-align:center; /*水平居中*/
line-height:100px; /*垂直居中,文字与div高度一致*/
font-size: 40px;
font-family: Arial;
}
.cat, .sidebar {
float:left;
width:30%;
height:100%;
}
.content {
float:left;
width:40%;
height:100%;
}

