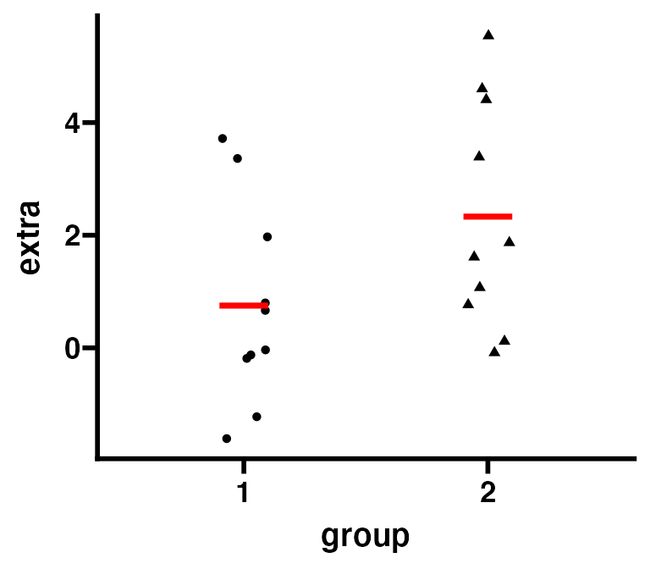
可以说GraphPad Prism最受欢迎的功能之一是在绘图中添加p值,
ggprism使用add_pvalue()添加带括号或不带括号的p值;喜欢的小伙伴可以关注我的公众号R语言数据分析指南持续分析更多优质资源
library(tidyverse)
library(ggprism)
library(patchwork)
library(magrittr)
p <- ggplot(sleep, aes(x = group, y = extra)) +
  geom_jitter(aes(shape = group), width = 0.1) +
  stat_summary(geom = "crossbar", fun = mean,
colour = "red", width = 0.2) +
  theme_prism() +
  theme(legend.position = "none")
p
接下来,我们将执行t检验,并为两个均值之差获得p值
result <- t.test(extra ~ group,data = sleep)$p.value %>%
  signif(digits = 3)

result
# [1] 0.0794
现在,我们将构造一个p值data.frame供add_pvalue()使用
df_p_val <- data.frame(
  group1 = "1",
  group2 = "2",
  label = result,
  y.position = 6
)
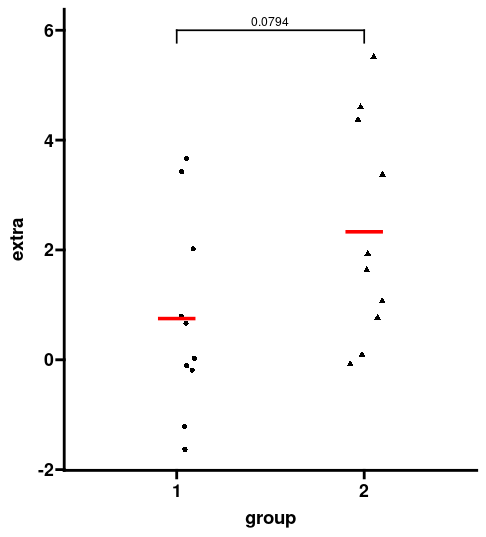
有括号版
p1 <- p + add_pvalue(df_p_val,
                     xmin = "group2",
                     xmax = "group1",
                     label = "label",
                     y.position = "y.position")

p1
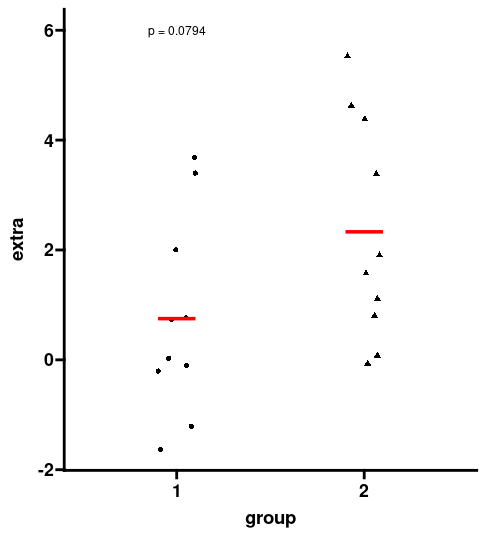
无括号版
p2 <- p + add_pvalue(df_p_val, label = "p = {label}",
                     remove.bracket = TRUE, x = 1)
p2
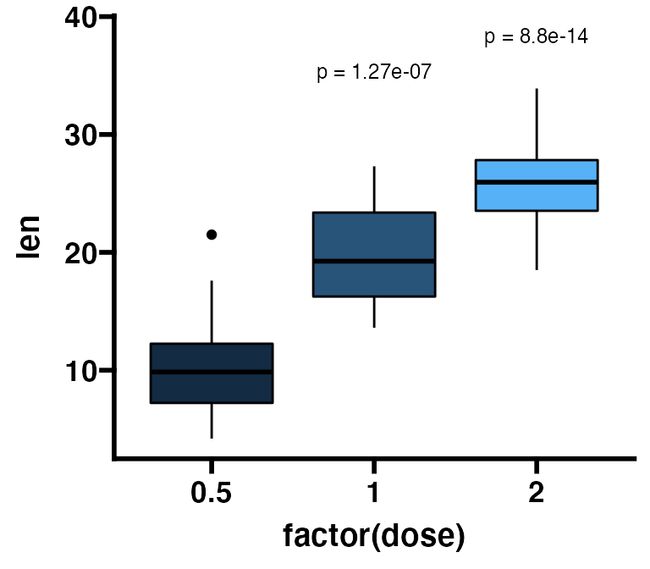
ToothGrowth数据集示例
p <- ggplot(ToothGrowth, aes(x = factor(dose), y = len)) +
  geom_boxplot(aes(fill = dose), colour = "black") +
  theme_prism() +
  theme(legend.position = "none")
p
接下来对数据执行两次t检验,并将均值dose = 0.5作为参考组进行比较;并对P值进行多重矫正
result1 <- t.test(len ~ dose,
                  data = subset(ToothGrowth,
dose %in% c(0.5, 1.0)))$p.value

result2 <- t.test(len ~ dose,
                  data = subset(ToothGrowth,
dose %in% c(0.5, 2.0)))$p.value

result <- p.adjust(c(result1, result2), method = "BH")
构建P值表
df_p_val <- data.frame(
  group1 = c(0.5, 0.5),
  x = c(2, 3),
  label = signif(result, digits = 3),
  y.position = c(35, 35)
)
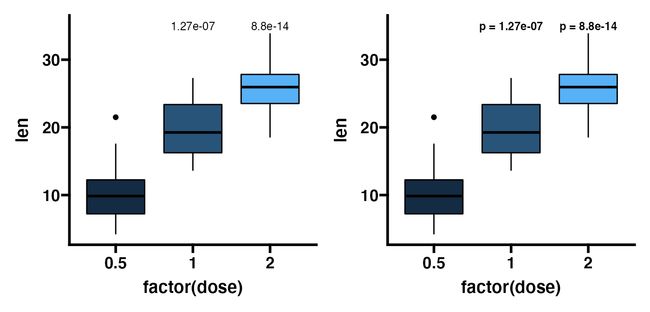
添加p值
p1 <- p + add_pvalue(df_p_val,
               xmin = "group1",
               x = "x",
               label = "label",
               y.position = "y.position")

p2 <- p + add_pvalue(df_p_val,
               xmin = "group1",
               x = "x",
               label = "p = {label}",
               y.position = "y.position",
               label.size = 3.2,
               fontface = "bold")

p1 + p2
使用rstatix包计算p值
df_p_val <- rstatix::t_test(ToothGrowth,
len ~ dose, ref.group = "0.5") %>%
  rstatix::add_xy_position()

p + add_pvalue(df_p_val,
               label = "p = {p.adj}",
               remove.bracket = TRUE)
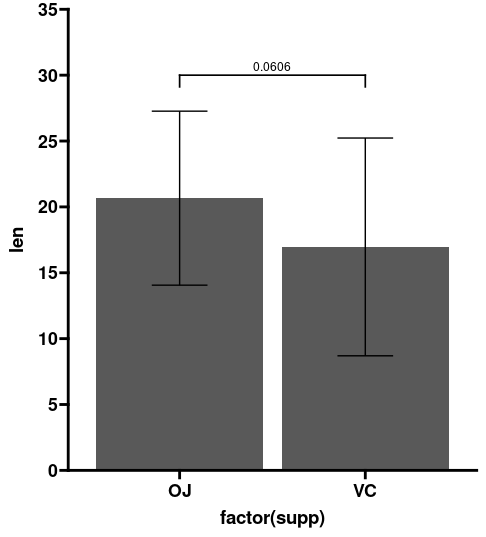
绘制误差线柱状图
df_p_val <- rstatix::t_test(ToothGrowth, len ~ supp) %>%
  rstatix::add_x_position()

p <- ggplot(ToothGrowth, aes(x = factor(supp), y = len)) +
  stat_summary(geom = "col", fun = mean) +
  stat_summary(geom = "errorbar",
               fun = mean,
               fun.min = function(x) mean(x) - sd(x),
               fun.max = function(x) mean(x) + sd(x),
               width = 0.3) +
  theme_prism() +
  coord_cartesian(ylim = c(0, 35)) +
  scale_y_continuous(breaks = seq(0, 35, 5), expand = c(0, 0))

p + add_pvalue(df_p_val, y.position = 30)
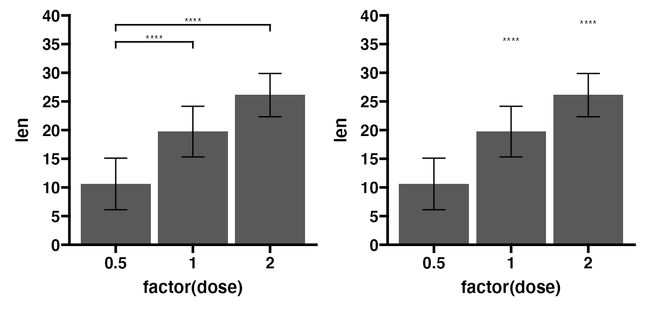
将len每个剂量的平均值与dose = 0.5进行比较,误差线表示与平均值的1个标准偏差
df_p_val <- rstatix::t_test(ToothGrowth,
len ~ dose, ref.group = "0.5") %>%
  rstatix::add_xy_position()

p <- ggplot(ToothGrowth, aes(x = factor(dose), y = len)) +
  stat_summary(geom = "col", fun = mean) +
  stat_summary(geom = "errorbar",
               fun = mean,
               fun.min = function(x) mean(x) - sd(x),
               fun.max = function(x) mean(x) + sd(x),
               width = 0.3) +
  theme_prism() +
  coord_cartesian(ylim = c(0, 40)) +
  scale_y_continuous(breaks = seq(0, 40, 5), expand = c(0, 0))

p1 <- p + add_pvalue(df_p_val, label = "p.adj.signif")

p2 <- p + add_pvalue(df_p_val, label = "p.adj.signif",
remove.bracket = TRUE)

p1 + p2
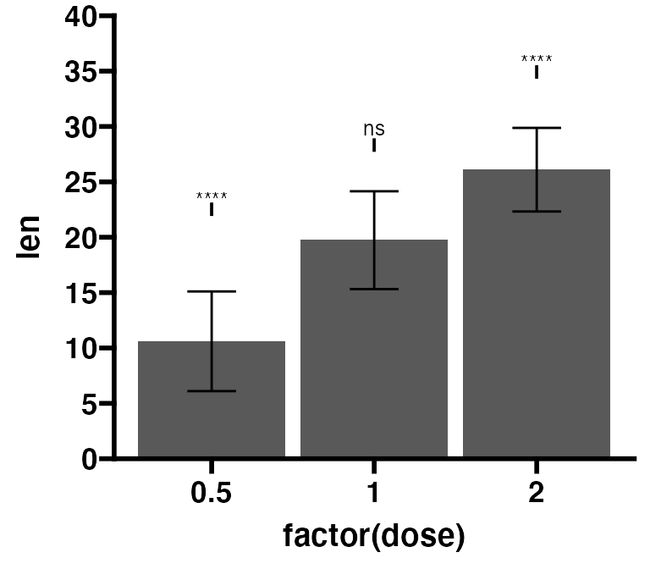
将总体均值len与dose进行比较
df_p_val <- rstatix::t_test(ToothGrowth, len ~ dose,
ref.group = "all") %>%
  rstatix::add_xy_position()

p <- ggplot(ToothGrowth, aes(x = factor(dose), y = len)) +
  stat_summary(geom = "col", fun = mean) +
  stat_summary(geom = "errorbar",
               fun = mean,
               fun.min = function(x) mean(x) - sd(x),
               fun.max = function(x) mean(x) + sd(x),
               width = 0.3) +
  theme_prism() +
  coord_cartesian(ylim = c(0, 40)) +
  scale_y_continuous(breaks = seq(0, 40, 5), expand = c(0, 0))

p + add_pvalue(df_p_val, label = "p.adj.signif")
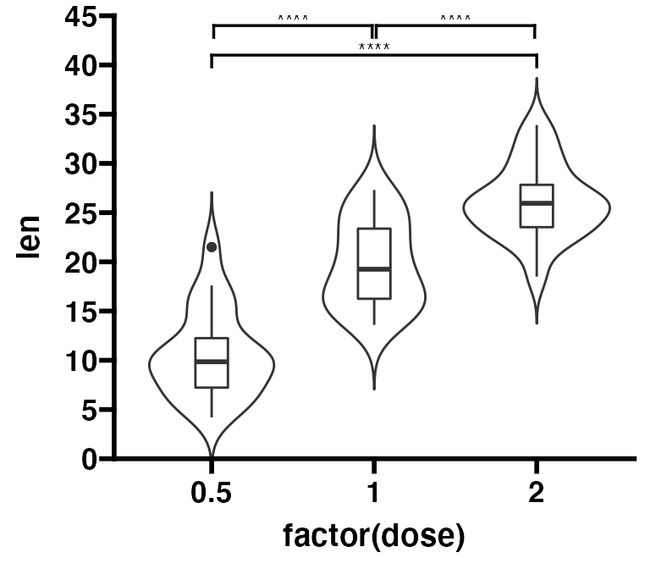
多个成对比较
df_p_val <- rstatix::t_test(ToothGrowth, len ~ dose)

p <- ggplot(ToothGrowth, aes(x = factor(dose), y = len)) +
  geom_violin(trim = FALSE) +
  geom_boxplot(width = 0.2) +
  theme_prism() +
  coord_cartesian(ylim = c(0, 45)) +
  scale_y_continuous(breaks = seq(0, 45, 5), expand = c(0, 0))

p + add_pvalue(df_p_val,
               y.position = c(44, 41, 44),
               bracket.shorten = c(0.025, 0, 0.025))
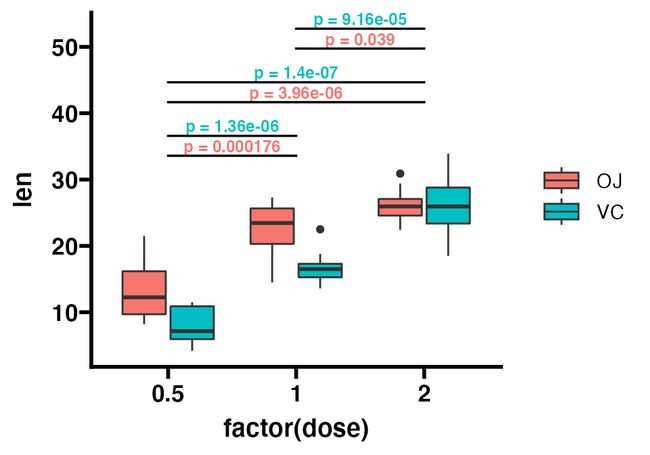
分组成对比较
df_p_val <- ToothGrowth %>%
  rstatix::group_by(supp) %>%
  rstatix::t_test(len ~ dose) %>%
  rstatix::add_xy_position()

p <- ggplot(ToothGrowth, aes(x = factor(dose), y = len)) +
  geom_boxplot(aes(fill = supp)) +
  theme_prism()

p + add_pvalue(df_p_val,
               label = "p = {p.adj}",
               colour = "supp",
               fontface = "bold",
               step.group.by = "supp",
               step.increase = 0.1,
               tip.length = 0,
               bracket.colour = "black",
               show.legend = FALSE)
df_p_val1 <- ToothGrowth %>%
  rstatix::group_by(dose) %>%
  rstatix::t_test(len ~ supp) %>%
  rstatix::adjust_pvalue(p.col = "p", method = "bonferroni") %>%
  rstatix::add_significance(p.col = "p.adj") %>%
  rstatix::add_xy_position(x = "dose", dodge = 0.8)

df_p_val2 <- rstatix::t_test(ToothGrowth, len ~ dose,
                             p.adjust.method = "bonferroni") %>%
  rstatix::add_xy_position()

p <- ggplot(ToothGrowth, aes(x = factor(dose), y = len)) +
  geom_boxplot(aes(fill = supp)) +
  theme_prism() +
  coord_cartesian(ylim = c(0, 45))

p + add_pvalue(df_p_val1,
               xmin = "xmin",
               xmax = "xmax",
               label = "p = {p.adj}",
               tip.length = 0) +
  add_pvalue(df_p_val2,
             label = "p = {p.adj}",
             tip.length = 0.01,
             bracket.nudge.y = 2,
             step.increase = 0.015)
分面
df_p_val <- ToothGrowth %>%
  rstatix::group_by(dose) %>%
  rstatix::t_test(len ~ supp) %>%
  rstatix::add_xy_position()

p <- ggplot(ToothGrowth, aes(x = factor(supp), y = len)) +
  geom_boxplot(width = 0.2) +
  facet_wrap(
    ~ dose, scales = "free",
    labeller = labeller(dose = function(x) paste("dose =", x))
) +
  theme_prism()

p + add_pvalue(df_p_val)
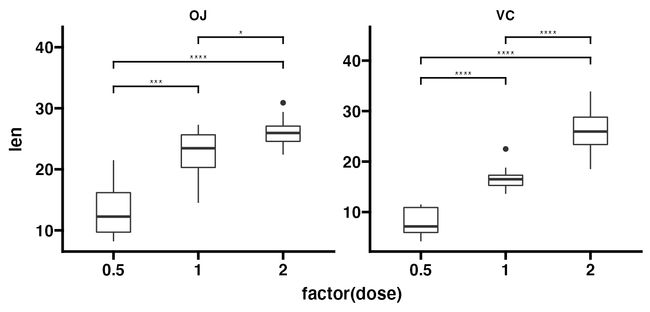
df_p_val <- ToothGrowth %>%
  rstatix::group_by(supp) %>%
  rstatix::t_test(len ~ dose) %>%
  rstatix::add_xy_position()

p <- ggplot(ToothGrowth, aes(x = factor(dose), y = len)) +
  geom_boxplot(width = 0.4) +
  facet_wrap(~ supp, scales = "free") +
  theme_prism()

p + add_pvalue(df_p_val)
