Python——matplotlib中的乱七八糟(二)【绘制多个子图,图中图,次坐标轴的使用】
1.绘制多个子图(四种方法)
import matplotlib.pyplot as plt
import matplotlib.gridspec as gridspec

############################### 方法 1:subplot()
'''
fig=plt.figure()


plt.subplot(2,2,1)#将figure分成两行两列,1代表的是第一个位置的图
plt.plot([0,3],[0,1])#分别为x的显示范围为0-3,y的坐标0-1

plt.subplot(2,2,2)#将figure分成两行两列,2代表的是第二个位置的图
plt.plot([0,3],[0,1])

plt.subplot(2,2,3)#将figure分成两行两列,3代表的是第三个位置的图
plt.plot([0,3],[0,1])

plt.subplot(2,2,4)#将figure分成两行两列,4代表的是第四个位置的图
plt.plot([0,3],[0,1])
'''

###########################方法 2:subplot2grid()
'''
plt.figure()
ax1=plt.subplot2grid((3,3),(0,0),colspan=3,rowspan=1)
#分成3行3列,从1行,1列的地方开始,colspan表示横跨3行,rowspan 表示跨一列

ax1.plot([1,2],[1,2])# 分别为x的显示范围为1-2,y的坐标1-2

ax1.set_title('ax1_title')

ax2=plt.subplot2grid((3,3),(1,0),colspan=2,rowspan=1)
ax3=plt.subplot2grid((3,3),(1,2),rowspan=2)
ax4=plt.subplot2grid((3,3),(2,0))
ax5=plt.subplot2grid((3,3),(2,1))
'''

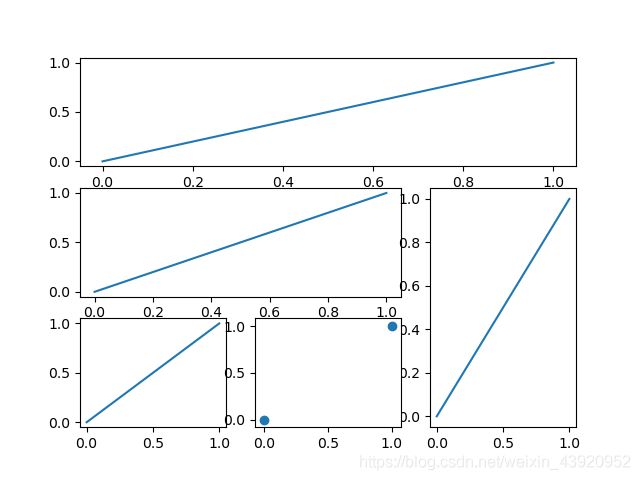
######################################## 方法 3:gridspec()

plt.figure()
gs=gridspec.GridSpec(3,3) #通过gridspec.GridSpec()创建区域

ax1=plt.subplot(gs[0,:])#[]里表示第1行全占
ax1.plot([0,1],[0,1])#绘制一个函数

ax2=plt.subplot(gs[1,:2])#第2行占前两列
ax2.plot([0,1],[0,1])

ax3=plt.subplot(gs[1:3,2])#第二行第3列列,占两行
ax3.plot([0,1],[0,1])

ax4=plt.subplot(gs[2,:1])#第3行,占第一列
ax4.plot([0,1],[0,1])

ax5=plt.subplot(gs[2,1:2])#第三行,占第二列
ax5.scatter([0,1],[0,1])


'''
################################################### 方法4:
#plt.figure()
f,((ax11,ax12),(ax21,ax22))=plt.subplots(2,2,sharex=True,sharey=True)
#plt.subplots传出来两个值,一是plt.figure,二是所有的两行两列的值
#sharex代表是否共用x轴,Ture是,False否,sharey同理


ax11.plot([1,2],[1,2])


plt.tight_layout()#tight_layout()
#作用是自动调整子图参数,使之填充整个图像区域。
'''

plt.show()
我现在用的是第三种方法,展示第三种方法的结果,可以自己每种方法都试试

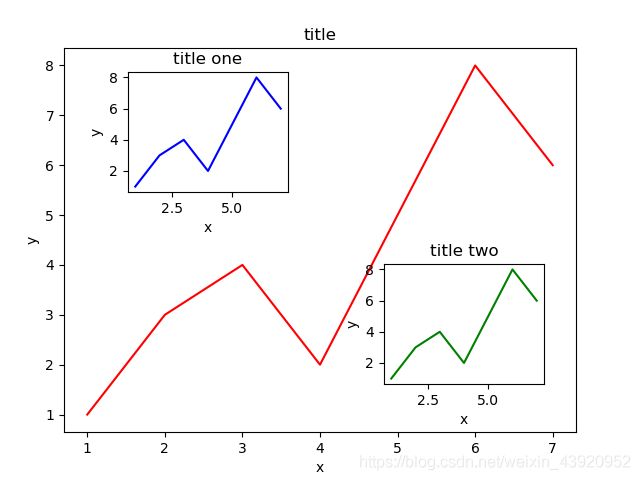
2.图中图
import matplotlib.pyplot as plt


fig=plt.figure()
x = [1,2,3,4,5,6,7]
y = [1,3,4,2,5,8,6]

#红色的那个函数
left,bottom,width,height=0.1,0.1,0.8,0.8#相对于figure的百分比
ax1=fig.add_axes([left,bottom,width,height])
ax1.plot(x,y,'r')# r是指红色
ax1.set_xlabel('x')#给x轴设置的标签
ax1.set_ylabel('y')#给y轴设置标签
ax1.set_title('title')#设置标题

#蓝色的那个函数
left,bottom,width,height=0.2,0.6,0.25,0.25#相对于figure的百分比
ax2=fig.add_axes([left,bottom,width,height])
ax2.plot(x,y,'b')
ax2.set_xlabel('x')
ax2.set_ylabel('y')
ax2.set_title('title one')

#绿色的那个函数
plt.axes([0.6,0.2,0.25,0.25])
plt.plot(x,y,'g')
plt.xlabel('x')
plt.ylabel('y')
plt.title('title two')


plt.show()
import matplotlib.pyplot as plt
import numpy as np

x=np.arange(0,10,0.1)
y1=0.05 * x**2
y2=2*x

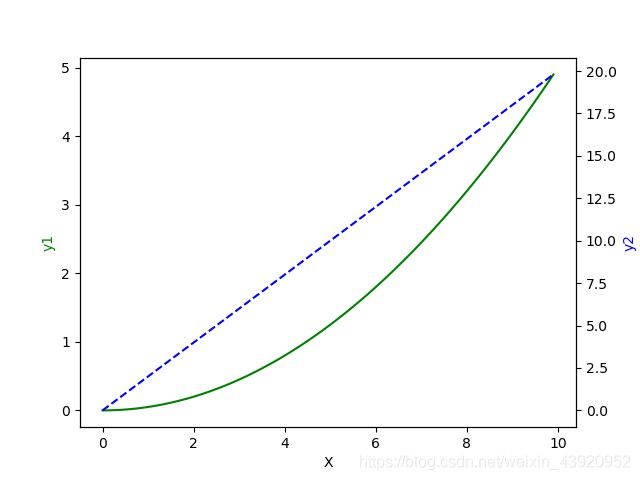
fig,ax1=plt.subplots()
ax2=ax1.twinx() #共享x轴,左右两边是y坐标轴
#可以换成twiny()试试哈,看看有什么效果

ax1.plot(x,y1,'g-')
ax2.plot(x,y2,'b--')

ax1.set_xlabel('X')
ax1.set_ylabel('y1',color='g')
ax2.set_ylabel('y2',color='b')


plt.show()

