1. 包导入
library(ggplot2)
library(reshape2)
2. 数据导入
mtcars
The data was extracted from the 1974 Motor Trend US magazine, and comprises fuel consumption and 10 aspects of automobile design and performance for 32 automobiles (1973–74 models).
library(ggplot2)
library(reshape2)
> head(mydata)
                   mpg disp  hp drat    wt  qsec
Mazda RX4         21.0  160 110 3.90 2.620 16.46
Mazda RX4 Wag     21.0  160 110 3.90 2.875 17.02
Datsun 710        22.8  108  93 3.85 2.320 18.61
Hornet 4 Drive    21.4  258 110 3.08 3.215 19.44
Hornet Sportabout 18.7  360 175 3.15 3.440 17.02
Valiant           18.1  225 105 2.76 3.460 20.22
3. 相关性系数矩阵计算
mydata_cor<-cor(mydata)
> mydata_cor
            mpg       disp         hp        drat         wt        qsec
mpg   1.0000000 -0.8475514 -0.7761684  0.68117191 -0.8676594  0.41868403
disp -0.8475514  1.0000000  0.7909486 -0.71021393  0.8879799 -0.43369788
hp   -0.7761684  0.7909486  1.0000000 -0.44875912  0.6587479 -0.70822339
drat  0.6811719 -0.7102139 -0.4487591  1.00000000 -0.7124406  0.09120476
wt   -0.8676594  0.8879799  0.6587479 -0.71244065  1.0000000 -0.17471588
qsec  0.4186840 -0.4336979 -0.7082234  0.09120476 -0.1747159  1.00000000
4. 使用ggplot2中geom_tile画热力图
#####使用melt整理数据格式
mydata_cor.m <-melt(mydata_cor)

> head(mydata_cor.m)
Var1 Var2 variable      value
1  mpg  mpg    value  1.0000000
2 disp  mpg    value -0.8475514
3   hp  mpg    value -0.7761684
4 drat  mpg    value  0.6811719
5   wt  mpg    value -0.8676594
6 qsec  mpg    value  0.4186840
绘制热图
p_cor <-ggplot(mydata_cor.m, aes(Var1, Var2)) +
  geom_tile(aes(fill = value),colour = "white")

p_cor + scale_fill_gradient(name="Value", low = "white",high = "red") +
  theme(axis.text.x = element_text(vjust = 0.5, hjust = 0.5, angle = 90))+
  coord_fixed(ratio=1)+
  theme(axis.text= element_text(size = 8,family="ARL"))+
  theme(plot.margin = unit(c(0.1,0,0,0), unit="mm"))+
  labs(x = "Var1", y = "Var2", title = "correlation")+
  theme(plot.title = element_text(size = 13,hjust = 0.5,family = "ARL" ))+
  theme(legend.key.width=unit(3,'mm'),legend.key.height=unit(3,'cm'))+
  theme(legend.title = element_text(size = 8))
5. 矩阵上三角和下三角的获取
可以发现共线性矩阵的左上和右下是一模一样的两部分;画出一部分
获取相关性矩阵的上三角矩阵
get_lower_tri<-function(cormat){
  cormat[upper.tri(cormat)] <- NA
  return(cormat)
}
#####获取相关性矩阵的下三角矩阵
get_upper_tri <- function(cormat){
  cormat[lower.tri(cormat)]<- NA
  return(cormat)
}
获取相关性矩阵的上三角矩阵
upper_tri <- get_upper_tri(mydata_cor)
upper_tri
   mpg       disp         hp       drat         wt        qsec
mpg    1 -0.8475514 -0.7761684  0.6811719 -0.8676594  0.41868403
disp  NA  1.0000000  0.7909486 -0.7102139  0.8879799 -0.43369788
hp    NA         NA  1.0000000 -0.4487591  0.6587479 -0.70822339
drat  NA         NA         NA  1.0000000 -0.7124406  0.09120476
wt    NA         NA         NA         NA  1.0000000 -0.17471588
qsec  NA         NA         NA         NA         NA  1.00000000
数据格式转换,并且删除无效值
upper_tri.m <- melt(upper_tri, na.rm = TRUE)
热力图绘制
p_cor.up <-ggplot(upper_tri.m, aes(Var1, Var2)) +
  geom_tile(aes(fill = value),colour = "white")

p_cor.up + scale_fill_gradient(name="Value", low = "white",high = "red") +
  theme(axis.text.x = element_text(vjust = 0.5, hjust = 0.5, angle = 90))+
  coord_fixed(ratio=1)+
  theme(axis.text= element_text(size = 8,family="ARL"))+
  theme(plot.margin = unit(c(0.1,0,0,0), unit="mm"))+
  labs(x = "Var1", y = "Var2", title = "correlation")+
  theme(plot.title = element_text(size = 13,hjust = 0.5,family = "ARL" ))+
  theme(legend.key.width=unit(3,'mm'),legend.key.height=unit(3,'cm'))+
  theme(legend.title = element_text(size = 8))
6. 对数据进行层次聚类
reorder_cormat <- function(cormat){
  dd <- as.dist((1-cormat)/2)  ##使用相关性系数作为变量间距离
  hc <- hclust(dd)
  cormat <-cormat[hc$order, hc$order]
}
利用相关性系数对变量进行聚类
mydata_cor.order <- reorder_cormat(mydata_cor)
order.upper_tri <- get_upper_tri(mydata_cor.order)
转换数据格式
order.upper_tri.m <- melt(order.upper_tri, na.rm = TRUE)
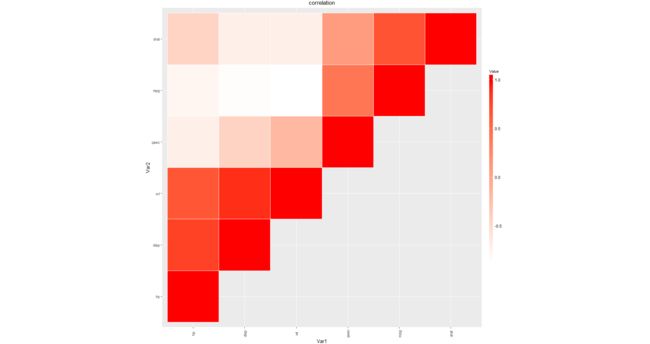
绘制热力图
p_cor.order <-ggplot(order.upper_tri.m, aes(Var1, Var2)) +
  geom_tile(aes(fill = value),colour = "white")

p_cor.order + scale_fill_gradient(name="Value", low = "white",high = "red") +
  theme(axis.text.x = element_text(vjust = 0.5, hjust = 0.5, angle = 90))+
  coord_fixed(ratio=1)+
  theme(axis.text= element_text(size = 8,family="ARL"))+
  theme(plot.margin = unit(c(0.1,0,0,0), unit="mm"))+
  labs(x = "Var1", y = "Var2", title = "correlation")+
  theme(plot.title = element_text(size = 13,hjust = 0.5,family = "ARL" ))+
  theme(legend.key.width=unit(3,'mm'),legend.key.height=unit(3,'cm'))+
  theme(legend.title = element_text(size = 8))
7. 在热力图上添加相关性注释
p_cor.order + scale_fill_gradient(name="Value", low = "white",high = "red") +
  theme(axis.text.x = element_text(vjust = 0.5, hjust = 0.5, angle = 90))+
  coord_fixed(ratio=1)+
  theme(axis.text= element_text(size = 8,family="ARL"))+
  theme(plot.margin = unit(c(0.1,0,0,0), unit="mm"))+
  labs(x = "Var1", y = "Var2", title = "correlation")+
  theme(plot.title = element_text(size = 13,hjust = 0.5,family = "ARL" ))+
  theme(legend.key.width=unit(3,'mm'),legend.key.height=unit(3,'cm'))+
  theme(legend.title = element_text(size = 8))+
  geom_text(aes(Var1, Var2, label = value), color = "black", size = 3)
参考:
ggplot2 : Quick correlation matrix heatmap


