Vue+DHTMLX Gantt(甘特图)的使用方法
如何使用Vue跟DHTMLX Gantt做甘特图?
附上官方使用介绍:https://dhtmlx.com/blog/use-dhtmlxgantt-vue-js-framework-demo/
我们就先做个简单的demo吧!
一:安装依赖
//(for yarn)
yarn add dhtmlx-gantt --save

//(for npm)
npm install dhtmlx-gantt --save
二:创建一个gantt.vue组件
<template>
  <div ref="gantt" class="left-container"></div>
</template>

<script>
  import {
     gantt} from 'dhtmlx-gantt';
  import "dhtmlx-gantt/codebase/dhtmlxgantt.css"
  export default {

    name: "gantt",
    props: {

      tasks: {

        type: Object,
        default () {

          return {
     data: [], links: []}
        }
      }
    },
    mounted: function () {

      gantt.config.xml_date = "%Y-%m-%d";

      gantt.init(this.$refs.gantt);
      gantt.parse(this.$props.tasks);

    }
  }
</script>

<style scoped>
  /*@import "dhtmlx-gantt/codebase/dhtmlxgantt.css"*/
  .left-container {

    height: 600px;
  }
</style>
三:创建ganttNeed.vue组件
<template>
  <div class="container">
    <gantt class="left-container" :tasks="tasks"></gantt>
  </div>
</template>

<script>
  import gantt from './gantt.vue';

  export default {

    name: 'ganttNeed',
    components: {
     gantt},
    data () {

      return {

        tasks: {

          data: [
            {
     id: 1, text: 'Task #1', start_date: '2020-01-17', duration: 3, progress: 0.6},
            {
     id: 2, text: 'Task #2', start_date: '2020-01-20', duration: 3, progress: 0.4}
          ],
          links: [
            {
     id: 1, source: 1, target: 2, type: '0'}
          ]
        },
      }
    }
  }
</script>

<style>
  html, body {

    height: 100%;
    margin: 0;
    padding: 0;
  }
  .container {

    height: 100%;
    width: 100%;
  }
  .left-container {

    overflow: hidden;
    position: relative;
    height: 100%;
  }
</style>
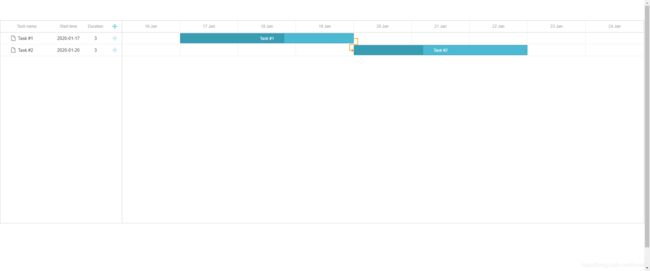
现在我们可以看下效果,如下图。
!!!当然还可以放在一个组件里边使用
<template>
  <div style="padding: 10px;">
    <h2 style="text-align: center">Gantt echart</h2>
    <div class="app-container">
      <div ref="gantt" class="left-container"/>
    </div>
  </div>
</template>

<script>
  import gantt from 'dhtmlx-gantt'  // 引入模块
  import 'dhtmlx-gantt/codebase/dhtmlxgantt.css'
  // import 'dhtmlx-gantt/codebase/locale/locale_cn'  // 本地化
  export default {

    name: "ganttEchart",
    data() {

      return {

        tasks: {

          data: [
            {
      id: 1, text: 'Task #1', start_date: '2020-12-15', personName: '张总', duration: 3, progress: 0.6 ,color:"#6BC172"},
            {
      id: 2, text: 'Task #2', start_date: '2020-12-18', personName: '李总', duration: 6, progress: 0.4 ,color:"#6BC172"},
            {
      id: 3, text: 'Task #2-1', start_date: '2020-12-18', personName: '赵总', duration: 3, progress: 0.2, parent: 2 },
            {
      id: 4, text: 'Task #2-2', start_date: '2020-12-21', personName: '赵总', duration: 3, progress: 0, parent: 2 }
          ],
          links: [
            {
      id: 1, source: 1, target: 2, type: '0' }
          ]
        }
      }
    },
    mounted() {

      gantt.config.xml_date = "%Y-%m-%d";
      // 在时间线上增加一行年份显示
      gantt.config.subscales = [
        {

          unit: 'year',
          step: 1,
          date: '%Y'
        }
      ]
      // 初始化
      gantt.init(this.$refs.gantt);
      // 数据解析
      gantt.parse(this.tasks);


    }
  }
</script>

<style scoped>
  .left-container {

    height: 600px;
  }
</style>
效果图如下
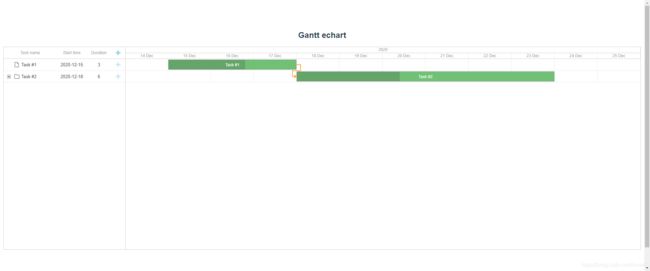
这样一个简单的基础甘特图就齐活儿啦!
监听变化,处理事件可以查看官方文档哦!