梯度下降及线性回归详解
梯度下降及线性回归详解
- 一. 一元线性回归
-
- 1 摘要
- 2 什么是回归分析
- 3 如何拟合这条直线(方法)
- 4 最小二乘法
-
- 4.1 基本思想
- 4.2 推导过程
- 4.3 代码
- 4.4 输出结果
- 5 梯度下降算法
-
- 5.1 目标/损失函数
- 5.2 梯度下降三兄弟(BGD,SGD, MBGD)
-
- 5.2.1 批量梯度下降法(Batch Gradient Descent)
- 5.2.2 随机梯度下降法(Stochastic Gradient Descent)
- 5.2.3小批量梯度下降法(Mini-batch Gradient Descent)
- 5.3 梯度下降法的一般步骤
- 5.4 一元线性回归函数推导过程
- 5 (例子)波士顿房价预测
-
- 5.1 代码实现(Python)
- 5.2 输出结果
- 二. 多元线性回归
-
- 1 定义数据
- 3 定义函数
- 4 梯度下降
- 6 (例子)鸢尾花数据集
-
- 6.1 代码实现(Python)
- 6.2 输出结果
- 三.三种数据集
-
- 1 训练集
- 2 验证集
- 3 测试集
- 4 三者区别
- 5 交叉验证
- 四.回归模型评价指标
一. 一元线性回归
1 摘要
一元线性回归可以说是数据分析中非常简单的一个知识点,有一点点统计、分析、建模经验的人都知道这个分析的含义,也会用各种工具来做这个分析。这里面想把这个分析背后的细节讲讲清楚,也就是后面的数学原理。
2 什么是回归分析
回归分析(Regression Analysis)是确定两种或两种以上变量间相互依赖的定量关系的一种统计分析方法。在回归分析中,只包括一个自变量和一个因变量,且二者的关系可用一条直线近似表示,这种回归分析称为一元线性回归分析。如果回归分析中包括两个或两个以上自变量,且自变量和因变量之间是线性关系,则称为多元线性回归分析。我们先学习一元线性回归分析,举个例子来说吧:
比方说有一个公司,每月的广告费用和销售额,如下表所示:

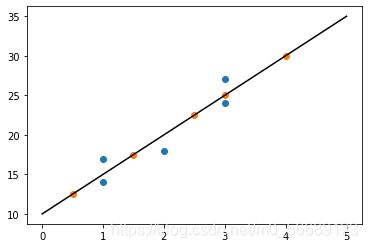
如果我们把广告费和销售额画在二维坐标内,就能够得到一个散点图,如果想探索广告费和销售额的关系,就可以利用一元线性回归做出一条拟合直线 y ^ = ω x + b \hat{y}=\omega x+b y^=ωx+b如图:
 我们拟合出直线后可对广告费和销售额进行预测,这是一个应用
3 如何拟合这条直线(方法)
最常用的有最小二乘法和梯度下降算法,下面我们分别讲讲最小二乘法和梯度下降算法,主要讲解梯度下降算法
4 最小二乘法
4.1 基本思想
求出这样一些未知参数使得样本点和拟合线的总误差(距离)最小最直观的感受如下图(图引用自知乎某作者)
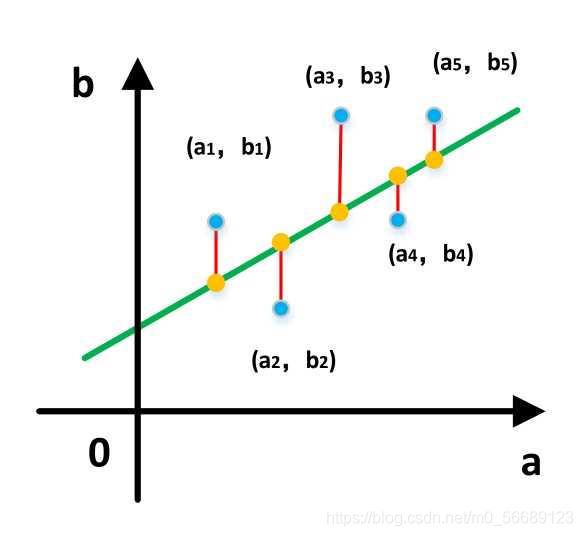
而这个误差(距离)可以直接相减,但是直接相减会有正有负,相互抵消了,所以就用差的平方
4.2 推导过程
4.3 代码
import numpy as np
from matplotlib import pylab as pl
#Defining training data
x = np.array([1,3,2,1,3])
y = np.array([14,24,18,17,27])
# The regression equation takes the function
def fit(x,y):
    if len(x) != len(y):
        return
    numerator = 0.0
    denominator = 0.0
    x_mean = np.mean(x)
    y_mean = np.mean(y)
    for i in range(len(x)):
        numerator += (x[i]-x_mean)*(y[i]-y_mean)
        denominator += np.square((x[i]-x_mean))
    print('numerator:',numerator,'denominator:',denominator)
    b0 = numerator/denominator
    b1 = y_mean - b0*x_mean
    return b0,b1
# Define prediction function
def predit(x,b0,b1):
    return b0*x + b1
# Find the regression equation
b0,b1 = fit(x,y)
print('Line is:y = %2.0fx + %2.0f'%(b0,b1))
# prediction
x_test = np.array([0.5,1.5,2.5,3,4])
y_test = np.zeros((1,len(x_test)))
for i in range(len(x_test)):
    y_test[0][i] = predit(x_test[i],b0,b1)
# Drawing figure
xx = np.linspace(0, 5)
yy = b0*xx + b1
pl.plot(xx,yy,'k-')
pl.scatter(x,y,cmap=pl.cm.Paired)
pl.scatter(x_test,y_test[0],cmap=pl.cm.Paired)
pl.show()
4.4 输出结果
5 梯度下降算法
学习梯度下降算法大家可以看我的博客,梯度下降算法
https://editor.csdn.net/md/?articleId=115729027
我们现在需要将梯度下降算法应用进线性回归中去,我们还需要学习下面内容
5.1 目标/损失函数
损失函数用来评价模型的预测值和真实值不一样的程度,损失函数越好, 通常模型的性能越好。不同的模型用的损失函数一般也不一样。在应用中,通常通过最小化损失函数求解和评估模型。
求解最佳参数,需要一个标准来对结果进行衡量,为此我们需要定量化一 个目标函数式,使得计算机可以在求解过程中不断地优化。
针对任何模型求解问题,都是最终都是可以得到一组预测值 y ^ \hat{y} y^,对比已有的真实值 y y y,数据行数为 n n n,可以将损失函数定义如下: L = 1 n ∑ i = 1 n ( y ^ i − y i ) 2 L=\frac{1}{n}\sum_{i=1}^{n}(\hat{y}_i-y_i)^2 L=n1i=1∑n(y^i−yi)2
即预测值与真实值之间的平均的平方距离,统计中一般称其为MAE(mean square error)均方误差。把之前的函数式代入损失函数,并且将需要求解 的参数w和b看做是函数L的自变量,可得: L ( w , b ) = 1 n ∑ i = 1 n ( w x i + b − y i ) 2 L(w,b)=\frac{1}{n}\sum_{i=1}^{n}(wx_i+b-y_i)^2 L(w,b)=n1i=1∑n(wxi+b−yi)2
现在的任务是求解最小化 L L L时 w w w和 b b b的值,
即核心目标优化式为: ( w ∗ , b ∗ ) = arg min ( w , b ) ∑ i = 1 n ( w x i + b − y i ) 2 (w^*,b^*)=\arg\min_{(w,b)}\sum_{i=1}^{n}(wx_i+b-y_i)^2 (w∗,b∗)=arg(w,b)mini=1∑n(wxi+b−yi)2
5.2 梯度下降三兄弟(BGD,SGD, MBGD)
我们在用梯度下降算法解决线性回归问题时需要采用数据集
现在有三种不同的采用方式,因此也产生了三种不同的梯度下降算法
- 下面涉及到数据集名词,可结合本篇内容三理解
5.2.1 批量梯度下降法(Batch Gradient Descent)
批量梯度下降法每次都使用训练集中的所有样本更新参数。它得到的是一 个全局最优解,但是每迭代一步,都要用到训练集所有的数据,如果m很 大,那么迭代速度就会变得很慢。 优点:可以得出全局最优解。 缺点:样本数据集大时,训练速度慢
5.2.2 随机梯度下降法(Stochastic Gradient Descent)
随机梯度下降法每次更新都从样本随机选择1组数据,因此随机梯度下降比 批量梯度下降在计算量上会大大减少。SGD有一个缺点是,其噪音较BGD 要多,使得SGD并不是每次迭代都向着整体最优化方向。而且SGD因为每 次都是使用一个样本进行迭代,因此最终求得的最优解往往不是全局最优 解,而只是局部最优解。但是大的整体的方向是向全局最优解的,最终的 结果往往是在全局最优解附近。 优点:训练速度较快。 缺点:过程杂乱,准确度下降。
5.2.3小批量梯度下降法(Mini-batch Gradient Descent)
小批量梯度下降法对包含n个样本的数据集进行计算。综合了上述两种方 法,既保证了训练速度快,又保证了准确度。
5.3 梯度下降法的一般步骤
假设函数: y = f ( x 1 , x 2 , x 3 . . . . x n ) y=f(x_1,x_2,x_3....x_n) y=f(x1,x2,x3....xn) 只有一个极小点。
初始给定参数为 X 0 = ( x 1 0 , x 2 0 , x 3 0.... x n 0 ) X_0=(x_10,x_20,x_30....x_n0) X0=(x10,x20,x30....xn0) 。
从这个点如何搜索才能找到 原函数的极小值点?
方法:
①首先设定一个较小的正数 α , ε \alpha,\varepsilon α,ε;
②求当前位置出处的各个偏导数: f ′ ( x m 0 ) = ∂ y ∂ x m ( x m 0 ) , m = 1 , 2 , . . . , n f^{'}(x_{m0})=\frac{\partial y}{\partial x_m}(x_{m0}),m=1,2,...,n f′(xm0)=∂xm∂y(xm0),m=1,2,...,n
③修改当前函数的参数值,公式如下: x m ′ = x m − α α y α x m ( x m 0 ) , m = 1 , 2 , . . . , n \ x^{'}_m=x_m-\alpha\frac{\alpha y}{\alpha x_m}(x_{m0}),m=1,2,...,n xm′=xm−ααxmαy(xm0),m=1,2,...,n
④如果参数变化量小于 ,退出;否则返回第2步。
5.4 一元线性回归函数推导过程
设线性回归函数: y ^ = ω x + b \hat{y}=\omega x+b y^=ωx+b
构造损失函数(loss): L ( w , b ) = 1 2 n ∑ i = 1 n ( w x i + b − y i ) 2 L(w,b)=\frac{1}{2n}\sum_{i=1}^{n}(wx_i+b-y_i)^2 L(w,b)=2n1i=1∑n(wxi+b−yi)2
思路:通过梯度下降法不断更新 和 ,当损失函数的值特别小时,就得到
了我们最终的函数模型。
过程:
step1.求导: α α w L ( w , b ) = 1 n ∑ i = 1 n ( ( w x i + b − y i ) ⋅ x i ) \frac{\alpha}{\alpha w}L(w,b)=\frac{1}{n}\sum_{i=1}^{n}((wx_i+b-y_i)\cdot x_i) αwαL(w,b)=n1i=1∑n((wxi+b−yi)⋅xi)
α α b L ( w , b ) = 1 n ∑ i = 1 n ( w x i + b − y i ) \frac{\alpha}{\alpha b}L(w,b)=\frac{1}{n}\sum_{i=1}^{n}(wx_i+b-y_i) αbαL(w,b)=n1i=1∑n(wxi+b−yi)
step2.更新 θ 0 \theta _0 θ0和 θ 1 \theta _1 θ1 : w = w − α ⋅ 1 n ∑ i = 1 n ( ( w x i + b − y i ) ⋅ x i ) w=w-\alpha \cdot \frac{1}{n} \sum_{i=1}^{n}((wx_i+b-y_i)\cdot x_i) w=w−α⋅n1i=1∑n((wxi+b−yi)⋅xi)
b = b − α ⋅ 1 n ∑ i = 1 n ( w x i + b − y i ) b=b-\alpha \cdot \frac{1}{n} \sum_{i=1}^{n}(wx_i+b-y_i) b=b−α⋅n1i=1∑n(wxi+b−yi)
5 (例子)波士顿房价预测
房屋价格与面积(数据在下面表格中):
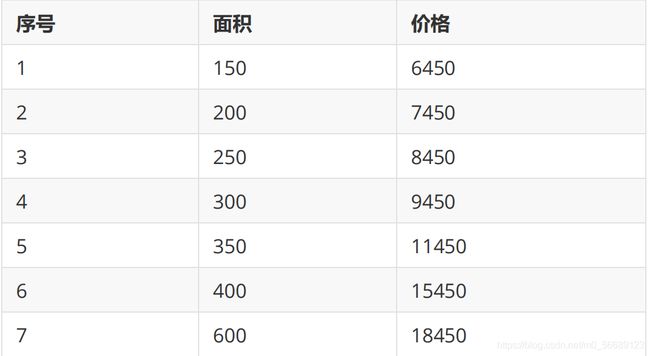
使用梯度下降求解线性回归(求 θ 0 \theta _0 θ0, θ 1 \theta_1 θ1 )
h θ ( x ) = θ 0 + θ 1 x h_{\theta}(x)=\theta_0+\theta_1 x hθ(x)=θ0+θ1x
5.1 代码实现(Python)
#房屋价格与面积
#序号:1     2    3    4     5     6     7
#面积:150  200  250  300   350   400   600
#价格:6450 7450 8450 9450 11450 15450 18450
import matplotlib.pyplot as plt
import matplotlib
from math import pow
import random
x0 = [150,200,250,300,350,400,600]
y0 = [6450,7450,8450,9450,11450,15450,18450]
#为了方便计算,将所有数据缩小 100 倍
x = [1.50,2.00,2.50,3.00,3.50,4.00,6.00]
y = [64.50,74.50,84.50,94.50,114.50,154.50,184.50]
#线性回归函数为 y=theta0+theta1*x
#损失函数 J (θ)=(1/(2*m))*pow((theta0+theta1*x[i]-y[i]),2)
#参数定义
theta0 = 0.1#对 theata0 赋值
theta1 = 0.1#对 theata1 赋值
alpha = 0.1#学习率
m = len(x)
count0 = 0
theta0_list = []
theta1_list = []
#1.使用批量梯度下降法
for num in range(10000):
    count0 += 1
    diss = 0   #误差
    deriv0 = 0 #对 theata0 导数
    deriv1 = 0 #对 theata1 导数
    #求导
    for i in range(m):
        deriv0 += (theta0+theta1*x[i]-y[i])/m#对每一项测试数据求导再求和取平均值
        deriv1 += ((theta0+theta1*x[i]-y[i])/m)*x[i]
    #更新 theta0 和 theta1
    theta0 = theta0 - alpha*deriv0
    theta1 = theta1 - alpha*deriv1
    #求损失函数 J (θ)
    for i in range(m):
        diss = diss + (1/(2*m))*pow((theta0+theta1*x[i]-y[i]),2)

    theta0_list.append(theta0*100)
    theta1_list.append(theta1)
    #如果误差已经很小,则退出循环
    if diss <= 0.001:
        break
theta0 = theta0*100#前面所有数据缩小了 100 倍,所以求出的 theta0 需要放大 100 倍,theta1 不用变
#2.使用随机梯度下降法
theta2 = 0.1#对 theata2 赋值
theta3 = 0.1#对 theata3 赋值
count1 = 0
theta2_list = []
theta3_list = []
for num in range(10000):
    count1 += 1
    diss = 0   #误差
    deriv2 = 0 #对 theata2 导数
    deriv3 = 0 #对 theata3 导数
    #求导
    for i in range(m):
        deriv2 += (theta2+theta3*x[i]-y[i])/m
        deriv3 += ((theta2+theta3*x[i]-y[i])/m)*x[i]
    #更新 theta0 和 theta1
    for i in range(m):
        theta2 = theta2 - alpha*((theta2+theta3*x[i]-y[i])/m)
        theta3 = theta3 - alpha*((theta2+theta3*x[i]-y[i])/m)*x[i]
    #求损失函数 J (θ)
    rand_i = random.randrange(0,m)
    diss = diss + (1/(2*m))*pow((theta2+theta3*x[rand_i]-y[rand_i]),2)

    theta2_list.append(theta2*100)
    theta3_list.append(theta3)
    #如果误差已经很小,则退出循环
    if diss <= 0.001:
        break
theta2 = theta2*100
print("批量梯度下降最终得到theta0={},theta1={}".format(theta0,theta1))
print("           得到的回归函数是:y={}+{}*x".format(theta0,theta1))
print("随机梯度下降最终得到theta0={},theta1={}".format(theta2,theta3))
print("           得到的回归函数是:y={}+{}*x".format(theta2,theta3))
#画原始数据图和函数图
matplotlib.rcParams['font.sans-serif'] = ['SimHei']
plt.plot(x0,y0,'bo',label='数据',color='black')
plt.plot(x0,[theta0+theta1*x for x in x0],label='批量梯度下降',color='red')
plt.plot(x0,[theta2+theta3*x for x in x0],label='随机梯度下降',color='blue')
plt.xlabel('x(面积)')
plt.ylabel('y(价格)')
plt.legend()
plt.show()
plt.scatter(range(count0),theta0_list,s=1)
plt.scatter(range(count0),theta1_list,s=1)
plt.xlabel('上方为theta0,下方为theta1')
plt.show()
plt.scatter(range(count1),theta2_list,s=3)
plt.scatter(range(count1),theta3_list,s=3)
plt.xlabel('上方为theta0,下方为theta1')
plt.show()
5.2 输出结果

线性回归函数图像:

批量梯度下降时的theta0和theta1的变化:
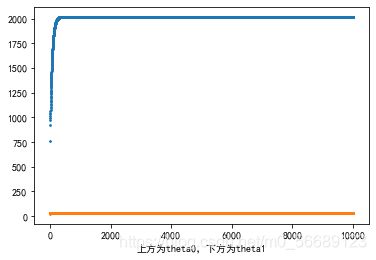
随机梯度下降时的theta0和theta1的变化:
二. 多元线性回归
1 定义数据
以下面一组数据作为例子:

以上角标作为行索引,以下角标作为列索引
第二行可以写成:
x ( 2 ) = [ 916 1201 5 . . . 33 ] x^{(2)}=\begin{bmatrix} 916 \\ 1201\\ 5\\ ...\\ 33 \end{bmatrix} x(2)=⎣⎢⎢⎢⎢⎡91612015...33⎦⎥⎥⎥⎥⎤
位于第二行第一列位置的数写成:
x 1 ( 2 ) = 916 x^{(2)}_1=916 x1(2)=916
以上下角标来区分位置,以便于后期运算。
3 定义函数
设置一个回归方程:
h θ ( x ) = θ 0 + θ 1 x 1 + θ 2 x 2 + θ 3 x 3 + ⋅ ⋅ ⋅ + θ n x n h_\theta (x)=\theta_0+\theta_1x_1+\theta_2x_2+\theta_3x_3+\cdot \cdot \cdot +\theta_nx_n hθ(x)=θ0+θ1x1+θ2x2+θ3x3+⋅⋅⋅+θnxn
添加一个列向量 x 0 = [ 1 , 1 , 1 , 1 , . . . , 1 ] T x_0=[1,1,1,1,...,1]^T x0=[1,1,1,1,...,1]T
这样方程可以写为:
h θ ( x ) = θ 0 x 0 + θ 1 x 1 + θ 2 x 2 + θ 3 x 3 + ⋅ ⋅ ⋅ + θ n x n h_\theta (x)=\theta_0 x_0+\theta_1x_1+\theta_2x_2+\theta_3x_3+\cdot \cdot \cdot +\theta_nx_n hθ(x)=θ0x0+θ1x1+θ2x2+θ3x3+⋅⋅⋅+θnxn
既不会影响到方程的结果,而且使 与 的数量一致以便于矩阵计算。
为了更方便表达,分别记为:
X = [ x 0 x 1 x 2 x 3 . . . x n ] , θ = [ θ 0 θ 1 θ 2 θ 3 . . . θ n ] X=\begin{bmatrix} x_0 \\ x_1\\ x_2\\ x_3\\ ...\\ x_n \end{bmatrix},\theta =\begin{bmatrix} \theta_0 \\ \theta_1\\ \theta_2\\ \theta_3\\ ...\\ \theta_n \end{bmatrix} X=⎣⎢⎢⎢⎢⎢⎢⎡x0x1x2x3...xn⎦⎥⎥⎥⎥⎥⎥⎤,θ=⎣⎢⎢⎢⎢⎢⎢⎡θ0θ1θ2θ3...θn⎦⎥⎥⎥⎥⎥⎥⎤
这样方程就变为:
h θ ( x ) = [ θ 0 , θ 1 , θ 2 , θ 3 , . . . , θ n ] T [ x 0 x 1 x 2 x 3 . . . x n ] h_\theta(x)=[\theta_0,\theta_1,\theta_2,\theta_3,...,\theta_n]^T\begin{bmatrix} x_0 \\ x_1\\ x_2\\ x_3\\ ...\\ x_n \end{bmatrix} hθ(x)=[θ0,θ1,θ2,θ3,...,θn]T⎣⎢⎢⎢⎢⎢⎢⎡x0x1x2x3...xn⎦⎥⎥⎥⎥⎥⎥⎤
由回归方程推导出损失方程:

4 梯度下降
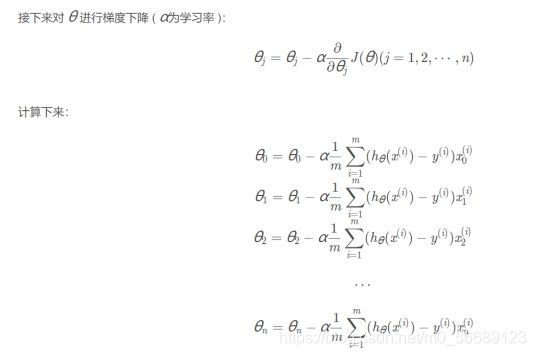
计算时要从 θ 0 \theta_0 θ0一直计算到 θ n \theta_n θn后,再从头由 θ 0 \theta_0 θ0开始计算,以确保数据统一变
化。
在执行次数足够多的迭代后,我们就能取得达到要求的 θ j \theta_j θj的值。
6 (例子)鸢尾花数据集
Iris 鸢尾花数据集内包含 3 类,分别为山鸢尾(Iris-setosa)、变色鸢尾
(Iris-versicolor)和维吉尼亚鸢尾(Iris-virginica),共 150 条记录,
每类各 50 个数据,每条记录都有 4 项特征:花萼长度、花萼宽度、花瓣长
度、花瓣宽度,可以通过这 4 个特征预测鸢尾花卉属于哪一品种。 这是本
文章所使用的鸢尾花数据集: sl:花萼长度 ;sw:花萼宽度 ;pl:花瓣长
度 ;pw:花瓣宽度; type:类别:(Iris-setosa、Iris-versicolor、
Iris-virginica 三类)

鸢尾花数据集下载:
https://archive.ics.uci.edu/ml/machine-learning-databases/iris/

下载这个iris.data 即可
将其置于当前工作文件夹即可
6.1 代码实现(Python)
import numpy as np
import pandas as pd
import random
import time
def MGD_train(X, y, alpha=0.0001, maxIter=1000, theta_old=None):
    '''
    MGD训练线性回归
    传入:
        X       :  已知数据
        y       :  标签
        alpha   :  学习率
        maxIter :  总迭代次数
    返回:
        theta : 权重参数
    '''
    # 初始化权重参数
    theta = np.ones(shape=(X.shape[1],))
    if not theta_old is None:
        # 假装是断点续训练
        theta = theta_old.copy()

    #axis=1 表示横轴,方向从左到右;axis=0 表示纵轴,方向从上到下
    for i in range(maxIter):
        # 预测
        y_pred = np.sum(X * theta, axis=1)
        # 全部数据得到的梯度
        gradient = np.average((y - y_pred).reshape(-1, 1) * X, axis=0)
        # 更新学习率
        theta += alpha * gradient
    return theta


def SGD_train(X, y, alpha=0.0001, maxIter=1000, theta_old=None):
    '''
    SGD训练线性回归
    传入:
        X       :  已知数据
        y       :  标签
        alpha   :  学习率
        maxIter :  总迭代次数

    返回:
        theta : 权重参数
    '''
    # 初始化权重参数
    theta = np.ones(shape=(X.shape[1],))
    if not theta_old is None:
        # 假装是断点续训练
        theta = theta_old.copy()
    # 数据数量
    data_length = X.shape[0]
    for i in range(maxIter):
        # 随机选择一个数据
        index = np.random.randint(0, data_length)
        # 预测
        y_pred = np.sum(X[index, :] * theta)
        # 一条数据得到的梯度
        gradient = (y[index] - y_pred) * X[index, :]
        # 更新学习率
        theta += alpha * gradient
    return theta


def MBGD_train(X, y, alpha=0.0001, maxIter=1000, batch_size=10, theta_old=None):
    '''
    MBGD训练线性回归
    传入:
        X          :  已知数据
        y          :  标签
        alpha      :  学习率
        maxIter    :  总迭代次数
        batch_size :  没一轮喂入的数据数

    返回:
        theta : 权重参数
    '''
    # 初始化权重参数
    theta = np.ones(shape=(X.shape[1],))

    if not theta_old is None:
        # 假装是断点续训练
        theta = theta_old.copy()

    # 所有数据的集合
    all_data = np.concatenate([X, y.reshape(-1, 1)], axis=1)
    for i in range(maxIter):
        # 从全部数据里选 batch_size 个 item
        X_batch_size = np.array(random.choices(all_data, k=batch_size))

        # 重新给 X, y 赋值
        X_new = X_batch_size[:, :-1]
        y_new = X_batch_size[:, -1]

        # 将数据喂入,更新 theta
        theta = MGD_train(X_new, y_new, alpha=0.0001, maxIter=1, theta_old=theta)
    return theta


def GD_predict(X, theta):
    '''
    用于预测的函数
    传入:
        X     : 数据
        theta : 权重
    返回:
        y_pred: 预测向量
    '''
    y_pred = np.sum(theta * X, axis=1)
    # 实数域空间 -> 离散三值空间,则需要四舍五入
    y_pred = (y_pred + 0.5).astype(int)
    return y_pred


def calc_accuracy(y, y_pred):
    '''
    计算准确率
    传入:
        y        : 标签
        y_pred   : 预测值
    返回:
        accuracy : 准确率
    '''
    return np.average(y == y_pred)*100
# 读取数据
iris_raw_data = pd.read_csv('iris.data', names  =['sepal length', 'sepal width', 'petal length', 'petal width', 'class'])

# 将三种类型映射成整数
Iris_dir = {
     'Iris-setosa': 1, 'Iris-versicolor': 2, 'Iris-virginica': 3}
iris_raw_data['class'] = iris_raw_data['class'].apply(lambda x:Iris_dir[x])


# 训练数据 X
iris_data = iris_raw_data.values[:, :-1]

# 标签 y
y = iris_raw_data.values[:, -1]

# 用 MGD 训练的参数
start = time.time()
theta_MGD = MGD_train(iris_data, y)
run_time = time.time() - start
y_pred_MGD = GD_predict(iris_data, theta_MGD)
print("MGD训练1000轮得到的准确率{:.2f}% 运行时间是{:.2f}s".format(calc_accuracy(y, y_pred_MGD), run_time))

# 用 SGD 训练的参数
start = time.time()
theta_SGD = SGD_train(iris_data, y)
run_time = time.time() - start
y_pred_SGD = GD_predict(iris_data, theta_SGD)
print("SGD训练1000轮得到的准确率{:.2f}% 运行时间是{:.2f}s".format(calc_accuracy(y, y_pred_SGD), run_time))

# 用 MBGD 训练的参数
start = time.time()
theta_MBGD = MBGD_train(iris_data, y)
run_time = time.time() - start
y_pred_MBGD = GD_predict(iris_data, theta_MBGD)
print("MBGD训练1000轮得到的准确率{:.2f}% 运行时间是{:.2f}s".format(calc_accuracy(y, y_pred_MBGD), run_time))
6.2 输出结果
三.三种数据集
1 训练集
参与训练,模型从训练集中学习经验,从而不断减小训练误差。这个最容 易理解,一般没什么疑惑。
2 验证集
不参与训练,用于在训练过程中检验模型的状态,收敛情况。验证集通常 用于调整超参数,根据几组模型验证集上的表现决定哪组超参数拥有最好 的性能。
同时验证集在训练过程中还可以用来监控模型是否发生过拟合,一般来说 验证集表现稳定后,若继续训练,训练集表现还会继续上升,但是验证集 会出现不升反降的情况,这样一般就发生了过拟合。所以验证集也用来判 断何时停止训练。
3 测试集
不参与训练,用于在训练结束后对模型进行测试,评估其泛化能力。在之 前模型使用【验证集】确定了【超参数】,使用【训练集】调整了【可训 练参数】,最后使用一个从没有见过的数据集来判断这个模型的好坏。
4 三者区别
为了方便理解,人们常常把这三种数据集类比成学生的课本、作业和期末考:
- 训练集——课本,学生根据课本里的内容来掌握知识
- 验证集——作业,通过作业可以知道不同学生实时的学习情况、进步的 速度快慢
- 测试集——考试,考的题是平常都没有见过,考察学生举一反三的能力
传统上,一般三者切分的比例是:6:2:2,验证集并不是必须的
5 交叉验证
假如我们教小朋友学加法:1个苹果+1个苹果=2个苹果
当我们再测试的时候,会问:1个香蕉+1个香蕉=几个香蕉?
如果小朋友知道「2个香蕉」,并且换成其他东西也没有问题,那么我们认 为小朋友学习会了「1+1=2」这个知识点。
如果小朋友只知道「1个苹果+1个苹果=2个苹果」,但是换成其他东西就不 会了,那么我们就不能说小朋友学会了「1+1=2」这个知识点。
评估模型是否学会了「某项技能」时,也需要用新的数据来评估,而不是 用训练集里的数据来评估。这种「训练集」和「测试集」完全不同的验证 方法就是交叉验证法
四.回归模型评价指标
参考:
1.https://www.cnblogs.com/geo-will/p/10468253.html
2.https://blog.csdn.net/weixin_44613063/article/details/88659981
3.https://blog.csdn.net/HaoZiHuang/article/details/104819026
4.https://blog.csdn.net/qq_43673118/article/details/105490502


