【图像识别】基于k-means聚类的手势识别matlab 源码
一、简介
提取手部轮廓特征,k-means聚类算法,训练得到手势识别模型,然后用测试数据测试。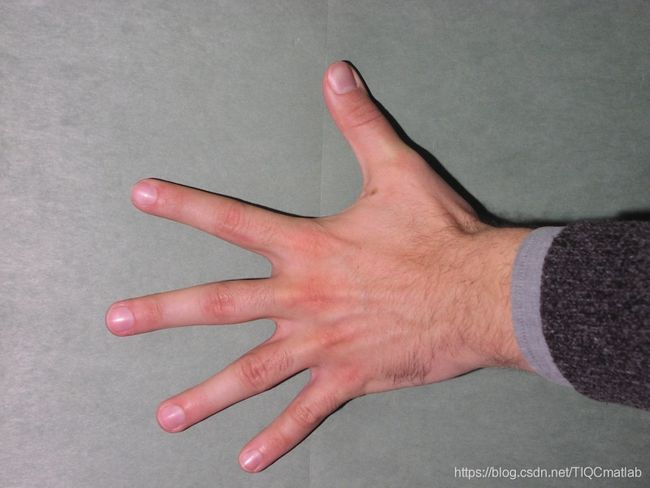
1 K-means算法原理
K-means算法是最常用的一种聚类算法。算法的输入为一个样本集(或者称为点集),通过该算法可以将样本进行聚类,具有相似特征的样本聚为一类。
针对每个点,计算这个点距离所有中心点最近的那个中心点,然后将这个点归为这个中心点代表的簇。一次迭代结束之后,针对每个簇类,重新计算中心点,然后针对每个点,重新寻找距离自己最近的中心点。如此循环,直到前后两次迭代的簇类没有变化。
下面通过一个简单的例子,说明K-means算法的过程。如下图所示,目标是将样本点聚类成3个类别。
2 基本的步骤为:
step1:选定要聚类的类别数目k(如上例的k=3类),选择k个中心点。
step2:针对每个样本点,找到距离其最近的中心点(寻找组织),距离同一中心点最近的点为一个类,这样完成了一次聚类。
step3:判断聚类前后的样本点的类别情况是否相同,如果相同,则算法终止,否则进入step4。
step4:针对每个类别中的样本点,计算这些样本点的中心点,当做该类的新的中心点,继续step2。
3 上述步骤的关键两点是:
- 找到距离自己最近的中心点。
- 更新中心点。
二、源代码
%------------------hand shape analysis
%
close all
format long %显示小数点后4位的数据
%读入hand的landmark数值
fid=fopen('shapes.txt');
hand=fscanf(fid, '%g %g',[40,inf]); % X(1,1)X(2,1)...X(56,1);X(1,2)X(2,2)...X(56,2)
% choose 40 shapes as a row column
Shape=600*hand;
%-----------------------------------------------------
% shape 矩阵每行112列,对应一个手的数据,
% 前56列对应X坐标 后56列对应Y坐标
% Odata中所有形状的质点已经平移到原点
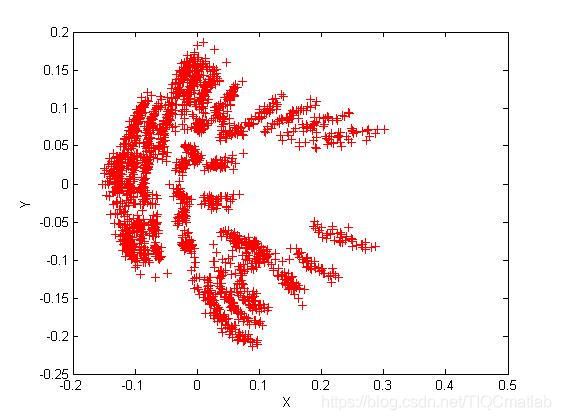
temp=Shape;
[temp,X,Y]=show2D(temp);
% %--------Show unaligned shape
% plot(X,Y,'r*');
% title('unaligned hands');
%------------------Compute the shape metric---------------------------
%-------------------------计算each Shape Size-------------------------
T=temp*temp'; % Diag的对角元素为∑(x^2+y^2)
V=diag(T); % compute 对角线
size=sqrt(V); % Size 为40×1矩阵
%------------------------将Size归一化--------------------------------
%%% 根据形状大小的函数满足S(ax)=aS(x),每个坐标都除以对应Size的值
for i=1:40
preHand(i,:)=temp(i,:)/size(i); % preHand 为已经对准质点和大小
end
% -------------------------将各个形状以hand1为mean旋转------------------------
x1=preHand(1,:); % vector 1*40
x1=reshape(x1,56,2);
x2=preHand(2,:);
for i=2:40
x3=preHand(i,:);
x2=reshape(x3,56,2);
XD=x1'*x2;
[U,S,V]=svd(XD);
I=x2*V*U';
preHand(i,:)=reshape(I,1,112);
end
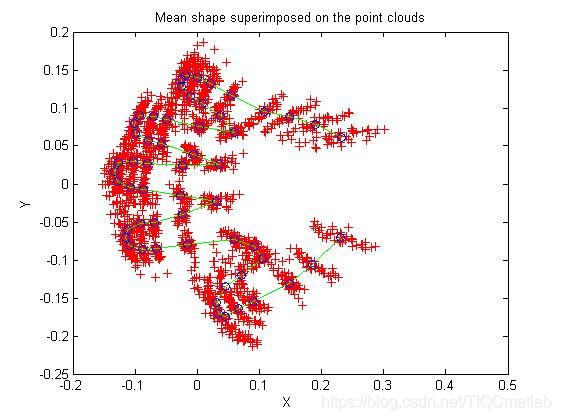
aligned=preHand;
for i=1:40
for j=1:56
XX(i,j)=aligned(i,j); % the mean x-axis coordinate of every landmark
YY(i,j)=aligned(i,j+56); % the mean y-axis coordinate of every landmark
end
end
plot(XX,YY,'ro')
%-----------------compute the mean shape coordinates
% every column of colm is the mean cooridnate of all the 40 hands'
% coordinate respectively
colm=mean(aligned); % mean(X) 求每一列元素的均值
for i=1:56
XX(i)=colm(i); % the mean x-axis coordinate of every landmark
YY(i)=colm(i+56); % the mean y-axis coordinate of every landmark
end
% subplot(1,2,1);
% figure;
% plot(XX,YY,'g-',XX,YY,'rx'); % show the mean shape of 40 hands
% title('the Mean Shape of Aligned');
% title('b1=0');
%---------------------------------------------------------------
% tangent space projection
absx=colm*colm';absx=absx*absx;
for i=1:40
xo=dot(colm,aligned(i,:)); % 矩阵点乘
xt(i,:)=absx*aligned(i,:)/xo;
end
%---------------------------------------------------------------
% PCA
[signals,PC,V] = pca1(xt');
% eAB=xt*xt'; % 应该减去均值球协方差矩阵
% eAb=xt*xt'/39;
% % eBA=xt'*xt;
% [PC,V]=eig(eAB);
% [PC1,V1]=eig(eAb);
% V=diag(V);
% V1=diag(V1);
% sumV=40*mean(V);
% compute the eigenvector of eBA
% PC1=xt'*PC;
% figure(2)
% bar(V);
% title('Shape eigenvalue');
% xlabel('Eigenvalue');
% ylabel('variance expansion factor(percent)');
% now the shape model can be x=xmean+PC1*B,
% where b {-3*sqrt(λ),3*sqrt(λ)}
% Pb=PC(:,1)*3*sqrt(V1(1));
Pb1=signals(:,1)*3*sqrt(V(1));
%
% Xz=colm+Pb1';
% Xz=colm-Pb1';
Pb2=signals(:,2)*3*sqrt(V(2));
Xz=colm-Pb2';
% Xz=colm-Pb2';
% for i=1:56
% Xp(i)=Xz(i); % the mean x-axis coordinate of every landmark
% Yp(i)=Xz(i+56); % the mean y-axis coordinate of every landmark
% end
function edgedemo(action, varargin)
%EDGEDEMO Edge detection demo.
% This demo uses the EDGE function to apply different edge detection
% methods to a variety of images. Use the pop-up menus to select an
% image and an edge detection method. You can control the parameters
% for the different methods by setting the values in the middle frame
% at the bottom of the figure. (The set of parameters differs
% depending on the method you choose.) Press the "Apply" button to
% calculate the edge map using the specified method and parameters.
%
% For the Sobel, Prewitt, and Roberts methods, the EDGE function
% finds edges by thresholding the gradient. For the Laplacian of
% Gaussian method, EDGE thresholds the slope of the zero crossings
% after filtering the image with a LoG filter. For the Canny method,
% EDGE thresholds the gradient using the derivative of a Gaussian
% filter.
%
% By default, the EDGE function automatically computes the threshold
% to use. To specify a different threshold manually (in order to
% detect more or fewer edges), click the radio button next to the
% edit box in the middle frame and enter the value in the text field.
% If you are using the Canny method, two thresholds are used: the
% high threshold is the value you specify, and the low threshold is
% 0.4 times the high threshold.
%
% For the Sobel and Prewitt methods, you can choose to detect
% horizontal edges, vertical edges, or both.
%
% For the Laplacian of Gaussian and Canny methods, you can specify
% sigma, the parameter that controls the spread of the Gaussian
% function. The size of the filter is set automatically by EDGE,
% based on the value of sigma.
%
% The Saturn and Lifting Body images are courtesy of NASA.
%
% See also EDGE.
% Copyright 1993-2004 The MathWorks, Inc.
% $Revision: 1.19.4.7 $ $Date: 2004/04/01 16:12:06 $
% Function subroutines:
%
% InitializeEDGEDEMO - Initialization of controls, axes, and
% Images.
%
% ComputeEdgeMap - Computes the Edge map of the original
% image using edge.m
%
% SelectMethod - Selects Edge Detection method and enable/disable
% the appropriate controls
%
% LoadNewImage - Loads the selected Image
%
% UpdateThreshCtrl - Grabs the threshold from the Edit box and
% enables the Apply button
%
% UpdateDirectionality - Sets the directionality string based on the
% popup menu.
%
% Radio - Sets values for Radio Buttons and enables/disables
% the threshold edit box.
%
% UpdateLOGSize - Grabs the LOG filter size from edit box
%
% UpdateLOGSigma - Grabs LOG filter Sigma from edit box
%
% ActivateSPRControls - Turns on controls for Sobel, Prewitt, Roberts
%
% ActivateLOGControls - Turns on controls for LOG.
if nargin<1,
action='InitializeEDGEDEMO';
end;
feval(action,varargin{:});
return;
%%%
%%% Sub-function - InitializeEDGEDEMO
%%%
function InitializeEDGEDEMO()
% If dctdemo is already running, bring it to the foreground.
h = findobj(allchild(0), 'tag', 'Edge Detection Demo');
if ~isempty(h)
figure(h(1))
return
end
screenD = get(0, 'ScreenDepth');
if screenD>8
grayres=256;
else
grayres=128;
end
EdgeDemoFig = figure( ...
'Name','Edge Detection Demo', ...
'NumberTitle','off', 'HandleVisibility', 'on', ...
'tag', 'Edge Detection Demo', ...
'Visible','off', 'Resize', 'off',...
'BusyAction','Queue','Interruptible','off', ...
'Color', [.8 .8 .8], ...
'IntegerHandle', 'off', ...
'DoubleBuffer', 'on', ...
'Colormap', gray(grayres));
figpos = get(EdgeDemoFig, 'position');
% Adjust the size of the figure window
figpos(3:4) = [560 420];
horizDecorations = 10; % resize controls, etc.
vertDecorations = 45; % title bar, etc.
screenSize = get(0,'ScreenSize');
if (screenSize(3) <= 1)
% No display connected (apparently)
screenSize(3:4) = [100000 100000]; % don't use Inf because of vms
end
if (((figpos(3) + horizDecorations) > screenSize(3)) | ...
((figpos(4) + vertDecorations) > screenSize(4)))
% Screen size is too small for this demo!
delete(EdgeDemoFig);
error(['Screen resolution is too low ', ...
'(or text fonts are too big) to run this demo']);
end
dx = screenSize(3) - figpos(1) - figpos(3) - horizDecorations;
dy = screenSize(4) - figpos(2) - figpos(4) - vertDecorations;
if (dx < 0)
figpos(1) = max(5,figpos(1) + dx);
end
if (dy < 0)
figpos(2) = max(5,figpos(2) + dy);
end
set(EdgeDemoFig, 'position', figpos);
rows = figpos(4); cols = figpos(3);
hs = (cols-512) / 3; % Horizantal Spacing
bot = rows-2*hs-256; % Bottom of the images
%====================================
% Parameters for all buttons and menus
ifs = hs/2; % Intraframe Spacing
Std.Interruptible = 'off';
Std.BusyAction = 'queue';
%================================
% Original Image Axes
hdl.ImageAxes = axes(Std, ...
'Units', 'Pixels', ...
'Parent',EdgeDemoFig,...
'ydir', 'reverse', ...
'XLim', [.5 256.5], ...
'YLim', [.5 256.5],...
'CLim', [0 255], ...
'Position',[hs bot 256 256], ...
'XTick',[],'YTick',[]);
set(get(hdl.ImageAxes, 'title'), 'string', 'Original Image');
%================================
% Edge Map Axes
hdl.EdgeAxes = axes(Std, ...
'Units', 'Pixels', ...
'Parent',EdgeDemoFig,...
'ydir', 'reverse', ...
'XLim', [.5 256.5], ...
'YLim', [.5 256.5],...
'CLim', [0 1], ...
'Position',[cols-hs-256 bot 256 256], ...
'XTick',[],'YTick',[]);
set(get(hdl.EdgeAxes, 'title'), 'string', 'Edge Map');
%================================
% Original Image
hdl.Image = image(Std, ...
'CData', [], ...
'CDataMapping', 'scaled', ...
'Parent',hdl.ImageAxes,...
'Xdata', [1 256],...
'Ydata', [1 256],...
'EraseMode', 'none');
%================================
% Edge Map Image
hdl.Edge = image(Std, ...
'CData', [], ...
'CDataMapping', 'scaled', ...
'Parent',hdl.EdgeAxes,...
'Xdata', [1 256],...
'Ydata', [1 256],...
'EraseMode', 'none');
% Background color for frames
bgcolor = [0.45 0.45 0.45];
fgcolor = [1 1 1]; % For text
%================================
% The Menu frame - image and method popups go here
mfleft=hs;
mfbot=hs;
mfwid=(3*cols/8)-1.5*hs; % 2*cols/7
mfht=bot-2*hs;
hdl.MenuFrame = uicontrol(Std, ...
'Parent', EdgeDemoFig, ...
'Style', 'frame', ...
'Units', 'pixels', ...
'Position', [mfleft mfbot mfwid mfht], ...
'BackgroundColor', bgcolor);
%====================================
% The LoadNewImage menu : ip-> Image Popup
ipwid = mfwid-2*ifs;
ipht = 21; % (mfht-5*ifs)/3;
ipleft = mfleft+ifs;
ipbot = mfbot+1.7*ifs + 2*ipht;
hdl.ImgPop=uicontrol(Std, ...
'Parent', EdgeDemoFig, ...
'Style','popupmenu', ...
'Units','pixels', ...
'Position',[ipleft ipbot ipwid ipht], ...
'Enable','on', ...
'String','Coins|Circuit|Vertigo|Lifting Body|Rice|Saturn|Eight Bit|Glass', ...
'Tag','ImagesPop',...
'Callback','edgedemo(''LoadNewImage'')');
% Text label for Image Menu Popup
uicontrol( Std, ...
'Parent', EdgeDemoFig, ...
'Style','text', ...
'Units','pixels', ...
'Position',[ipleft ipbot+ipht ipwid 18], ...
'Horiz','left', ...
'Background',bgcolor, ...
'Foreground',fgcolor, ...
'String','Select an Image:');
%====================================
% The Method menu : mp-> Method Popup
hdl.Method = 'Sobel';
mpwid = ipwid;
mpht = ipht;
mpleft = ipleft;
mpbot = mfbot+1.2*ifs;
hdl.MethodPop=uicontrol(Std, ...
'Parent', EdgeDemoFig, ...
'Style','popupmenu', ...
'Units','pixels', ...
'Position',[mpleft mpbot mpwid mpht], ...
'Enable','on', ...
'String','Sobel|Prewitt|Roberts|Laplacian of Gaussian|Canny', ...
'Tag','MethodPop',...
'Callback','edgedemo(''SelectMethod'')');
% Text label for Method Popup
uicontrol( Std, ...
'Parent', EdgeDemoFig, ...
'Style','text', ...
'Units','pixels', ...
'Position',[mpleft mpbot+mpht mpwid 18], ...
'Horiz','left', ...
'Background',bgcolor, ...
'Foreground',fgcolor, ...
'String','Edge Detection Method:');
%================================
% The Parameter frame - method specific parameters go here
pfleft =(3*cols/8)+0.5*hs; % 2*cols/7
pfbot = 1.5*hs;
pfwid =(3*cols/8)-hs; % 3*cols/7
pfht = bot-2.5*hs;
hdl.ParamFrame = uicontrol(Std, ...
'Parent', EdgeDemoFig, ...
'Style', 'frame', ...
'Units', 'pixels', ...
'Position', [ pfleft pfbot pfwid pfht ], ...
'BackgroundColor', bgcolor);
%====================================
% Controls for Sobel/Prewitt/Roberts edge detectors:
% Text label for Threshold Controls
labelleft = pfleft+ifs;
labelwid = pfwid/2-hs;
labelbot = pfbot+2*pfht/3;
hdl.sprThLbl = uicontrol(Std,...
'Parent', EdgeDemoFig, ...
'Style','text', ...
'Units','pixels', ...
'Position',[labelleft labelbot labelwid 18], ...
'Horiz','left', ...
'String','Threshold:', ...
'BackgroundColor',bgcolor, ...
'ForegroundColor',fgcolor);
hdl.Threshold = 0; % Initial value
raleft = pfleft + pfwid/2 - hs/2;
rabot = pfbot+2*pfht/3+hs/6;
rawid = pfwid/2;
raht = ipht;
hdl.RadioAutomatic=uicontrol(Std, ...
'Parent', EdgeDemoFig, ...
'Style','radiobutton', ...
'Units','pixels', ...
'Position',[raleft rabot rawid raht], ...
'String','Automatic', ...
'value',1,'Userdata',1, ...
'Callback','edgedemo(''Radio'',''auto'')');
rmleft = pfleft + pfwid/2 - hs/2;
rmbot = pfbot+pfht/3+hs/3;
rmwid = hs*1.5;
rmht = ipht;
hdl.RadioManual=uicontrol(Std, ...
'Parent', EdgeDemoFig, ...
'Style','radiobutton', ...
'Units','pixels', ...
'Position',[rmleft rmbot rmwid rmht], ...
'String','', ...
'value',0,'Userdata',0, ...
'Callback','edgedemo(''Radio'',''manual'')');
thleft = rmleft+rmwid;
thwid = rawid-rmwid;
thbot = rmbot;
thht = rmht;
hdl.ThreshCtrl = uicontrol(Std, ...
'Parent', EdgeDemoFig, ...
'Enable', 'off', ...
'Style','edit', ...
'Units','pixels', ...
'Position',[thleft thbot thwid thht], ...
'Horiz','right', ...
'Background','white', ...
'Foreground','black', ...
'String','0',...
'callback','edgedemo(''UpdateSprThresh'')');
% The Directionality Popup menu : dp-> Direction Popup
dpwid = pfwid/2;
dpht = ipht;
dpleft = pfleft + pfwid/2 - hs/2;
dpbot = pfbot+.4*hs;
hdl.sprDirPop=uicontrol(Std, ...
'Parent', EdgeDemoFig, ...
'Style','popupmenu', ...
'Units','pixels', ...
'Position',[dpleft dpbot dpwid dpht], ...
'Enable','on', ...
'String','Both|Horizontal|Vertical', ...
'Tag','DirectionPop',...
'Callback','edgedemo(''UpdateDirectionality'')');
% Text label for Directionality Popup
labelleft = pfleft+ifs;
labelwid = pfwid/2-hs; %5*hs/4
labelbot = dpbot;
hdl.sprDirLbl = uicontrol( Std, ...
'Parent', EdgeDemoFig, ...
'Style','text', ...
'Units','pixels', ...
'Position',[labelleft labelbot labelwid 18], ...
'Horiz','left', ...
'Background',bgcolor, ...
'Foreground',fgcolor, ...
'String','Direction:');
hdl.Directionality = 'both';
hdl.logSigmaCtrl=uicontrol(Std, ...
'Parent', EdgeDemoFig, ...
'Style','edit', ...
'Units','pixels', ...
'Position',[dpleft dpbot dpwid dpht], ...
'Horiz','right', ...
'Background','white', ...
'Foreground','black', ...
'String','2', ...
'Tag','DirectionPop',...
'Visible', 'off', ...
'Callback','edgedemo(''UpdateLOGSigma'')');
% Text label for Sigma edit box
hdl.logSigmaLbl = uicontrol( Std, ...
'Parent', EdgeDemoFig, ...
'Style','text', ...
'Units','pixels', ...
'Position',[labelleft labelbot labelwid 18], ...
'Horiz','left', ...
'Background',bgcolor, ...
'Foreground',fgcolor, ...
'Visible', 'off', ...
'String','Sigma:');
hdl.LogSigma = 2;
%====================================
% Status bar
colr = get(EdgeDemoFig,'Color');
hdl.Status = uicontrol( Std, ...
'Parent', EdgeDemoFig, ...
'Style','text', ...
'Units','pixels', ...
'Background', colr, ...
'Foreground', [.8 0 0], ...
'Position',[pfleft 2 pfwid 18], ...
'Horiz','center', ...
'Tag', 'Status', ...
'String','Initializing Edge Detection Demo...');
%================================
% The Button frame - Apply, Info, and Close buttons go here
bfleft = (3*cols/4)+.5*hs; % 5*cols/7
bfbot = hs;
bfwid = (cols/4)-1.5*hs; % 2*cols/7
bfht = bot-2*hs;
hdl.ButtonFrame = uicontrol(Std, ...
'Parent', EdgeDemoFig, ...
'Style', 'frame', ...
'Units', 'pixels', ...
'Position', [ bfleft bfbot bfwid bfht ], ...
'BackgroundColor', bgcolor);
%====================================
% The APPLY button
btnwid = bfwid - 2*ifs;
btnht = (bfht-4*ifs)/3; % 21
btnleft = bfleft + ifs;
btnbot = bfbot + bfht - ifs - btnht;
hdl.Apply=uicontrol(Std, ...
'Parent', EdgeDemoFig, ...
'Style','pushbutton', ...
'Units','pixels', ...
'Position',[btnleft btnbot btnwid btnht], ...
'Enable','off', ...
'String','Apply', ...
'Callback','edgedemo(''ComputeEdgeMap'')');
%====================================
% The INFO button
btnbot = bfbot + bfht - 2*ifs - 2*btnht;
hdl.Help=uicontrol(Std, ...
'Parent', EdgeDemoFig, ...
'Style','pushbutton', ...
'Units','pixels', ...
'Position',[btnleft btnbot btnwid btnht], ...
'Enable','off', ...
'String','Info', ...
'Callback','helpwin edgedemo');
%====================================
% The CLOSE button
btnbot = bfbot + ifs;
hdl.Close=uicontrol(Std, ...
'Parent', EdgeDemoFig, ...
'Style','pushbutton', ...
'Units','pixels', ...
'Position',[btnleft btnbot btnwid btnht], ...
'Enable','off', ...
'String','Close', ...
'Callback','close(gcbf)');
set(EdgeDemoFig, 'Userdata', hdl, 'Visible', 'on');
drawnow
LoadNewImage(EdgeDemoFig);
drawnow
set(EdgeDemoFig, 'HandleVisibility', 'Callback');
set([hdl.Apply hdl.Help hdl.Close] , 'Enable', 'on');
return
%%%
%%% Sub-Function - ComputeEdgeMap
%%%
function ComputeEdgeMap(DemoFig)
if nargin<1
callb = 1; % We're in a callback
DemoFig = gcbf;
else
callb = 0; % We're in the initialization
end
三、运行结果

四、备注
完整代码或者代写添加QQ1575304183