大多数用户感知到的卡顿等性能问题主要原因都是因为渲染性能。
Android 系统每隔大概16.6毫秒(1000ms / 60)发出VSYNC信号,触发对UI进行渲染,如果每次渲染成功,这样就能够达到画面所需要的的60fps ,要做到实现60fps,就意味着程序渲染工作需要在16ms之内完成。
认识卡顿现象
12fps: 类似于手动快速翻书的帧率;
24fps:人肉眼感知的连续线的运动效果;通常是电影胶卷使用的帧率
60fps:是人眼与大脑之间的协作无感知的画面更新
CPU: 负责measure、layout、record、execute的计算操作
GPU:负责将资源组件拆分到不同的像素上显示;
display: 负责将Frame buffer中的数据显示出来
当系统每隔16ms发出VSYNC时,如果CPU ,GPU都已经完成了相关的操作,那么display绘制就会很顺畅,但是如果CPU/GPU还在生产帧数据,从帧缓存中读取出来的数据就是之前的,这样在两个刷新周期之间显示了同一帧的数据,这就是我们通常说的发生了丢帧现象
监控卡顿的方法:
如果需要准确分析卡顿发生在哪一个函数,资源占用情况如何等,我们介绍两种比较主流的监控方案:
1. 利用主线程的Looper打印日志 (BlockCanary的原理)
先来看看Looper.java的源码
//此接口的实现类,系统给我们提供了一个LogPrinter
public interface Printer {
    /**
     * Write a line of text to the output.  There is no need to terminate
     * the given string with a newline.
     */
    void println(String x);
}


。。。。。。。。。。。。。。。。。。。。。。。。。。。。。。。。。。。。。。。。。。。。。。。。。。。。。。。。。。。。。。。。。。。。。。。
/**
     * Control logging of messages as they are processed by this Looper.  If
     * enabled, a log message will be written to printer
     * at the beginning and ending of each message dispatch, identifying the
     * target Handler and message contents.
     *
     * @param printer A Printer object that will receive log messages, or
     * null to disable message logging.
     */
    public void setMessageLogging(@Nullable Printer printer) {
        mLogging = printer;
    }


。。。。。。。。。。。。。。。。。。。。。。。。。。。。。。。。。。。。。。。。。。。。。。。。。。。。。。。。。。
/**
     * Run the message queue in this thread. Be sure to call
     * {@link #quit()} to end the loop.
     */
    public static void loop() {
        final Looper me = myLooper();
        if (me == null) {
            throw new RuntimeException("No Looper; Looper.prepare() wasn't called on this thread.");
        }
        final MessageQueue queue = me.mQueue;

        // Make sure the identity of this thread is that of the local process,
        // and keep track of what that identity token actually is.
        Binder.clearCallingIdentity();
        final long ident = Binder.clearCallingIdentity();

        // Allow overriding a threshold with a system prop. e.g.
        // adb shell 'setprop log.looper.1000.main.slow 1 && stop && start'
        final int thresholdOverride =
                SystemProperties.getInt("log.looper."
                        + Process.myUid() + "."
                        + Thread.currentThread().getName()
                        + ".slow", 0);

        boolean slowDeliveryDetected = false;

        for (;;) {
            Message msg = queue.next(); // might block
            if (msg == null) {
                // No message indicates that the message queue is quitting.
                return;
            }

            //此处如果logging不为空,那么他会调用Printer的println()打印一些信息,而Printer是一个接口,就需要我们自己去实现这个接口,并完成我们自己的Println()函数的方法体,打印我们自己需要的信息
            // This must be in a local variable, in case a UI event sets the logger
            final Printer logging = me.mLogging;
            if (logging != null) {
                logging.println(">>>>> Dispatching to " + msg.target + " " +
                        msg.callback + ": " + msg.what);
            }

            final long traceTag = me.mTraceTag;
            long slowDispatchThresholdMs = me.mSlowDispatchThresholdMs;
            long slowDeliveryThresholdMs = me.mSlowDeliveryThresholdMs;
            if (thresholdOverride > 0) {
                slowDispatchThresholdMs = thresholdOverride;
                slowDeliveryThresholdMs = thresholdOverride;
            }
            final boolean logSlowDelivery = (slowDeliveryThresholdMs > 0) && (msg.when > 0);
            final boolean logSlowDispatch = (slowDispatchThresholdMs > 0);

            final boolean needStartTime = logSlowDelivery || logSlowDispatch;
            final boolean needEndTime = logSlowDispatch;

            if (traceTag != 0 && Trace.isTagEnabled(traceTag)) {
                Trace.traceBegin(traceTag, msg.target.getTraceName(msg));
            }

            final long dispatchStart = needStartTime ? SystemClock.uptimeMillis() : 0;
            final long dispatchEnd;
            try {
                msg.target.dispatchMessage(msg);
                dispatchEnd = needEndTime ? SystemClock.uptimeMillis() : 0;
            } finally {
                if (traceTag != 0) {
                    Trace.traceEnd(traceTag);
                }
            }
            if (logSlowDelivery) {
                if (slowDeliveryDetected) {
                    if ((dispatchStart - msg.when) <= 10) {
                        Slog.w(TAG, "Drained");
                        slowDeliveryDetected = false;
                    }
                } else {
                    if (showSlowLog(slowDeliveryThresholdMs, msg.when, dispatchStart, "delivery",
                            msg)) {
                        // Once we write a slow delivery log, suppress until the queue drains.
                        slowDeliveryDetected = true;
                    }
                }
            }
            if (logSlowDispatch) {
                showSlowLog(slowDispatchThresholdMs, dispatchStart, dispatchEnd, "dispatch", msg);
            }

            //此处打印结束
            if (logging != null) {
                logging.println("<<<<< Finished to " + msg.target + " " + msg.callback);
            }

            // Make sure that during the course of dispatching the
            // identity of the thread wasn't corrupted.
            final long newIdent = Binder.clearCallingIdentity();
            if (ident != newIdent) {
                Log.wtf(TAG, "Thread identity changed from 0x"
                        + Long.toHexString(ident) + " to 0x"
                        + Long.toHexString(newIdent) + " while dispatching to "
                        + msg.target.getClass().getName() + " "
                        + msg.callback + " what=" + msg.what);
            }

            msg.recycleUnchecked();
        }
    }
如果我们想用主线程的Looper来打印相关的日志信息,那么我们就需要给Looper实例提供一个Printer的实例,而Printer是一个接口,那么我们就来实现一个Printer的实现类:LogMonitor.java
public class LogMonitor implements Printer {

    private StackSampler mStackSampler;
    private boolean mPrintingStarted = false;
    private long mStartTimestamp;
    // 卡顿阈值
    private long mBlockThresholdMillis = 3000;
    //采样频率
    private long mSampleInterval = 1000;
    private Handler mLogHandler;

    public LogMonitor() {
        mStackSampler = new StackSampler(mSampleInterval);
        HandlerThread handlerThread = new HandlerThread("block-canary-io");
        handlerThread.start();
        mLogHandler = new Handler(handlerThread.getLooper());
    }

    @Override
    public void println(String x) {
        //从if到else会执行 dispatchMessage,如果执行耗时超过阈值,输出卡顿信息
        if (!mPrintingStarted) {
            //记录开始时间
            mStartTimestamp = System.currentTimeMillis();
            mPrintingStarted = true;
            mStackSampler.startDump();
        } else {
            final long endTime = System.currentTimeMillis();
            mPrintingStarted = false;
            //出现卡顿
            if (isBlock(endTime)) {
                notifyBlockEvent(endTime);
            }
            mStackSampler.stopDump();
        }
    }

    private void notifyBlockEvent(final long endTime) {
        mLogHandler.post(new Runnable() {
            @Override
            public void run() {
                //获得卡顿时 主线程堆栈
                List stacks = mStackSampler.getStacks(mStartTimestamp, endTime);
                for (String stack : stacks) {
                    Log.e("block-canary", stack);
                }
            }
        });
    }

    private boolean isBlock(long endTime) {
        return endTime - mStartTimestamp > mBlockThresholdMillis;
    }
}
再来一个堆栈信息采集器:
public class StackSampler {

    public static final String SEPARATOR = "\r\n";
    public static final SimpleDateFormat TIME_FORMATTER =
            new SimpleDateFormat("MM-dd HH:mm:ss.SSS");
    private Handler mHandler;
    private Map mStackMap = new LinkedHashMap<>();
    private int mMaxCount = 100;
    private long mSampleInterval;
    //是否需要采样
    protected AtomicBoolean mShouldSample = new AtomicBoolean(false);

    public StackSampler(long sampleInterval) {
        mSampleInterval = sampleInterval;
        HandlerThread handlerThread = new HandlerThread("block-canary-sampler");
        handlerThread.start();
        mHandler = new Handler(handlerThread.getLooper());
    }

    /**
     * 开始采样 执行堆栈
     */
    public void startDump() {
        //避免重复开始
        if (mShouldSample.get()) {
            return;
        }
        mShouldSample.set(true);
        mHandler.removeCallbacks(mRunnable);
        mHandler.postDelayed(mRunnable, mSampleInterval);
    }

    public void stopDump() {
        if (!mShouldSample.get()) {
            return;
        }
        mShouldSample.set(false);
        mHandler.removeCallbacks(mRunnable);
    }

    public List getStacks(long startTime, long endTime) {
        ArrayList result = new ArrayList<>();
        synchronized (mStackMap) {
            for (Long entryTime : mStackMap.keySet()) {
                if (startTime < entryTime && entryTime < endTime) {
                    result.add(TIME_FORMATTER.format(entryTime)
                            + SEPARATOR
                            + SEPARATOR
                            + mStackMap.get(entryTime));
                }
            }
        }
        return result;
    }

    private Runnable mRunnable = new Runnable() {
        @Override
        public void run() {
            StringBuilder sb = new StringBuilder();
            StackTraceElement[] stackTrace = Looper.getMainLooper().getThread().getStackTrace();
            for (StackTraceElement s : stackTrace) {
                sb.append(s.toString()).append("\n");
            }
            synchronized (mStackMap) {
                //最多保存100条堆栈信息
                if (mStackMap.size() == mMaxCount) {
                    mStackMap.remove(mStackMap.keySet().iterator().next());
                }
                mStackMap.put(System.currentTimeMillis(), sb.toString());
            }
            if (mShouldSample.get()) {
                mHandler.postDelayed(mRunnable, mSampleInterval);
            }
        }
    };
}
再来一个静态方法调用使用:
public class BlockCanary {
    public static void install() {
        LogMonitor logMonitor = new LogMonitor();
        Looper.getMainLooper().setMessageLogging(logMonitor);
    }
}
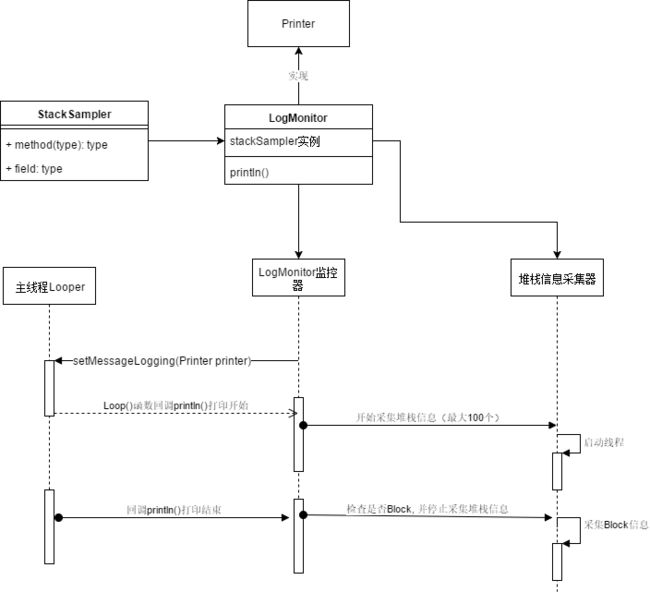
来看一下BlockCanary的工作流程图
采集的信息截图,当然你也可以修改成保存到文件中去:

2. 使用Choreographer.FrameCallback监控
当每一帧被渲染时会触发此接口的回调,并带着底层VSYNC信息到达的时间戳。
/**
     * Implement this interface to receive a callback when a new display frame is
     * being rendered.  The callback is invoked on the {@link Looper} thread to
     * which the {@link Choreographer} is attached.
     */
    public interface FrameCallback {
        /**
         * Called when a new display frame is being rendered.
         *
         * This method provides the time in nanoseconds when the frame started being rendered.
         * The frame time provides a stable time base for synchronizing animations
         * and drawing.  It should be used instead of {@link SystemClock#uptimeMillis()}
         * or {@link System#nanoTime()} for animations and drawing in the UI.  Using the frame
         * time helps to reduce inter-frame jitter because the frame time is fixed at the time
         * the frame was scheduled to start, regardless of when the animations or drawing
         * callback actually runs.  All callbacks that run as part of rendering a frame will
         * observe the same frame time so using the frame time also helps to synchronize effects
         * that are performed by different callbacks.
         *
         * Please note that the framework already takes care to process animations and
         * drawing using the frame time as a stable time base.  Most applications should
         * not need to use the frame time information directly.
         *
         *
         * @param frameTimeNanos The time in nanoseconds when the frame started being rendered,
         * in the {@link System#nanoTime()} timebase.  Divide this value by {@code 1000000}
         * to convert it to the {@link SystemClock#uptimeMillis()} time base.
         */
        public void doFrame(long frameTimeNanos);
    }
所以我们就自定义一个该接口的实现:
public class ChoreographerHelper {

    public static void start() {
        if (Build.VERSION.SDK_INT >= Build.VERSION_CODES.JELLY_BEAN) {
            Choreographer.getInstance().postFrameCallback(new Choreographer.FrameCallback() {
                long lastFrameTimeNanos = 0;

                @Override
                public void doFrame(long frameTimeNanos) {
                    //上次回调时间
                    if (lastFrameTimeNanos == 0) {
                        lastFrameTimeNanos = frameTimeNanos;
                        Choreographer.getInstance().postFrameCallback(this);
                        return;
                    }
                    long diff = (frameTimeNanos - lastFrameTimeNanos) / 1_000_000;
                    if (diff > 16.6f) {
                        //掉帧数
                        int droppedCount = (int) (diff / 16.6);
                    }
                    lastFrameTimeNanos = frameTimeNanos;
                    Choreographer.getInstance().postFrameCallback(this);
                }
            });
        }
    }
}
上面的实现可以帮助我们获取实时的帧数和掉帧数,如果掉的比较多时(有可能卡顿),我们可以用第一种监控方式里面的堆栈信息采集器来进行采集,同时也可以输出采集的信息。
以上两种监控卡顿的方式仅供参考,感谢腾讯-享学课堂的老师的资料,
常见卡顿的处理:
-
嵌套太深,过于复杂的布局
系统对于视图的绘制过程包括measure ,layout ,draw三个过程,如果嵌套的太深,自然对每个视图都进行三步测绘过程就会需要更多的时间来完成,这样就会造成卡顿等现象。
解决方案:
参考《Android性能优化之布局优化》
-
过度的绘制(OverDraw)
如果在屏幕上的某一个像素点有多次绘制,就是过度绘制了,较为常见的就是重复的绘制背景绘制一些不可见的UI元素。
我们可以在我们设备的“系统设置”->"开发者选项"->"调试GPU过度绘制"中开启调试,此时你的设备界面可能出现五种颜色标识:
原色: 没有过度绘制
蓝色: 1次过度绘制
绿色: 2次过度绘制
粉色: 3次过度绘制
红色: 大于等于4次绘制
解决方案:
1)移除一些不需要的背景
如果有些子视图有背景,而且会覆盖父视图时,那么主视图的背景就不必要设置,系统对于没有背景的是不会直接渲染内容,这样就可以提高渲染的性能。
2)使视图层级结构扁平化
优化布局的层次层次来减少重叠的视图
3) 降低透明度
系统对于不透明的view ,之需要渲染一次就可以显示出来,而如果设置了透明度,则至少需要渲染两次(因为系统要先知道他的下层元素是什么,然后再结合上层的view进行混色处理)。
透明的动画,淡入淡出和阴影效果等都是和透明度相关的,这样就会造成过度绘制。
-
异步加载布局
LayoutInflater 在加载XML布局的过程中会在主线程使用IO读取XML文件进行解析,再跟进解析的结果利用反射创建布局中的View/ViewGroup对象。这个过程会虽然布局的复杂度上升,耗时自然也会随之增大。
AsyncLayoutInflater 内部是一个线程来进行递归遍历xml文件的节点,然后全部解析完成后将结果通过callback回调到主线程。
implementation "androidx.asynclayoutinflater:asynclayoutinflater:1.0.0"

public class MainActivity extends AppCompatActivity {

    @Override
    protected void onCreate(Bundle savedInstanceState) {
        super.onCreate(savedInstanceState);
        new AsyncLayoutInflater(this).inflate(R.layout.activity_main, null, new AsyncLayoutInflater.OnInflateFinishedListener() {
            @Override
            public void onInflateFinished(@NonNull View view, int resid, @Nullable ViewGroup parent) {
                setContentView(view);
            }
        });

    }
AsyncLayoutInflater的使用局限性:
1) 不支持包含Fragment的layout
2) 不支持设置LayoutInflater.Factory 或LayoutInflator.Factory2
3) 需要一个线程安全的generateLayoutParams 的parent
4) 如果无法异步构造的布局,则会自动退回到UI主线程上
5) 需要构建的view中不能直接使用Handler或者调用Looper.myLooper(),因为异步线程默认情况下是没有调用Looper.prepare();