基于集成学习方法(Random Forest、Adaboost、GBDT、LightGBM、XGBoost)的调参、建模、评估实现kaggle竞赛员工离职案例分析(1)
基于集成学习方法Random Forest、Adaboost、GBDT、LightGBM、XGBoost的调参、建模、评估实现kaggle竞赛员工离职案例分析(1)
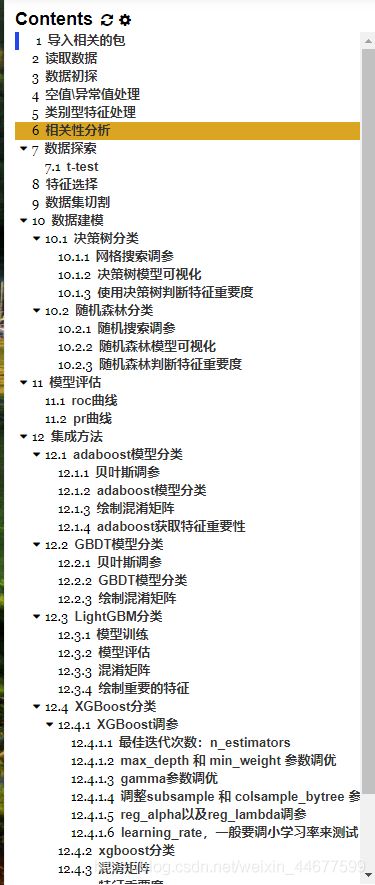
- 引言
- 实验内容
- 实验环境
- 数据准备
- 数据初探
-
- 导入相关的包
- 忽略警告及可展示
- 读取数据
- 数据探索
- 空值\异常值处理
- 类别型特征处理
- 相关性分析
- 数据探索
-
- 特征关联分析
- t-test
- 特征重要度
- 数据集切割
- 数据建模
-
- 1. 决策树分类
-
- 网格搜索调参
- 建模学习
- F1分数
- 模型可视化
-
- 方法1:matplotlib
- 方法2:graphviz
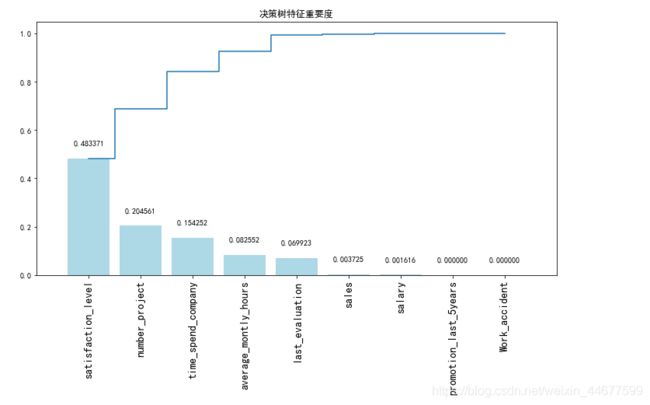
- 使用决策树判断特征重要度
- 2. 随机森林分类
-
- 随机搜索调参
- 建模学习
- 随机森林模型可视化
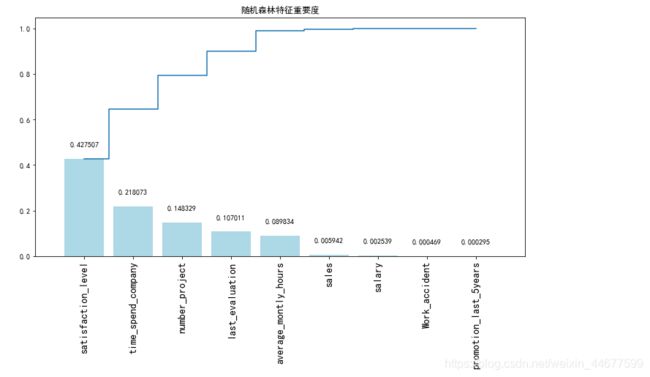
- 随机森林判断特征重要度
- 两种模型评估
-
- roc曲线
- pr曲线
引言
__集成学习Ensemble learning__通过构建并结合多个学习器来完成学习任务,有时也被称为多分类器系统、基于委员会的学习等。
集成学习的一般结构为:先产生一组“个体学习器”,再用某种策略将它们结合起来。集成中只包含同种类型的个体学习器,称为同质,当中的个体学习器亦称为“基学习器”,相应的算法称为“基学习算法”。集成中包含不同类型的个体学习器,称为“异质”,当中的个体学习器称为“组建学习器”。
要获得好的集成,个体学习器应“好而不同”,即个体学习器要有一定的“准确性”,即学习器不能太坏,并且要有多样性,即个体学习器间具有差异。
根据个体学习器的生成方式,目前的集成学习方法大致可以分为两类:
- 个体学习器间存在强依赖关系、必须串行生成的序列化方法,代表为Boosting;
- 个体学习器间不存在强依赖关系、可同时生成的并行化方法,代表为Bagging和随机森林。
注:所谓串行生成的序列化方法就是除了训练第一个之外,其他的学习器学习都需要依赖于前面生成的学习的结果。
实验内容
1、Decision Tree算法:通过网格搜索调参确定决策树最佳参数,可视化决策树、并使用决策树进行特征重要度分析。
2、Random Forest算法:通过随机搜索调参确定森林及其子树的最佳参数,可视化森林、并使用随机森林进行特征重要度分析,绘制pr曲线、roc曲线比较两种算法。
3、Adaboost算法:通过贝叶斯优化调参确定算法最佳参数,并使用Adaboost进行特征重要度分析,绘制混淆矩阵评估模型。
4、GBDT算法:通过贝叶斯优化调参确定算法最佳参数,并使用GBDT进行特征重要度分析,绘制混淆矩阵评估模型。
4、LightGBM算法:使用LightGBM进行特征重要度分析,绘制混淆矩阵评估模型。
6、XGBoost算法:通过多层次网格搜索调参逐步确定算法最佳参数,并使用XGBoost进行特征重要度分析,绘制混淆矩阵评估模型。
7、比较4种模型Adaboost、GBDT、LightGBM、XGBoost的roc曲线、混淆矩阵。使用多数/硬投票将4种模型级联。
实验环境
Notebook编译器 + Python3.6.9 (当然你也可以选择其他编译器)
numpy-1.16.2
matplotlib -3.2.2
lightgbm -3.1.1
xgboost -1.2.1
以下依赖是绘制决策树及随机森林时使用,当然你也可以使用matplotlib绘图,教程中会告诉你,然而Graphviz绘制的树较为美观,且对于深度学习的模型同样适用,因此,建议你安装以下依赖:
1.安装graphviz
下载地址在:链接: http://www.graphviz.org/.如果你是linux,可以用apt-get或者yum的方法安装。如果是windows,就在官网下载msi文件安装。无论是linux还是windows,装完后都要设置环境变量,将graphviz的bin目录加到PATH,比如我是windows,需要将bin目录的路径加入了系统环境变量的PATH中。
2.安装python插件graphviz
pip install graphviz
3.安装python插件pydotplus
pip install pydotplus
这样环境就搭好了,有时候python会很笨,仍然找不到graphviz,这时,可以在代码里面加入这一行:
import os
os.environ["PATH"] += os.pathsep + 'D:/program_files/graphviz/bin' # 安装目录bin文件夹的路径
数据准备
Kaggle竞赛:美国劳工部官方统计数据 员工离职案例分析
本项目所用的数据来自Kaggle竞赛上的HR分析数据集,字段说明如下:
satisfaction_level (对公司满意程度,范围为0–1)
last_evaluation(从上一次评估以来的时间)
Number_projects(工作中完成的项目数量)
average_monthly_hours(平均每月工作时长)
Time_spend_company(在公司待了几年)
Work_accident(员工在工作期间是否出现过事故)
Left(员工是否离开了工作岗位(1或0))
Promotion_last_5years(过去5年员工是否升职过)
Sales(员工在哪个部门)
Salary(相对薪资水平)
数据初探
导入相关的包
import numpy as np
import pandas as pd
import matplotlib.pyplot as plt
import seaborn as sns
import warnings

%matplotlib inline
忽略警告及可展示
# 设置行列可展示
pd.set_option('display.max_columns',None)
pd.set_option('display.max_rows',None)

# 设置中文和正负号可显示
plt.rcParams['font.family']=['sans-serif']
plt.rcParams['font.sans-serif']=['SimHei']

# 忽略警告
warnings.filterwarnings('ignore')
读取数据
data=pd.read_csv('HR_comma_sep.csv')
data.head()
数据探索
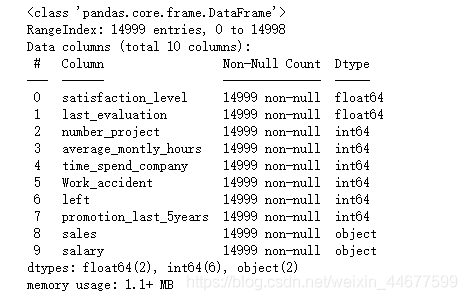
data.info()
data.describe()
空值\异常值处理
从数据探索中可以看到无空值,且数据无异常点,故不需要进行处理。
类别型特征处理
# 标签编码
from sklearn.preprocessing import LabelEncoder
data['sales']=LabelEncoder().fit_transform(data['sales']).astype('int64')
data['salary']=LabelEncoder().fit_transform(data['salary']).astype('int64')
data.head(10)
相关性分析
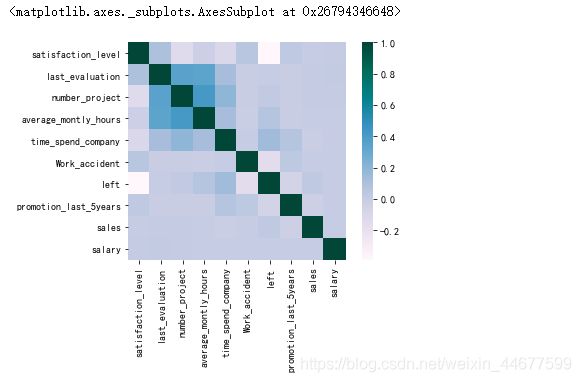
num_feature=data.columns[(data.dtypes== 'float64') | (data.dtypes == 'int64')]
pearson_correlation=data[num_feature].corr(method='pearson')
plt.figure()
sns.heatmap(pearson_correlation,square=True,cmap='PuBuGn')
数据探索
特征关联分析
# 工资水平与满意度关系
result = data['satisfaction_level'].groupby(data['salary']).mean()
print(result)
# 比较离职和未离职员工的满意度
result1 = data['satisfaction_level'].groupby(data['left']).mean()
print(result1)
t-test
# 比较离职和未离职员工的满意度
from scipy import stats
stats.ttest_1samp(a = data[data['left']==1]['satisfaction_level'], # 离职员工的满意度样本
                  popmean = 0.666810)
# T-Test 显示pvalue (0) 非常小, 所以他们之间是显著不同的
# 员工满意度概率密度函数估计曲线
fig = plt.figure(figsize=(15,4))
ax=sns.kdeplot(data.loc[(data['left'] == 0),'satisfaction_level'] , color='b',shade=True, label='no left')
ax=sns.kdeplot(data.loc[(data['left'] == 1),'satisfaction_level'] , color='r',shade=True, label='left')
plt.title('员工满意度 - 离职 V.S. 未离职')
y=data['left']
x=data.drop(columns='left')
x
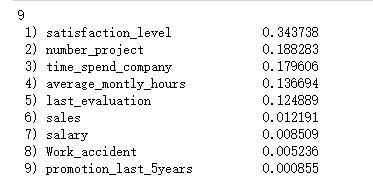
特征重要度
from sklearn.ensemble import RandomForestClassifier    # 导入随机森林库

cols = x.columns[(x.dtypes == 'float64') | (x.dtypes == 'int64')]    # 选择数值类特征计算特征重要性
cols = list(cols)[:]
clf = RandomForestClassifier(n_estimators=100)    # 此处为举例说明,仅对参数进行简单设置
clf.fit(x, y)
importance = clf.feature_importances_    # 使用随机森林的特征重要性计算方法
print(x[cols].shape[1])
indices = np.argsort(importance)[::-1]    # 按特征重要性降序排列
for f in range(x[cols].shape[1]):
    print("%2d) %-*s %f" % (f+1 , 30, cols[indices[f]], importance[indices[f]]))
数据集切割
from sklearn.model_selection import train_test_split

X_train, X_test, y_train, y_test =train_test_split(x,y,test_size=0.3)
X_train.shape,y_train.shape
((10499, 9), (10499,))
数据建模
1. 决策树分类
网格搜索调参
from sklearn.model_selection import GridSearchCV
from sklearn.metrics import roc_auc_score
from sklearn.tree import DecisionTreeClassifier
from sklearn.metrics import classification_report

parameters = {
     'splitter':('best','random')
              ,'criterion':('gini','entropy')
              ,'min_samples_leaf':[*range(1,50,5)]
              ,'max_depth':[3,5,7,10]
              ,'max_features':[0.1,0.3,0.5,0.7,0.9]
}
clf= DecisionTreeClassifier()
grid = GridSearchCV(clf,parameters,cv=5)
grid.fit(X_train, y_train)
grid.best_params_
建模学习
decisiontree_model = DecisionTreeClassifier(criterion='gini',max_depth= 10,max_features= 0.9,min_samples_leaf=1,splitter= 'best')
decisiontree_model.fit(X_train, y_train)
roc_auc_score(y_test,decisiontree_model.predict(X_test))
0.963024247262975
F1分数
print(classification_report(y_test,decisiontree_model.predict(X_test)))
模型可视化
方法1:matplotlib
# sklearn.plot_tree方法
from sklearn.tree import plot_tree
plt.figure(figsize=(30,50))
plot_tree(decisiontree_model,filled=True,feature_names=X_train.columns, class_names=['0','1'])
方法2:graphviz
# graphviz 方法
from io import StringIO
from sklearn.tree import export_graphviz
from IPython.display import Image
import pydotplus
# 文件缓存
dot_data = StringIO()
# 将决策树导入到dot中
export_graphviz(decisiontree_model, out_file=dot_data,
                filled=True, rounded=True,
                special_characters=True,feature_names = data.columns[:-1],class_names=['0','1'])
# 将生成的dot文件生成graph
graph = pydotplus.graph_from_dot_data(dot_data.getvalue())
Image(graph.create_png())
使用决策树判断特征重要度
# 获取特征重要性
importances = decisiontree_model.feature_importances_
# 获取特征名称
feat_names = x.columns
# 排序
indices = np.argsort(importances)[::-1]
# 绘图
plt.figure(figsize=(12,6))
plt.title("决策树特征重要度")
plt.bar(range(len(indices)), importances[indices], color='lightblue',  align="center")
# 添加数据标签
for a, b in zip(range(len(indices)), importances[indices]):
    plt.text(a, b + 0.05, '%f' % b, ha='center', va='bottom', fontsize=10)
plt.step(range(len(indices)), np.cumsum(importances[indices]), where='mid', label='Cumulative')
plt.xticks(range(len(indices)), feat_names[indices], rotation='vertical',fontsize=14)
plt.xlim([-1, len(indices)])
plt.show()
2. 随机森林分类
随机搜索调参
from sklearn.ensemble import RandomForestClassifier
from sklearn.model_selection import RandomizedSearchCV

parameters_ran = {
     'criterion':('gini','entropy')
              ,'max_depth':[*range(1,10)]
              ,'min_samples_leaf':[*range(1,50,5)]
              ,'max_features':[0.1,0.3,0.5,0.7,0.9]
            ,'n_estimators': [50,100,200,500]
}
clf_ran=RandomForestClassifier()
grid_ran=RandomizedSearchCV(clf_ran,parameters,cv=10)
grid_ran.fit(X_train, y_train)
grid_ran.best_params_
建模学习
randomforest_model = RandomForestClassifier(n_estimators=20,min_samples_leaf=16,max_features=0.9,max_depth= 8,criterion='entropy')
randomforest_model.fit(X_train, y_train)
roc_auc_score(y_test,randomforest_model.predict(X_test))
0.9506425723183329
print(classification_report(y_test,randomforest_model.predict(X_test)))
随机森林模型可视化
# Graphviz中未提供多棵树的绘制方法,所以我们遍历森林中的树,分别进行绘制
Estimators = randomforest_model.estimators_
# 遍历
for index, model in enumerate(Estimators):
    # 文件缓存
    dot_data = StringIO()
    # 将决策树导入到dot_data中
    export_graphviz(model , out_file=dot_data,
                         feature_names=x.columns[:],
                         class_names=['0','1'],
                         filled=True, rounded=True,
                         special_characters=True)
    # 从数据中生成graph
    graph = pydotplus.graph_from_dot_data(dot_data.getvalue())
    # 绘制图像
    plt.figure(figsize = (20,20))
    plt.imshow(plt.imread('Rf{}.png'.format(index)))
    plt.axis('off')
注意:只截图了森林的一棵树
随机森林判断特征重要度
# 获取特征重要性
importances = randomforest_model.feature_importances_
# 获取特征名称
feat_names = x.columns
# 排序
indices = np.argsort(importances)[::-1]
# 绘图
plt.figure(figsize=(12,6))
plt.title("随机森林特征重要度")
plt.bar(range(len(indices)), importances[indices], color='lightblue',  align="center")
# 添加数据标签
for a, b in zip(range(len(indices)), importances[indices]):
    plt.text(a, b + 0.05, '%f' % b, ha='center', va='bottom', fontsize=10)
plt.step(range(len(indices)), np.cumsum(importances[indices]), where='mid', label='Cumulative')
plt.xticks(range(len(indices)), feat_names[indices], rotation='vertical',fontsize=14)
plt.xlim([-1, len(indices)])
plt.show()
两种模型评估
roc曲线
from sklearn.metrics import roc_curve
# 计算ROC曲线
rf_fpr, rf_tpr, rf_thresholds = roc_curve(y_test, randomforest_model.predict_proba(X_test)[:,1])
dt_fpr, dt_tpr, dt_thresholds = roc_curve(y_test, decisiontree_model.predict_proba(X_test)[:,1])

plt.figure()

# 随机森林 ROC
plt.plot(rf_fpr, rf_tpr, label='随机森林(面积 = %0.2f)' % roc_auc_score(y_test,decisiontree_model.predict(X_test)))

# 决策树 ROC
plt.plot(dt_fpr, dt_tpr, label='决策树(面积 = %0.2f)' % roc_auc_score(y_test,randomforest_model.predict(X_test)))
# 绘图
plt.xlim([0.0, 1.0])
plt.ylim([0.0, 1.05])
plt.xlabel('假阳性率(FPR)')
plt.ylabel('真阳性率(TPR)')
plt.title('ROC曲线')
plt.legend(loc="lower right")
plt.show()
pr曲线
from sklearn.metrics import precision_recall_curve

# 计算pr曲线
rf_precision, rf_recall, rf_thresholds = precision_recall_curve(y_test, randomforest_model.predict(X_test))
dt_precision, dt_recall, dt_thresholds = precision_recall_curve(y_test, decisiontree_model.predict(X_test))

plt.figure()
# 随机森林 ROC
plt.plot(rf_precision, rf_recall, label='随机森林')

# 决策树 ROC
plt.plot(dt_precision, dt_recall, label='决策树')
# 绘图
plt.xlim([0.0, 1.0])
plt.ylim([0.0, 1.05])
plt.xlabel('召回率')
plt.ylabel('准确率')
plt.title('pr曲线')
plt.legend(loc="lower right")
plt.show()
集成方法在下篇
