python机器学习————使用sklearn实现Iris数据集KMeans聚类
首先我们对Iris数据集(鸢尾花数据集)进行简单介绍:
- 它分为三个类别,即Iris setosa(山鸢尾)、Iris versicolor(变色鸢尾)和Iris virginica(弗吉尼亚鸢尾),每个类别各有50个实例。
- 数据集定义了五个属性:sepal length(花萼长)、sepal width(花萼宽)、petal length(花瓣长)、petal width(花瓣宽)、class(类别)。
- 最后一个属性一般作为类别属性,其余属性为数值,单位为厘米。
鸢尾花数据集在sklearn中有保存,我们可以直接使用库中的数据集,也可以在这个网站对鸢尾花进行下载。
1、首先导入相应的库和数据
from sklearn import datasets		# 存放鸢尾花数据
from sklearn.cluster import KMeans	# 机器学习模型
import matplotlib.pyplot as plt
import pandas as pd

iris = datasets.load_iris()
iris_X = iris.data				# 花朵属性
iris_y = iris.target			# 花朵类别
print(iris_X[:3])
# [[5.1 3.5 1.4 0.2]
#  [4.9 3.  1.4 0.2]
#  [4.7 3.2 1.3 0.2]
print(iris_y)
# [0 0 0 0 0 0 0 0 0 0 0 0 0 0 0 0 0 0 0 0 0 0 0 0 0 0 0 0 0 0 0 0 0 0 0 0 0
#  0 0 0 0 0 0 0 0 0 0 0 0 0 1 1 1 1 1 1 1 1 1 1 1 1 1 1 1 1 1 1 1 1 1 1 1 1
#  1 1 1 1 1 1 1 1 1 1 1 1 1 1 1 1 1 1 1 1 1 1 1 1 1 1 2 2 2 2 2 2 2 2 2 2 2
#  2 2 2 2 2 2 2 2 2 2 2 2 2 2 2 2 2 2 2 2 2 2 2 2 2 2 2 2 2 2 2 2 2 2 2 2 2
#  2 2]
我们可以看到,花朵属性总共为4列,分别对应sepal length(花萼长)、sepal width(花萼宽)、petal length(花瓣长)、petal width(花瓣宽),这里我们只取了3行出来;类别我们分为了3类,分别对应了0、1、2.
2、取部分特征作散点图
plt.scatter(iris_X[:50,2],iris_X[:50,3],label='setosa',marker='o')
plt.scatter(iris_X[50:100,2],iris_X[50:100,3],label='versicolor',marker='x')
plt.scatter(iris_X[100:,2],iris_X[100:,3],label='virginica',marker='+')
plt.xlabel('petal length')
plt.ylabel('petal width')
plt.title("actual result")
plt.legend()
plt.show()

我们取它的petal length(花瓣长)、petal width(花瓣宽)作为特征作图
3、使用KMeans聚类算法实现簇的聚类
km = KMeans(n_clusters=3)			# 设定簇的定值为3
km.fit(iris_X)						# 对数据进行聚类
4、数值分析
- 各簇中心坐标
center = km.cluster_centers_
print(center)
# [[5.006      3.428      1.462      0.246     ]
#  [5.9016129  2.7483871  4.39354839 1.43387097]
#  [6.85       3.07368421 5.74210526 2.07105263]]
- 各簇聚类数量
num = pd.Series(km.labels_).value_counts()
print(num)
# 0    62
# 1    50
# 2    38
# dtype: int64
- 数据聚类结果
y_train = pd.Series(km.labels_)
y_train.rename('res',inplace=True)
print(y_train)
# 0      1
# 1      1
# 2      1
# 3      1
# 4      1
#       ..
# 145    2
# 146    0
# 147    2
# 148    2
# 149    0
# Name: res, Length: 150, dtype: int32
- 拼接数据与聚类结果
result = pd.concat([pd.DataFrame(iris_X),y_train],axis=1)
print(result)
#        0    1    2    3  res
# 0    5.1  3.5  1.4  0.2    0
# 1    4.9  3.0  1.4  0.2    0
# 2    4.7  3.2  1.3  0.2    0
# 3    4.6  3.1  1.5  0.2    0
# 4    5.0  3.6  1.4  0.2    0
# ..   ...  ...  ...  ...  ...
# 145  6.7  3.0  5.2  2.3    2
# 146  6.3  2.5  5.0  1.9    1
# 147  6.5  3.0  5.2  2.0    2
# 148  6.2  3.4  5.4  2.3    2
# 149  5.9  3.0  5.1  1.8    1
# [150 rows x 5 columns]
5、 作图对比
5.1 划分学习后的类别数据
Category_one = result[result['res'].values == 0]
k1 = result.iloc[Category_one.index]
# print(k1)
Category_two = result[result['res'].values == 1]
k2 = result.iloc[Category_two.index]
# print(k2)
Category_three = result[result['res'].values == 2]
k3 =result.iloc[Category_three.index]
# print(k3)
因为这里每次运行学习到的族不同,所以这里不能做簇区分,只能分为1、2、3簇
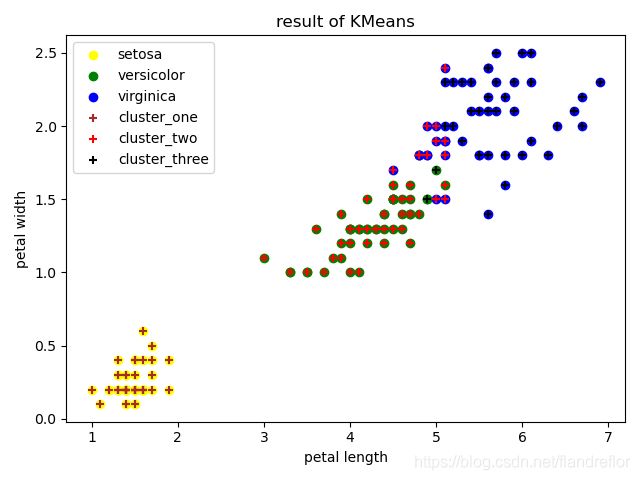
5.2 作散点对比图
# 原始数据的特征散点图
plt.scatter(iris_X[:50,2],iris_X[:50,3],label='setosa',marker='o',c='yellow')
plt.scatter(iris_X[50:100,2],iris_X[50:100,3],label='versicolor',marker='o',c='green')
plt.scatter(iris_X[100:,2],iris_X[100:,3],label='virginica',marker='o',c='blue')
# 机器学习后数据的特征散点图
plt.scatter(k1.iloc[:,2],k1.iloc[:,3],label='cluster_one',marker='+',c='brown')
plt.scatter(k2.iloc[:,2],k2.iloc[:,3],label='cluster_two',marker='+',c='red')
plt.scatter(k3.iloc[:,2],k3.iloc[:,3],label='cluster_three',marker='+',c='black')
plt.xlabel('petal length')			# 花瓣长
plt.ylabel('petal width')			# 花瓣宽
plt.title("result of KMeans")
plt.legend()
plt.show()

我们可以看到,左下角的setosa簇是学习最好的,中间的versicolor簇学习到了一些virginica的点,virginica也学习到了两个versicolor的点