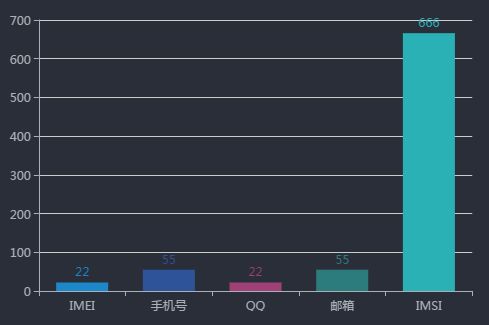
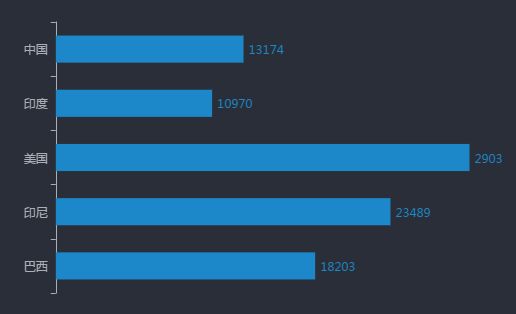
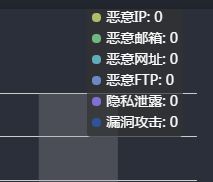
Echarts柱状图每个柱设置不同的颜色 效果如下图
series:[
    {
        name:'邮箱',
        type:'bar',
        barWidth:'60%',
        label:{
            normal:{
                show:true,
                position:'top'
            }
        },
        itemStyle:{
            normal:{
                color:function(params){
                    letcolorList=[
                        '#1c88c9',
                        '#2e5399',
                        '#9f4176',
                        '#2c7c7d',
                        '#2ab1b5',
                    ];
                    returncolorList[params.dataIndex];
                }
                //每个柱子的颜色即为colorList数组里的每一项,如果柱子数目多于colorList的长度,则柱子颜色循环使用该数组
            },
        },
        data:[22,55,22,55,666]
    },
]
Echarts取消网格线
xAxis:{
    type:'value',
    show:false,
    splitLine:{
        show:false
    }
}
比如X轴的设置 show属性是设置X轴是否显示 splitLine是设置网格线是否显示
然后如上图 要使Y轴是柱型数据
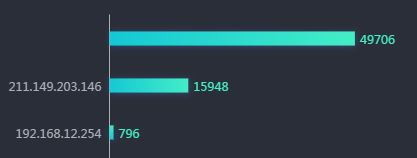
Echarts设置渐变色
series:[
    {
        type:'bar',
        barWidth:'30%',
        itemStyle:{
            normal:{
                //重点在于利用Echarts内置的渐变色生成器,其中
                color:new echarts.graphic.LinearGradient(
                1,0,0,1,
                [
                    {offset:1,color:'#14c8d4'},
                    {offset:0,color:'#43eec6'}
                ]
            ),
            //有关shadow的属性用来设置阴影颜色及偏移
            shadowBlur:10,
            shadowColor:'rgba(67,138,298,0.3)',
            shadowOffsetX:[1],
            shadowOffsetY:[1],
        },
    },
]
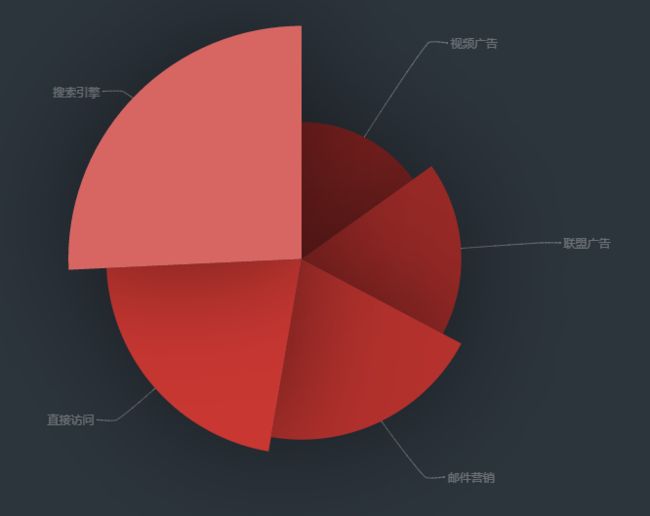
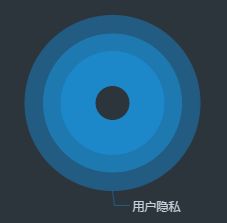
南丁格尔图,通过半径区分数据大小
可选择两种模式:
'radius' 扇区圆心角展现数据的百分比,半径展现数据的大小。
'area' 所有扇区圆心角相同,仅通过半径展现数据大小。
关键代码如下:
series : [
        {
            roseType: 'radius'
        }
]
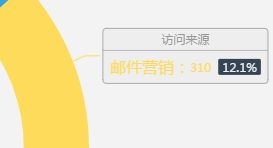
比较复杂的label写法
 series: [
        {
            name:'访问来源',
            type:'pie',
            radius: ['40%', '55%'],
            label: {
                normal: {
                    formatter: '{a|{a}}{abg|}\n{hr|}\n  {b|{b}:}{c}  {per|{d}%}  ',
                    backgroundColor: '#eee',
                    borderColor: '#aaa',
                    borderWidth: 1,
                    borderRadius: 4,
                    rich: {
                        a: {
                            color: '#999',
                            lineHeight: 22,
                            align: 'center'
                        },
                        hr: {
                            borderColor: '#aaa',
                            width: '100%',
                            borderWidth: 0.5,
                            height: 0
                        },
                        b: {
                            fontSize: 16,
                            lineHeight: 33
                        },
                        per: {
                            color: '#eee',
                            backgroundColor: '#334455',
                            padding: [2, 4],
                            borderRadius: 2
                        }
                    }
                }
            },
        }
    ]
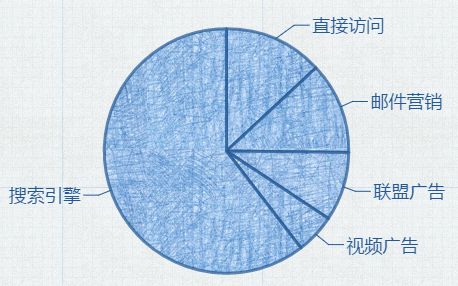
配置饼图的颜色 线性渐变或者自定义图片背景
// 线性渐变,前四个参数分别是 x0, y0, x2, y2, 范围从 0 - 1,相当于在图形包围盒中的百分比,如果 globalCoord 为 `true`,则该四个值是绝对的像素位置
color: {
    type: 'linear',
    x: 0,
    y: 0,
    x2: 0,
    y2: 1,
    colorStops: [{
        offset: 0, color: 'red' // 0% 处的颜色
    }, {
        offset: 1, color: 'blue' // 100% 处的颜色
    }],
    globalCoord: false // 缺省为 false
}
// 径向渐变,前三个参数分别是圆心 x, y 和半径,取值同线性渐变
color: {
    type: 'radial',
    x: 0.5,
    y: 0.5,
    r: 0.5,
    colorStops: [{
        offset: 0, color: 'red' // 0% 处的颜色
    }, {
        offset: 1, color: 'blue' // 100% 处的颜色
    }],
    globalCoord: false // 缺省为 false
}
// 纹理填充
color: {
    image: imageDom, // 支持为 HTMLImageElement, HTMLCanvasElement,不支持路径字符串
    repeat: 'repeat' // 是否平铺, 可以是 'repeat-x', 'repeat-y', 'no-repeat'
}
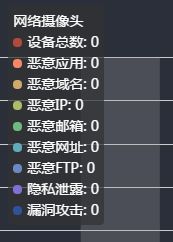
关于tooltip的位置可能超出图表容器
设置tooltip的位置 代码如下
  // 绝对位置,相对于容器左侧 10px, 上侧 10 px
  position: [10, 10]
  // 相对位置,放置在容器正中间
  position: ['50%', '50%']
  position: function (point, params, dom, rect, size) {
      // 固定在顶部
      return [point[0], '10%'];
  }

参数:
point: 鼠标位置,如 [20, 40]。
params: 同 formatter 的参数相同。
dom: tooltip 的 dom 对象。
rect: 只有鼠标在图形上时有效,是一个用x, y, width, height四个属性表达的图形包围盒。
size: 包括 dom 的尺寸和 echarts 容器的当前尺寸,例如:{contentSize: [width, height], viewSize: [width, height]}。
返回值:
可以是一个表示 tooltip 位置的数组,数组值可以是绝对的像素值,也可以是相 百分比。
也可以是一个对象,如:{left: 10, top: 30},或者 {right: '20%', bottom: 40}。
