AUC举例数据
y = [1,1,1,1,1,1,0,0,0,1,1,0,0,1,1,0,0,1,1,0,0]
prob = [0.42,0.73,0.55,0.37,0.57,0.70,0.25,0.23,0.46,0.62,0.76,0.46,0.55,0.56,0.56,0.38,0.37,0.73,0.77,0.21,0.39]
导包
import numpy as np
from scipy import interp
import matplotlib.pyplot as plt
%matplotlib inline
from sklearn import svm, datasets
from sklearn.metrics import roc_curve, auc
from sklearn.model_selection import StratifiedKFold
加载数据iris并添加噪声
iris = datasets.load_iris()
X = iris.data
y = iris.target
X, y = X[y != 2], y[y != 2]
n_samples, n_features = X.shape
random_state = np.random.RandomState(0)
X = np.c_[X, random_state.randn(n_samples, 200 * n_features)]
声明算法
cv = StratifiedKFold(n_splits=6)
classifier = svm.SVC(kernel='linear', probability=True,random_state=random_state)

tprs = []
aucs = []
mean_fpr = np.linspace(0, 1, 100)
批量训练计算ROC
i = 0
for train, test in cv.split(X, y):
probas_ = classifier.fit(X[train], y[train]).predict_proba(X[test])
y_ = classifier.predict(X[test])
fpr, tpr, thresholds = roc_curve(y[test], probas_[:, 1])
tprs.append(interp(mean_fpr, fpr, tpr))
tprs[-1][0] = 0.0
roc_auc = auc(fpr, tpr)
aucs.append(roc_auc)
plt.plot(fpr, tpr, lw=1, alpha=0.3,
label='ROC fold %d (AUC = %0.2f)' % (i, roc_auc))
i += 1
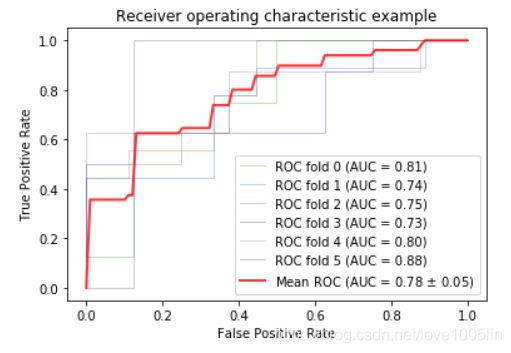
计算平均ROC
mean_tpr = np.mean(tprs, axis=0)
mean_tpr[-1] = 1.0
mean_auc = auc(mean_fpr, mean_tpr)
std_auc = np.std(aucs)
plt.plot(mean_fpr, mean_tpr, color='b',
         label=r'Mean ROC (AUC = %0.2f $\pm$ %0.2f)' % (mean_auc, std_auc),
         lw=2, alpha=.8)
设置绘图
plt.xlim([-0.05, 1.05])
plt.ylim([-0.05, 1.05])
plt.xlabel('False Positive Rate')
plt.ylabel('True Positive Rate')
plt.title('Receiver operating characteristic example')
plt.legend(loc="lower right")
plt.show()