聪明钱因子(R语言实现)
聪明钱因子
最近回到了csdn,打算记录一下自己在量化策略方面的学习历程。
正好最近也快R语言的期末考试了,这几天就用R实现了一个简单的聪明钱因子,但不得不说R语言的读入数据是真的慢。。。
根据研报上的信息,将 α = ∣ p c t c h g ∣ v o l u m e \alpha=\frac{|pct_{chg}|}{\sqrt{volume}} α=volume∣pctchg∣作为一个中间变量,其中 p c t c h g pct_{chg} pctchg为涨跌幅, v o l u m e volume volume为交易量,对每分钟的交易数据处理 α \alpha α。
其中, α \alpha α可以认为是交易行为聪明度的体现,
当涨跌幅大,交易量小时,则 α \alpha α大,在此时间段进行的交易更为聪明。(简单理解为 涨跌代表套利空间,交易量小代表行动是否有先瞻性)
令 β \beta β为聪明钱交易中前1/4不聪明的分钟记录 的交易均价 除以 整个周期内的交易均价(周期设置为一周)
β \beta β值越小,则代表价格底部发生了大量的聪明交易,往往是建仓的信号; β \beta β值越大,则代表价格顶部发生了大量的聪明交易,往往是出货的信号。
因此,根据 β \beta β值将股票池中的股票从小到大分为三组,空仓组、无仓组、多仓组,将多仓组、无仓组进行对冲后即可得到简单的聪明钱因子 实现。(根据上周数据决定本周开盘首日调仓行为)
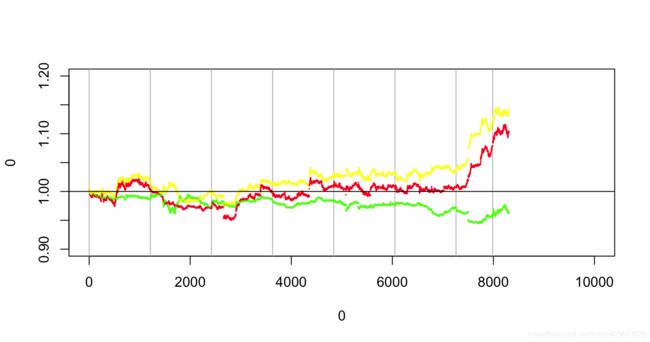
数据选取了2020-4-30 9:30am 开始的10,000条分钟数列,对冲结果表现还行。
囿于数据确实,没有办法进行更多股票池与更长时间的测试。
rm(list=ls())
wd="~/Desktop/QuantData"
setwd(wd)

filename=c('002001.SZ.xlsx',
           '002216.SZ.xlsx',
           '300274.SZ.xlsx',
           '600009.SH.xlsx',
           '600048.SH.xlsx',
           '600377.SH.xlsx',
           '600519.SH.xlsx',
           '600535.SH.xlsx',
           '600585.SH.xlsx',
           '601186.SH.xlsx',
           '601398.SH.xlsx',
           '601966.SH.xlsx',
           '603288.SH.xlsx')
library(xlsx)
?read.xlsx
DATA=NULL

for(i in filename)
{

  print(i)
  tmp=read.xlsx(file=i,sheetIndex=1,startRow=3)
  tmp["name"]=i
  tmp["price"]=tmp['amt']/tmp['volume']
  for(j in 2:length(tmp$price))
    if(tmp$volume[j]==0)
      tmp$price[j]=tmp$price[j-1]
  tmp["fact"]=abs(tmp["pct_chg"])/(sqrt(tmp["volume"]))*1e4
  DATA=rbind(DATA,tmp)
}


MAXTIME=max(DATA$Time)
minutes=60
hours=3600
days=3600*24
weeks=7*days
t=DATA$Time[1]
ed=t+weeks
?aggregate
buy=matrix(rep(0,length(DATA$Time)),nrow=length(filename))
weekn=1
while(t<MAXTIME)
{

  st=t
  ed=st+weeks
  tmp=DATA[which((DATA$Time<ed)&(DATA$Time>=st)),]
  t=ed
  n=0
  l=rep(0,length(filename))

  for(i in 1:length(filename))
{

    tmp2=tmp[which(tmp$name==filename[i]),"fact"]
    tmp2=as.numeric((tmp2))+1e-7*(1:length(tmp2))
  #  tmp2=sort(tmp2)
  #  l[i]=sum(tmp2[1:as.integer(length(tmp2)/4)])/sum(tmp2)
    tmp2=rank(tmp2)
    smart_rank=which(tmp2<=as.integer(length(tmp2)/4))
    l[i]=sum(tmp[smart_rank,"amt"])/sum(tmp[smart_rank,"volume"])/(sum(tmp["amt"])/sum(tmp["volume"]))
  }
  short_p=quantile(l,probs=0.25)
  long_p=quantile(l,probs=0.75)
  short_index= which(l<=short_p)
  long_index=which(l>long_p)
  weekn=weekn+1
  buy[short_index,weekn]=-1
  buy[long_index,weekn]=1

}


long_ret=1
short_ret=1

st=DATA$Time[1]
st=weeks*2+st
laslong=1
lasshort=1
long_cnt=NULL
short_cnt=NULL
plot.new()

plot(x=0,y=0,xlim=c(0,10000),ylim=c(0.9,1.2),cex=0.1)


la_point_cnt=0
point_cnt=0
for( i in (2:(weekn-1)))
{

  long_index=which(buy[,i]==1)
  short_index=which(buy[,i]==-1)
  ed=st+weeks

  tmp=DATA[which((DATA$Time<ed)&(DATA$Time>=st)),]
  if(length(tmp$Time)==0)
    next
  totl=0
  for(j in long_index)
  {

      tmp2=tmp[which(tmp$name==filename[j]),]
      price=tmp2$price[1]
      totl=totl+price
  }
  tots=0
  for(j in short_index)
  {

    tmp2=tmp[which(tmp$name==filename[j]),]
    price=tmp2$price[1]
    tots=tots+price
  }
  totl=totl/length(long_index)
  tots=tots/length(short_index)

  if(i==2)
  {

    ss=1
    sl=1
    lasshort=tots
    laslong=totl
  }else
  {

    ss=short_cnt[point_cnt]
    sl=long_cnt[point_cnt]
    lasshort=tots
    laslong=totl
  }
  ss=ss*1.0001
  sl=sl*0.9999
  time_length=as.integer(length(tmp$Time)/length(filename))
  short_start=short_index[1:length(short_index)]-1
  short_start=short_start*time_length
  long_start=long_index[1:length(long_index)]-1
  long_start=long_start*time_length
  abline(v=point_cnt,col='grey')
  print (0-la_point_cnt+point_cnt)
  la_point_cnt=point_cnt
  for(j in 1:time_length)
  {

    for(ck in short_start)
      if(all(filename[short_index]!=tmp[ck+j,'name']))
        print("short_error")

    stmp=ss*mean(tmp[short_start+j,"price"])/lasshort
    ltmp=sl*mean(tmp[long_start+j,"price"])/laslong
    short_cnt=c(short_cnt,stmp)
    long_cnt=c(long_cnt,ltmp)
    point_cnt=point_cnt+1

    if(point_cnt>=5079&&point_cnt<=5083)
    {

      print(short_start)
      print(stmp)
      print(tmp[short_start+j,"name"])

      print(tmp[short_start+j-1,"price"])
      print(tmp[short_start+j,"price"])
      print(tmp[short_start+j,"Time"])
      print("\n")
      print("\n")

      }

    points(x=point_cnt,y=stmp,col='green',cex=0.1)
    points(x=point_cnt,y=ltmp,col='red',cex=0.1)

    points(x=point_cnt,y=1+ltmp-stmp,col='yellow',cex=0.1)

  }

  st=ed
}


abline(h=1)
