Vue引入echarts报错Error in mounted hook: “TypeError: Cannot read property ‘getAttribute‘ of null“
问题出现场景
  今天在vue中引入echarts时,运行报错
   [Vue warn]: Error in mounted hook: "TypeError: Cannot read property 'getAttribute' of null】

   ## 问题排查
   在运行Vue项目时出现了上述错误,出现该错误的原因是Echarts的图形容器还未生成就对其进行了初始化所造成的,代码如下:
 var myChart = echarts.init(this.$refs.map)
      myChart.setOption(this.mapOption)
  ## 解决办法
  利用Vue中的ref和$refs 来代替document.getElementById()获取该图形容器对象,代码如下:
<template>
  <div>
    <baidu-map class="bm-view" center="北京">
    </baidu-map>
    <div ref="mapOption" style="height:600px;width:600px;background: #333" ></div>
  </div>
</template>

<script>
import 'echarts/map/js/province/guangdong.js' // 引入广东地图
export default {

  data () {

    return {

      mapOption: {

        title: {

          text: '订阅我博客的人群分布',
          x: 'center'
        },
        tooltip: {

          trigger: 'item'
        },
        legend: {

          orient: 'vertical',
          x: 'left',
          data: ['iphoneX']
        },
        dataRange: {

          min: 0,
          max: 2500,
          x: 'left',
          y: 'bottom',
          text: ['max', 'min'],
          calculable: true
        },
        toolbox: {

          show: true,
          orient: 'vertical',
          x: 'right',
          y: 'center',
          feature: {

            mark: {
     show: true},
            dataView: {
     show: true, readOnly: false},
            restore: {
     show: true},
            saveAsImage: {
     show: true}
          }
        },
        roamController: {

          show: true,
          x: 'right',
          mapTypeControl: {

            'china': true
          }
        },
        series: [
          {

            name: 'iphoneX',
            type: 'map',
            mapType: '广东',
            roam: false,
            itemStyle: {

              normal: {
     label: {
     show: true}},
              emphasis: {
     label: {
     show: true}}
            },
            data: [
              {
     name: '珠海市', value: 130},
              {
     name: '广州市', value: 50},
              {
     name: '中山市', value: 31},
              {
     name: '佛山市', value: 55},
              {
     name: '清远市', value: 90},
              {
     name: '梅州市', value: 10},
              {
     name: '汕头市', value: 70},
              {
     name: '东莞市', value: 50},
              {
     name: '惠州市', value: 30},
              {
     name: '深圳市', value: 50}
            ]
          }
        ]
      }
    }
  },
  // 钩子函数  不了解的话 建议看看 vue的生命周期
  mounted () {

    this.mapEchartsInit()
  },
  methods: {

    mapEchartsInit () {

      this.$echarts.init(this.$refs.mapOption).setOption(this.mapOption)
    }
  }
}
</script>

<style scoped>
  .bm-view {

    width: 100%;
    height: 300px;
  }
</style>
以上代码是vue中显示地图的代码,可以在直接使用,前提需要引入echarts
到此为止该问题就算解决了,如果觉得还可以点个赞哦!
顺便总结下其他网友出现的场景和解决办法
错误场景二:
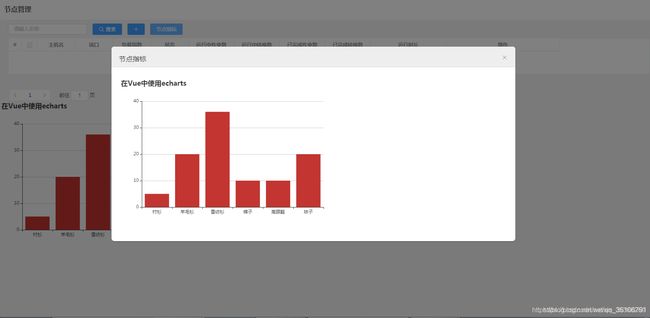
当我想在el-dialog对话框中展示Echarts图表时,出现了如下错误:
问题定位:
经过反复的调试后发现,通过$refs获取不到 el-dialog对话框中的子组件对象,返回的都是undefined,这也就导致了上图的错误。
解决办法:
在通过this.$refs 获取el-dialog对话框中的子组件对象之前加入以下函数即可:
this.$nextTick(function () {


});
全部代码如下:
<template>
  <el-dialog ref="dialog_root" title="节点指标" :visible="isShowDialog" @close="hideData()" width="60%">
    <!--负载情况-->
    <div ref="bar_dv"  :style="{width:'600px',height:'400px'}">
    </div>


  </el-dialog>
</template>

<script>
  import echarts from 'echarts'
    export default {

        name: "NodeIndexDialog",
      props: {

        isShowDialog: {

          type: Boolean,
          default: false,
        },
      },
      mounted(){

        console.log('mounted()');
          this.$nextTick(function () {

            this.drawLine();
          });

      },
      methods:{

          /*
          负载情况图标
           */
        drawLine(){


          let bar_dv = this.$refs.bar_dv;
          let myChart = echarts.init(bar_dv);
          // 绘制图表
          myChart.setOption({

            title: {
      text: '在Vue中使用echarts' },
            tooltip: {
     },
            xAxis: {

              data: ["衬衫","羊毛衫","雪纺衫","裤子","高跟鞋","袜子"]
            },
            yAxis: {
     },
            series: [{

              name: '销量',
              type: 'bar',
              data: [5, 20, 36, 10, 10, 20]
            }]
          });
        },

        hideData() {

          this.$emit("hideDialog")
        },

        confirm(){

          this.hideData();

        },

      }
    }
</script>

<style scoped>

</style>

