Python时间序列--ARIMA模型参数选择(六)
ARIMA模型参数选择流程
import pandas as pd
import numpy as np

# TSA from Statsmodels
import statsmodels.api as sm
import statsmodels.formula.api as smf
import statsmodels.tsa.api as smt

# Display and Plotting
import matplotlib.pylab as plt
import seaborn as sns

pd.set_option('display.float_format', lambda x: '%.5f' % x) # pandas
np.set_printoptions(precision=5, suppress=True) # numpy

pd.set_option('display.max_columns', 100)
pd.set_option('display.max_rows', 100)

# seaborn plotting style
sns.set(style='ticks', context='poster')
#parse_dates参数:将csv中的时间字符串转换成日期格式
#index_col=0 第一列为index值
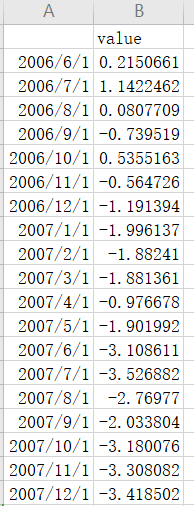
ts_df = pd.read_csv('data/series1.csv',
                    index_col=0, parse_dates=[0])
n_sample = ts_df.shape[0]
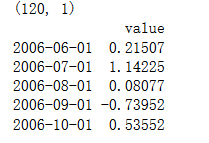
print(ts_df.shape)
print(ts_df.head())
# 创建训练集和测试集
n_train=int(0.95*n_sample)+1 #95%作为训练集
n_forecast=n_sample-n_train #5%作为测试集
#ts_df
ts_train = ts_df.iloc[:n_train]['value']
ts_test = ts_df.iloc[n_train:]['value']
3.统计图、ACF、PACF图
'''
使用plt.subplot2grid来创建第1个小图, (3,3)表示将整个图像窗口分成3行3列, (0,0)表示从第0行第0列开始作图,colspan=3表示列的跨度为3, rowspan=1表示行的跨度为1. colspan和rowspan缺省, 默认跨度为1.
ax1 = plt.subplot2grid((3, 3), (1, 0), colspan=2)
使用plt.subplot2grid来创建第2个小图, (3,3)表示将整个图像窗口分成3行3列, (1,0)表示从第1行第0列开始作图,colspan=2表示列的跨度为2. 同上画出 ax3, (1,2)表示从第1行第2列开始作图,rowspan=2表示行的跨度为2. 再画一个 ax4 和 ax5, 使用默认 colspan, rowspan。
ax2 = plt.subplot2grid((3, 3), (1, 2), rowspan=2)
'''

def tsplot(y, lags=None, title='', figsize=(14, 8)):

    fig = plt.figure(figsize=figsize)
    layout = (2, 2)
    ts_ax   = plt.subplot2grid(layout, (0, 0))
    hist_ax = plt.subplot2grid(layout, (0, 1))
    acf_ax  = plt.subplot2grid(layout, (1, 0))
    pacf_ax = plt.subplot2grid(layout, (1, 1))

    y.plot(ax=ts_ax)
    ts_ax.set_title(title)
    y.plot(ax=hist_ax, kind='hist', bins=25)
    hist_ax.set_title('Histogram')
    smt.graphics.plot_acf(y, lags=lags, ax=acf_ax)
    smt.graphics.plot_pacf(y, lags=lags, ax=pacf_ax)
    [ax.set_xlim(0) for ax in [acf_ax, pacf_ax]]
    sns.despine()
    fig.tight_layout()
    return ts_ax, acf_ax, pacf_ax
tsplot(ts_train, title='A Given Training Series', lags=20);
arima200 = sm.tsa.SARIMAX(ts_train, order=(2,0,0))
model_results = arima200.fit()
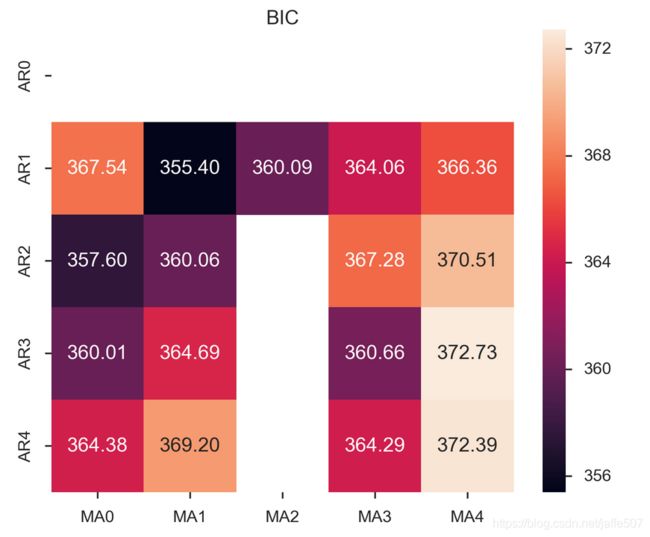
当ACF图和PACF图显示pq值可能有多个值,可以用组合的方式确定更好的pq值
import itertools

p_min = 0
d_min = 0
q_min = 0
p_max = 4
d_max = 0
q_max = 4

# Initialize a DataFrame to store the results
results_bic = pd.DataFrame(index=['AR{}'.format(i) for i in range(p_min,p_max+1)],
                           columns=['MA{}'.format(i) for i in range(q_min,q_max+1)])

for p,d,q in itertools.product(range(p_min,p_max+1),
                               range(d_min,d_max+1),
                               range(q_min,q_max+1)):
    if p==0 and d==0 and q==0:
        results_bic.loc['AR{}'.format(p), 'MA{}'.format(q)] = np.nan
        continue

    try:
        model = sm.tsa.SARIMAX(ts_train, order=(p, d, q),
                               #enforce_stationarity=False,
                               #enforce_invertibility=False,
                              )
        results = model.fit()
        results_bic.loc['AR{}'.format(p), 'MA{}'.format(q)] = results.bic
    except:
        continue
results_bic = results_bic[results_bic.columns].astype(float)
利用BIC或AIC来确定,值越小越好。
fig, ax = plt.subplots(figsize=(10, 8))
ax = sns.heatmap(results_bic,
                 mask=results_bic.isnull(),
                 ax=ax,
                 annot=True,
                 fmt='.2f',
                 );
ax.set_title('BIC');
train_results = sm.tsa.arma_order_select_ic(
                            ts_train,
                            ic=['aic', 'bic'],
                            trend='nc',
                            max_ar=4,
                            max_ma=4)

print('AIC', train_results.aic_min_order)
print('BIC', train_results.bic_min_order)
out:
AIC (4, 2)
BIC (1, 1)
5.模型检测
模型残差检验:
- ARIMA模型的残差是否是平均值为0且方差为常数的正态分布
- QQ图:线性即正态分布
#残差分析 正态分布 QQ图线性
model_results.plot_diagnostics(figsize=(16, 12));


