pytorch 预测
重点(Top highlight)
I am pleased to announce the open-source Python package PyTorch Forecasting. It makes time series forecasting with neural networks simple both for data science practitioners and researchers.
我很高兴地宣布开源Python软件包PyTorch Forecasting 。 对于数据科学从业者和研究人员而言,它使使用神经网络进行时间序列预测变得简单。
为什么准确的预测如此重要? (Why is accurate forecasting so important?)
Forecasting time series is important in many contexts and highly relevant to machine learning practitioners. Take, for example, demand forecasting from which many use cases derive. Almost every manufacturer would benefit from better understanding demand for their products in order to optimise produced quantities. Underproduce and you will lose revenues, overproduce and you will be forced to sell excess produce at a discount. Very related is pricing, which is essentially a demand forecast with a specific focus on price elasticity. Pricing is relevant to virtually all companies.
预测时间序列在许多情况下都很重要,并且与机器学习从业者高度相关。 以需求预测为例,从中可以得出许多用例。 几乎每个制造商都将从对产品需求的了解中受益,从而优化产量。 生产不足,您将损失收入,生产过剩,您将被迫以折扣价出售多余的产品。 与定价息息相关的是定价,本质上是需求预测,特别关注价格弹性。 定价实际上与所有公司有关。
For a large number of additional machine learning applications time is of the essence: predictive maintenance, risk scoring, fraud detection, etc. — you name it. The order of events and time between them is crucial to create a reliable forecast.
对于大量其他机器学习应用程序来说,时间至关重要:预测性维护,风险评分,欺诈检测等-随便你说吧。 事件之间的顺序和时间对创建可靠的预测至关重要。
In fact, while time series forecasting might not be as shiny as image recognition or language processing, it is more common in industry. This is because image recognition and language processing are relatively new to the field and are often used to power new products, while forecasting has been around for decades and sits at the heart of many decision (support) systems. The employment of high-accuracy machine learning models such as the ones in PyTorch Forecasting can better support decision making or even automate it, often directly resulting in multi-million dollars of additional profits.
实际上,尽管时间序列预测可能不如图像识别或语言处理那么闪亮,但在行业中更为普遍。 这是因为图像识别和语言处理在该领域相对较新,并且经常用于驱动新产品,而预测已经存在了数十年,并且是许多决策(支持)系统的核心。 像PyTorch预测中那样使用高精度的机器学习模型可以更好地支持决策甚至自动化,通常直接带来数百万美元的额外利润。
深度学习成为强大的预测工具 (Deep learning emerges as a powerful forecasting tool)
Deep learning (neural networks) has only recently outperformed traditional methods in time series forecasting, and has done so by a smaller margin than in image and language processing. In fact, in forecasting pure time series (which means without covariates, for example, price is to demand), deep learning has surpassed traditional statistical methods only two years ago [1]. However, as the field is quickly advancing, accuracy advantages associated with neural networks have become significant, which merits their increased use in time series forecasting. For example, the latest architecture N-BEATS demonstrates an 11% decrease in sMAPE on the M4 competition dataset compared to the next best non-neural-network-based method which is an ensemble of statistical methods [2]. This network is also implemented in PyTorch Forecasting.
深度学习(神经网络)直到最近才在时间序列预测方面胜过传统方法,并且与图像和语言处理相比,其实现幅度较小。 实际上,在预测纯时间序列时(这意味着没有协变量,例如,价格是必需的),深度学习仅在两年前就超过了传统的统计方法[1]。 但是,随着该领域的快速发展,与神经网络相关的准确性优势变得十分重要,这应将其在时间序列预测中的应用日益广泛。 例如,最新的体系结构N-BEATS与第二种基于非神经网络的最佳统计方法相比,在M4竞争数据集上的sMAPE降低了11%[2]。 PyTorch预测中也实现了该网络。
Furthermore, even compared to other popular machine learning algorithms, such as gradient boosted trees, deep learning has two advantages. First, neural network architectures can be designed with an inherent understanding of time, i.e. they automatically make a connection between temporally close data points. As a result, they can capture complex time dependencies. On the contrary, traditional machine learning models require manual creation of time series features, such as the average over the last x days. This diminishes the capabilities of these traditional machine learning algorithms to model time dependencies. Second, most tree-based models output a step function by design. Therefore, they cannot predict the marginal impact of change in inputs and, further, are notoriously unreliable in out-of-domain forecasts. For example, if we have observed only prices at 30 EUR and 50 EUR, tree-based models cannot assess the impact on demand of changing the price from 30 EUR to 35 EUR. In consequence, they often cannot directly be used to optimise inputs. However, this is often the whole point of creating a machine learning model — the value is in the optimisation of covariates. At the same time, neural networks employ continuous activation functions and are particularly good at interpolation in high-dimensional spaces, i.e. they can be used to optimise inputs, such as price.
此外,即使与其他流行的机器学习算法(例如,梯度增强树)相比,深度学习也有两个优点。 首先,可以在对时间有内在理解的情况下设计神经网络体系结构,即,它们可以自动在时间上接近的数据点之间建立连接。 结果,它们可以捕获复杂的时间依赖性。 相反,传统的机器学习模型需要手动创建时间序列特征,例如最近x天的平均值。 这削弱了这些传统机器学习算法建模时间依赖性的能力。 其次,大多数基于树的模型都是根据设计输出阶跃函数的。 因此,他们无法预测输入变化的边际影响,而且,众所周知,在域外预测中也不可靠。 例如,如果我们仅观察到30欧元和50欧元的价格,则基于树的模型无法评估将价格从30欧元更改为35欧元对需求的影响。 因此,它们通常不能直接用于优化输入。 但是,这通常是创建机器学习模型的全部要点-价值在于优化协变量。 同时,神经网络采用连续激活函数,特别擅长在高维空间中进行插值,即它们可用于优化输入(例如价格)。
什么是PyTorch预测? (What is PyTorch Forecasting?)
PyTorch Forecasting aims to ease time series forecasting with neural networks for real-world cases and research alike. It does so by providing state-of-the-art time series forecasting architectures that can be easily trained with pandas dataframes.
PyTorch Forecasting旨在通过神经网络简化针对实际案例和研究的时间序列预测。 通过提供最先进的时间序列预测体系结构,可以使用熊猫数据帧轻松对其进行培训。
The high-level API significantly reduces workload for users because no specific knowledge is required on how to prepare a dataset for training with PyTorch. The
TimeSeriesDataSetclass takes care of variable transformations, missing values, randomised subsampling, multiple history lengths, etc. You only need to provide the pandas dataframe and specify from which variables a model should learn.高级API大大减少了用户的工作量,因为不需要任何有关如何准备数据集进行PyTorch培训的专门知识。
TimeSeriesDataSet类负责变量转换,缺失值,随机子采样,多个历史记录长度等。您只需要提供pandas数据框并指定模型应该从哪些变量中学习即可。The
BaseModelclass provides generic visualisations such as showing predictions vs actuals and partial dependency plots. Training progress in the form of metrics and examples can be logged automatically in tensorboard.BaseModel类提供了通用的可视化效果,例如显示预测与实际情况以及部分依赖图。 可以将度量和示例形式的培训进度自动记录在tensorboard中。State-of-the-art networks are implemented for forecasting with and without covariates. They also come with dedicated in-built interpretation capabilities. For example, the Temporal Fusion Transformer [3], which has beaten Amazon’s DeepAR by 36–69% in benchmarks, comes with variable and time importance measures. See more on this in the example below.
实现了具有和不具有协变量的最新网络以进行预测。 它们还具有专用的内置解释功能。 例如, Temporal Fusion Transformer [3]在基准测试上击败了亚马逊的DeepAR达36–69%,它具有可变性和时间重要性指标。 在下面的示例中查看更多信息。
- A number of multi-horizon time series metrics exist to evaluate predictions over multiple prediction horizons. 存在许多多水平时间序列度量以评估多个预测范围内的预测。
For scalability, the networks are designed to work with PyTorch Lightning which allows training on CPUs and single and multiple (distributed) GPUs out-of-the-box. The Ranger optimiser is implemented for faster model training.
为了实现可扩展性,这些网络旨在与PyTorch Lightning配合使用,从而可以直接使用CPU以及单个和多个(分布式)GPU进行培训。 实施了Ranger优化器以加快模型训练的速度。
To facilitate experimentation and research, adding networks is straightforward. The code has been explicitly designed with PyTorch experts in mind. They will find it easy to implement even complex ideas. In fact, one has only to inherit from the
BaseModelclass and follow a convention for the forward’s method input and output, in order to immediately enable logging and interpretation capabilities.为了促进实验和研究,添加网络非常简单。 该代码已明确考虑了PyTorch专家的要求。 他们会发现,即使实施复杂的构想也很容易。 实际上,为了立即启用日志记录和解释功能,仅必须继承自
BaseModel类并遵循前向方法输入和输出的约定。
To get started, detailed tutorials in the documentation showcase end-to-end workflows. I will also discuss a concrete example later in this article.
首先,文档中的详细教程展示了端到端的工作流程。 我还将在本文后面讨论一个具体示例。
我们为什么需要这个包裹? (Why do we need this package?)
PyTorch Forecasting helps overcome important barriers to the usage of deep learning. While deep learning has become dominant in image and language processing, this is less so in time series forecasting. The field remains dominated by traditional statistical methods such as ARIMA and machine learning algorithms such as gradient boosting, with the odd exemption of a Bayesian model. The reasons why deep learning has not yet become mainstream in time series forecasting are two-fold, all of which can already be overcome:
PyTorch预测有助于克服使用深度学习的重要障碍。 尽管深度学习已在图像和语言处理中占主导地位,但在时间序列预测中却不那么重要。 该领域仍然由传统统计方法(如ARIMA)和机器学习算法(如梯度增强)以及贝叶斯模型的奇数豁免所主导。 深度学习尚未在时间序列预测中成为主流的原因有两个,所有这些都可以克服:
- Training neural networks almost always require GPUs which are not always readily available. Hardware requirements are often an important impediment. However, by moving computation into the cloud this hurdle can be overcome. 训练神经网络几乎总是需要GPU,但这些GPU并非总是可以立即获得。 硬件要求通常是一个重要的障碍。 但是,通过将计算移动到云中,可以克服这一障碍。
- Neural networks are comparably harder to use than traditional methods. This is particularly the case for time series forecasting. There is a lack of a high-level API that works with the popular frameworks, such as PyTorch by Facebook or Tensorflow by Google. For traditional machine learning the sci-kit learn ecosystem exists which provides a standardised interface for practitioners. 与传统方法相比,神经网络更难使用。 时间序列预测尤其如此。 缺少与流行框架兼容的高级API,例如Facebook的PyTorch或Google的Tensorflow。 对于传统的机器学习,存在sci-kit学习生态系统,该生态系统为从业人员提供了标准化的界面。
This third hurdle is considered crucial in the deep learning community given its user-unfriendliness requires substantial software engineering. The following tweet summarises the sentiment of many:
考虑到它的第三个障碍在深度学习社区中至关重要,因为它的用户不友好要求大量的软件工程。 以下推文总结了许多人的观点:
演示地址
Some even thought the statement was trivial:
有人甚至认为该声明是微不足道的:
演示地址
In a nutshell, PyTorch Forecasting aims to do what fast.ai has done for image recognition and natural language processing. That is significantly contributing to the proliferation of neural networks from academia into the real world. PyTorch Forecasting seeks to do the equivalent for time series forecasting by providing a high-level API for PyTorch that can directly make use of pandas dataframes. To facilitate learning it, unlike fast.ai, the package does not create a completely new API but rather builds on the well-established PyTorch and PyTorch Lightning APIs.
简而言之, PyTorch Forecasting旨在做fast.ai在图像识别和自然语言处理方面所做的工作。 这极大地促进了神经网络从学术界向现实世界的扩散。 PyTorch预测通过为PyTorch提供可以直接利用熊猫数据帧的高级API来尝试进行时间序列预测。 为了方便学习,与fast.ai不同,该软件包不会创建全新的API,而是在完善的PyTorch和PyTorch Lightning API的基础上构建。
如何使用PyTorch预测? (How to use PyTorch Forecasting?)
This small example showcases the power of the package and its most important abstractions. We will
这个小例子展示了程序包的功能及其最重要的抽象。 我们会
- create a training and validation dataset,创建训练和验证数据集,
train the Temporal Fusion Transformer [2]. This is an architecture developed by Oxford University and Google that has beaten Amazon’s DeepAR by 36–69% in benchmarks,
训练时间融合变压器[2]。 这是由牛津大学和Google开发的架构,在基准测试中已经击败了亚马逊的DeepAR 36-69%,
- inspect results on the validation set and interpret the trained model. 检查验证集上的结果并解释经过训练的模型。
NOTE: The code below works only up to version 0.4.1 of PyTorch Forecasting and 0.9.0 of PyTorch Lightning. Minimal modifications are required to run with the latest version. A full tutorial with the latest code can be found here.
注意:以下代码仅适用于PyTorch Forecasting的0.4.1版本和PyTorch Lightning的0.9.0版本。 要使用最新版本,需要进行最小的修改。 完整的教程以及最新的代码可以在这里找到。
创建用于训练和验证的数据集 (Creating datasets for training and validation)
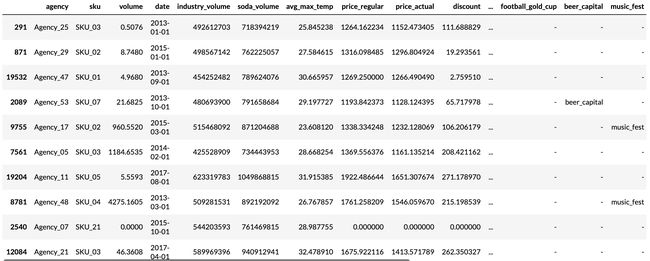
First, we need to transform our time series into a pandas dataframe where each row can be identified with a time step and a time series. Fortunately, most datasets are already in this format. For this tutorial, we will use the Stallion dataset from Kaggle describing sales of various beverages. Our task is to make a six-month forecast of the sold volume by stock keeping units (SKU), that is products, sold by an agency, that is a store. There are about 21 000 monthly historic sales records. In addition to historic sales we have information about the sales price, the location of the agency, special days such as holidays, and volume sold in the entire industry.
首先,我们需要将时间序列转换为pandas数据帧,在该数据帧中可以使用时间步长和时间序列来标识每一行。 幸运的是,大多数数据集已经采用这种格式。 在本教程中,我们将使用Kaggle的Stallion数据集来描述各种饮料的销售。 我们的任务是通过库存单位(SKU)对销售量进行六个月的预测,SKU是由代理商(即商店)出售的产品。 每月大约有21000个历史销售记录。 除了历史销售外,我们还提供有关销售价格,代理商位置,特殊日子(如假期)和整个行业销售量的信息。
from pytorch_forecasting.data.examples import get_stallion_datadata = get_stallion_data() # load data as pandas dataframeThe dataset is already in the correct format but misses some important features. Most importantly, we need to add a time index that is incremented by one for each time step. Further, it is beneficial to add date features, which in this case means extracting the month from the date record.
数据集已经采用正确的格式,但是缺少一些重要功能。 最重要的是,我们需要添加一个时间索引,每个时间步长将其增加一个。 此外,添加日期功能是有益的,在这种情况下,这意味着从日期记录中提取月份。
# add time index
data["time_idx"] = data["date"].dt.year * 12 + data["date"].dt.monthdata["time_idx"] -= data["time_idx"].min()# add additional features
# categories have to be strings
data["month"] = data.date.dt.month.astype(str).astype("category")
data["log_volume"] = np.log(data.volume + 1e-8)
data["avg_volume_by_sku"] = (
    data
    .groupby(["time_idx", "sku"], observed=True)
    .volume.transform("mean"))
data["avg_volume_by_agency"] = (
    data
    .groupby(["time_idx", "agency"], observed=True)
    .volume.transform("mean")
)# we want to encode special days as one variable and
# thus need to first reverse one-hot encoding
special_days = [
    "easter_day", "good_friday", "new_year", "christmas",
    "labor_day", "independence_day", "revolution_day_memorial",
    "regional_games", "fifa_u_17_world_cup", "football_gold_cup",
    "beer_capital", "music_fest"
]data[special_days] = (
    data[special_days]
    .apply(lambda x: x.map({0: "-", 1: x.name}))
    .astype("category")
)# show sample data
data.sample(10, random_state=521)The next step is to convert the dataframe into a PyTorch Forecasting dataset. Apart from telling the dataset which features are categorical vs continuous and which are static vs varying in time, we also have to decide how we normalise the data. Here, we standard scale each time series separately and indicate that values are always positive.
下一步是将数据框转换为PyTorch预测数据集。 除了告诉数据集哪些特征是分类特征还是连续特征,哪些特征是静态特征还是随时间变化之外,我们还必须决定如何标准化数据。 在此,我们分别对每个时间序列进行标准缩放,并指示值始终为正。
We also choose to use the last six months as a validation set.
我们还选择将过去六个月用作验证集。
from pytorch_forecasting.data import (
    TimeSeriesDataSet,
    GroupNormalizer
)max_prediction_length = 6  # forecast 6 months
max_encoder_length = 24  # use 24 months of history
training_cutoff = data["time_idx"].max() - max_prediction_lengthtraining = TimeSeriesDataSet(
    data[lambda x: x.time_idx <= training_cutoff],
    time_idx="time_idx",
    target="volume",
    group_ids=["agency", "sku"],
    min_encoder_length=0,  # allow predictions without history
    max_encoder_length=max_encoder_length,
    min_prediction_length=1,
    max_prediction_length=max_prediction_length,
    static_categoricals=["agency", "sku"],
    static_reals=[
        "avg_population_2017",
        "avg_yearly_household_income_2017"
    ],
    time_varying_known_categoricals=["special_days", "month"],
    # group of categorical variables can be treated as
    # one variable
    variable_groups={"special_days": special_days},
    time_varying_known_reals=[
        "time_idx",
        "price_regular",
        "discount_in_percent"
    ],
    time_varying_unknown_categoricals=[],
    time_varying_unknown_reals=[
        "volume",
        "log_volume",
        "industry_volume",
        "soda_volume",
        "avg_max_temp",
        "avg_volume_by_agency",
        "avg_volume_by_sku",
    ],
    target_normalizer=GroupNormalizer(
        groups=["agency", "sku"], coerce_positive=1.0
    ),  # use softplus with beta=1.0 and normalize by group
    add_relative_time_idx=True,  # add as feature
    add_target_scales=True,  # add as feature
    add_encoder_length=True,  # add as feature
)# create validation set (predict=True) which means to predict the
# last max_prediction_length points in time for each series
validation = TimeSeriesDataSet.from_dataset(
    training, data, predict=True, stop_randomization=True
)# create dataloaders for model
batch_size = 128
train_dataloader = training.to_dataloader(
    train=True, batch_size=batch_size, num_workers=0
)
val_dataloader = validation.to_dataloader(
    train=False, batch_size=batch_size * 10, num_workers=0
)
训练临时融合变压器 (Training the Temporal Fusion Transformer)
It is now time to create our model. We train the model with PyTorch Lightning. Prior to training, you can identify the optimal learning rate with its learning rate finder (see the documentation for an example).
现在是时候创建我们的模型了。 我们使用PyTorch Lightning训练模型。 在培训之前,您可以使用其学习率查找器确定最佳学习率(有关示例,请参阅文档)。
import pytorch_lightning as pl
from pytorch_lightning.callbacks import (
    EarlyStopping,
    LearningRateLogger
)
from pytorch_lightning.loggers import TensorBoardLogger
from pytorch_forecasting.metrics import QuantileLoss
from pytorch_forecasting.models import TemporalFusionTransformer# stop training, when loss metric does not improve on validation set
early_stop_callback = EarlyStopping(
    monitor="val_loss",
    min_delta=1e-4,
    patience=10,
    verbose=False,
    mode="min"
)
lr_logger = LearningRateLogger()  # log the learning rate
logger = TensorBoardLogger("lightning_logs")  # log to tensorboard# create trainer
trainer = pl.Trainer(
    max_epochs=30,
    gpus=0,  # train on CPU, use gpus = [0] to run on GPU
    gradient_clip_val=0.1,
    early_stop_callback=early_stop_callback,
    limit_train_batches=30,  # running validation every 30 batches
    # fast_dev_run=True,  # comment in to quickly check for bugs
    callbacks=[lr_logger],
    logger=logger,
)# initialise model
tft = TemporalFusionTransformer.from_dataset(
    training,
    learning_rate=0.03,
    hidden_size=16,  # biggest influence network size
    attention_head_size=1,
    dropout=0.1,
    hidden_continuous_size=8,
    output_size=7,  # QuantileLoss has 7 quantiles by default
    loss=QuantileLoss(),
    log_interval=10,  # log example every 10 batches
    reduce_on_plateau_patience=4,  # reduce learning automatically
)
tft.size() # 29.6k parameters in model# fit network
trainer.fit(
    tft,
    train_dataloader=train_dataloader,
    val_dataloaders=val_dataloader
)
Training takes about three minutes on my Macbook but for larger networks and datasets, it can take hours. During training, we can monitor the tensorboard which can be spun up with tensorboard --logdir=lightning_logs. For example, we can monitor examples predictions on the training and validation set. As you can see from the figure below, forecasts look rather accurate. If you wonder, the grey lines denote the amount of attention the model pays to different points in time when making the prediction. This is a special feature of the Temporal Fusion Transformer.
在Macbook上进行培训大约需要3分钟,但对于较大的网络和数据集,则可能需要数小时。 在培训过程中,我们可以监测tensorboard可与纺达tensorboard --logdir=lightning_logs 。 例如,我们可以监视训练和验证集上的示例预测。 从下图可以看到,预测看起来相当准确。 如果您想知道,灰线表示模型在进行预测时对不同时间点的关注程度。 这是时间融合变压器的一项特殊功能。
评估训练好的模型(Evaluating the trained model)
After training, we can evaluate the metrics on the validation dataset and a couple of examples to see how well the model is doing. Given that we work with only 21 000 samples the results are very reassuring and can compete with results by a gradient booster.
训练后,我们可以评估验证数据集上的指标和几个示例,以查看模型的运行情况。 鉴于我们仅处理21 000个样本,结果非常令人放心,并且可以通过梯度增强器与结果竞争。
from pytorch_forecasting.metrics import MAE# load the best model according to the validation loss (given that
# we use early stopping, this is not necessarily the last epoch)
best_model_path = trainer.checkpoint_callback.best_model_path
best_tft = TemporalFusionTransformer.load_from_checkpoint(best_model_path)# calculate mean absolute error on validation set
actuals = torch.cat([y for x, y in iter(val_dataloader)])
predictions = best_tft.predict(val_dataloader)MAE(predictions, actuals)
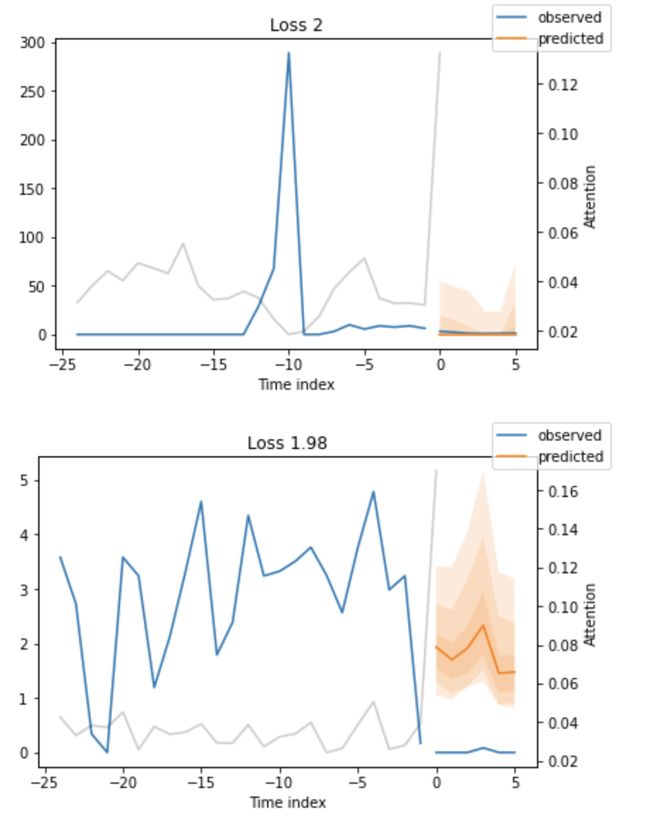
Looking at the worst performers in terms of sMAPE gives us an idea where the model has issues with forecasting reliably. These examples can provide important pointers about how to improve the model. This kind of actuals vs predictions plots are available to all models.
从sMAPE的角度来看效果最差的公司,可以使我们了解模型在可靠预测方面存在的问题。 这些示例可以提供有关如何改进模型的重要指示。 这种实际值与预测值图可用于所有模型。
from pytorch_forecasting.metrics import SMAPE# calculate metric by which to display
predictions, x = best_tft.predict(val_dataloader)
mean_losses = SMAPE(reduction="none")(predictions, actuals).mean(1)
indices = mean_losses.argsort(descending=True)  # sort lossesraw_predictions, x = best_tft.predict(val_dataloader, mode="raw, return_x=True)# show only two examples for demonstration purposes
for idx in range(2):
    best_tft.plot_prediction(
        x,
        raw_predictions,
        idx=indices[idx],
        add_loss_to_title=SMAPE()
)Similarly, we could also visualise random examples from our model. Another feature of PyTorch Forecasting is interpretation of trained models. For example, all models allow us to readily calculate partial dependence plots. However, for brevity we will show here some inbuilt interpretation capabilities of the Temporal Fusion Transformer. It enables the variable importances by design of the neural network.
同样,我们还可以可视化模型中的随机示例。 PyTorch预测的另一个功能是训练模型的解释。 例如,所有模型都使我们能够轻松计算偏倚图。 但是,为简便起见,我们将在此处展示Temporal Fusion Transformer的一些内置解释功能。 通过神经网络的设计,它可以实现可变的重要性。
interpretation = best_tft.interpret_output(
    raw_predictions, reduction="sum"
)best_tft.plot_interpretation(interpretation)
Unsurprisingly, the past observed volume features as the top variable in the encoder and price related variables are among the top predictors in the decoder. Maybe more interesting is that the agency is ranked only fifth amongst the static variables. However, given that the second and third variable are related to location, we could expect agency to rank far higher if those two were not included in the model.
毫不奇怪,过去观察到的交易量特征是编码器中的顶级变量和价格相关变量,是解码器中的顶级预测变量。 也许更有趣的是,该机构在静态变量中仅排名第五。 但是,鉴于第二个和第三个变量与位置有关,如果模型中未包含这两个变量,我们可以期望代理商的排名更高。
概要 (Summary)
It is very easy to train a model and get insights into its inner workings with PyTorch Forecasting. As a practitioner, you can employ the package to train and interpret state-of-the-art models out-of-the-box. With PyTorch Lightning integration training and prediction is scalable. As a researcher, you can leverage the package to get automatic tracking and introspection capabilities for your architecture and apply it seamlessly to multiple datasets.
使用PyTorch预测非常容易训练模型并深入了解其内部工作原理。 作为一名从业者,您可以使用该软件包来立即训练和解释最新模型。 借助PyTorch Lightning,集成培训和预测是可扩展的。 作为研究人员,您可以利用该软件包为您的体系结构获得自动跟踪和自省功能,并将其无缝地应用于多个数据集。
代码,文档以及贡献方式 (Code, documentation and how to contribute)
The code for this tutorial can be found in this notebook: https://github.com/jdb78/pytorch-forecasting/blob/master/docs/source/tutorials/stallion.ipynb
可以在以下笔记本中找到本教程的代码: https : //github.com/jdb78/pytorch-forecasting/blob/master/docs/source/tutorials/stallion.ipynb
Install PyTorch Forecasting with
使用安装PyTorch预测
pip install pytorch-forecastingor
要么
conda install -c conda-forge pytorch-forecastingGitHub repository: https://github.com/jdb78/pytorch-forecasting
GitHub存储库: https : //github.com/jdb78/pytorch-forecasting
Documentation (including tutorials): https://pytorch-forecasting.readthedocs.io
文档(包括教程): https : //pytorch-forecasting.readthedocs.io
The package is open source under the MIT Licence which permits commercial use. Contributions are very welcome! Please read the contribution guidelines upfront to ensure your contribution is merged swiftly.
该软件包是根据MIT许可开放的,允许商业使用。 欢迎捐款! 请先阅读贡献准则,以确保您的贡献被Swift合并。
相关工作 (Related Work)
Gluon-TS by Amazon aims to provide a similar interface but has two distinct disadvantages compared to PyTorch Forecasting. First, the package’s backend is MXNet, a deep learning framework trailing in popularity PyTorch and Tensorflow. Second, while it is a powerful framework, it can be difficult to master and modify given its complex object inheritance structure and tight coupling of components.
亚马逊的Gluon -TS旨在提供类似的界面,但与PyTorch预测相比有两个明显的缺点。 首先,该软件包的后端是MXNet ,这是一种流行于PyTorch和Tensorflow的深度学习框架。 其次,尽管它是一个功能强大的框架,但鉴于其复杂的对象继承结构和组件的紧密耦合,可能难以掌握和修改。
翻译自: https://towardsdatascience.com/introducing-pytorch-forecasting-64de99b9ef46
pytorch 预测


