python 百度地图可视化_Python地理地图可视化:folium把百度地图中国城市中心经纬度解析出来并在地图上展示...
python地理地图可视化:folium把百度地图各个城市经纬度解析出来并在地图上展示(三)
import json
import webbrowser as wb
import folium
NAME = 'n'
GEO = 'g'
CITY = 'city'
CITIES = 'cities'
PROVINCE = 'province'
PROVINCES = 'provinces'
LAT = 'latitude'
LNG = 'longitude'
# 把百度地图文件装入字符串
def load_origin_bd_file_to_str():
f = open(file='BaiduMap_cityCenter.txt', mode='r', encoding='gbk')
sss = f.read()
f.close()
return sss
def clean_data(sss):
target = ('municipalities:', 'provinces:', 'cities:', 'n:', 'g:', 'other:')
for old in target:
news = '\"' + old.replace(':', '') + '\":'
newsss = sss.replace(old, news)
sss = newsss
sss = sss.replace(';', '')
return sss
def get_city_lnglat(provin, cities):
lnglats = []
for c in cities:
city_name = c[NAME]
city_geo = c[GEO]
lnglat = city_geo.split(',')
lng = lnglat[0]
lat = lnglat[1].split('|')[0]
geo_dict = {}
geo_dict.__setitem__(PROVINCE, provin)
geo_dict.__setitem__(CITY, city_name)
geo_dict.__setitem__(LNG, lng)
geo_dict.__setitem__(LAT, lat)
lnglats.append(geo_dict)
return lnglats
# 根据传入的各个城市经纬度绘制地图点
def draw_map(city_lnglats):
map = folium.Map(location=[35.3, 100.6],
zoom_start=4,
zoom_control=True,
tiles='OpenStreetMap') # 默认OpenStreetMap
for city in city_lnglats:
for c in city:
folium.Marker(
location=[c[LAT], c[LNG]],
opacity=0.8,
popup='{0}\n{1}\n{2}\n{3}'.format(c[CITY], c[LAT], c[LNG], c[PROVINCE]),
icon=folium.Icon(color="red",
# icon='cloud
) # 默认的icon=info_sign,cloud样式也不错
).add_to(map)
map.save('map.html')
wb.open('map.html') # 浏览器打开
if __name__ == '__main__':
origin_s = load_origin_bd_file_to_str()
res = clean_data(origin_s)
json_result = json.loads(res) # 到这里已经是标准的json格式数据
provinces = json_result[PROVINCES]
city_lnglats = []
for pro in provinces:
city_lnglats.append(get_city_lnglat(provin=pro[NAME], cities=pro[CITIES]))
draw_map(city_lnglats)
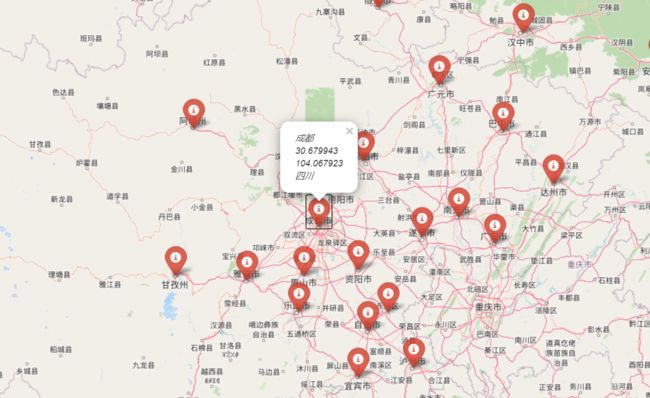
最终输出,如图所示:
本文地址:https://blog.csdn.net/zhangphil/article/details/110270242
如您对本文有疑问或者有任何想说的,请点击进行留言回复,万千网友为您解惑!
