吴恩达机器学习-8-聚类知识
公众号:尤而小屋
作者:Peter
编辑:Peter
吴恩达机器学习-8-聚类
本周的主要知识点是无监督学习中的两个重点:聚类和降维。本文中首先介绍的是聚类中的K均值算法,包含:
- 算法思想
- 图解
K-Means sklearn实现Python实现
无监督学习unsupervised learning
无监督学习简介
聚类和降维是无监督学习方法,在无监督学习中数据是没有标签的。
比如下面的数据中,横纵轴都是 x x x,没有标签(输出 y y y)。在非监督学习中,我们需要将一系列无标签的训练数据,输入到一个算法中,快速这个数据的中找到其内在数据结构。
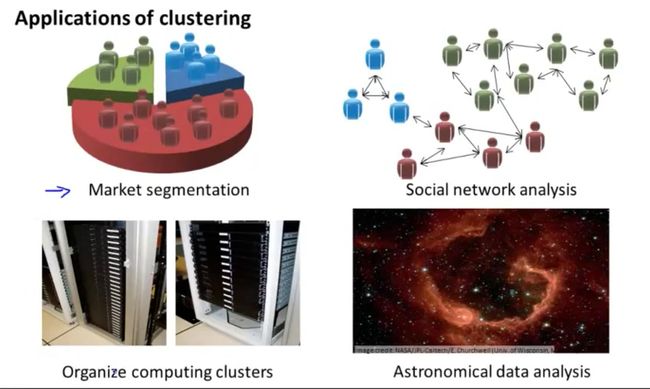
无监督学习应用
- 市场分割
- 社交网络分析
- 组织计算机集群
- 了解星系的形成
聚类
聚类clustering
聚类试图将数据集中的样本划分成若干个通常是不相交的子集,称之为“簇cluster”。聚类可以作为一个单独过程,用于寻找数据内部的分布结构,也能够作为其他学习任务的前驱过程。聚类算法涉及到的两个问题:性能度量和距离计算
性能度量
聚类性能度量也称之为“有效性指标”。希望“物以类聚”。聚类的结果是“簇内相似度高”和“簇间相似度低”。
常用的外部指标是:
- Jaccard 系数
- FM 系数
- Rand 系数
上述3个系数的值都在[0,1]之间,越小越好
常用的内部指标是:
- DB指数
- Dunn指数
DBI的值越小越好,Dunn的值越大越好。
距离计算
x i , x j x_i,x_j xi,xj的 L p L_p Lp的距离定义为:
L p ( x i , x j ) = ( ∑ l = 1 n ∣ x i ( l ) − x j ( l ) ∣ p ) 1 p L_p(x_i,x_j)=(\sum_{l=1}^{n}|x_i^{(l)}-x_j^{(l)}|^p)^\frac{1}{p} Lp(xi,xj)=(l=1∑n∣xi(l)−xj(l)∣p)p1
规定: p ≥ 1 p\geq1 p≥1,常用的距离计算公式有
- 当 p = 2 p=2 p=2时,即为
欧式距离,比较常用,即:
L 2 ( x i , x j ) = ( ∑ l = 1 n ∣ x i ( l ) − x j ( l ) ∣ 2 ) 1 2 L_2(x_i,x_j)=(\sum_{l=1}^{n}|x_i^{(l)}-x_j^{(l)}|^2)^\frac{1}{2} L2(xi,xj)=(l=1∑n∣xi(l)−xj(l)∣2)21
- 当 p = 1 p=1 p=1时,即
曼哈顿距离,即:
L 1 ( x i , x j ) = ∑ l = 1 n ( ∣ x i ( l ) − x j ( l ) ∣ ) L_1(x_i,x_j)=\sum_{l=1}^{n}(|x_i^{(l)}-x_j^{(l)}|) L1(xi,xj)=l=1∑n(∣xi(l)−xj(l)∣)
- 当 p p p趋于无穷,为
切比雪夫距离,它是各个坐标距离的最大值:
L ∞ ( x i , x j ) = m a x l ∣ x i ( l ) − x j ( l ) ∣ L_{\infty}(x_i,x_j)=\mathop {max}\limits_{l}|x_i^{(l)}-x_j^{(l)}| L∞(xi,xj)=lmax∣xi(l)−xj(l)∣
余弦相似度
余弦相似度的公式为:
cos ( θ ) = x T y ∣ x ∣ ⋅ ∣ y ∣ = ∑ i = 1 n x i y i ∑ i = 1 n x i 2 ∑ i = 1 n y i 2 \cos (\theta)=\frac{x^{T} y}{|x| \cdot|y|}=\frac{\sum_{i=1}^{n} x_{i} y_{i}}{\sqrt{\sum_{i=1}^{n} x_{i}^{2}} \sqrt{\sum_{i=1}^{n} y_{i}^{2}}} cos(θ)=∣x∣⋅∣y∣xTy=∑i=1nxi2∑i=1nyi2∑i=1nxiyi
Pearson皮尔逊相关系数
皮尔逊相关系数的公式如下:
ρ X Y = cov ( X , Y ) σ X σ Y = E [ ( X − μ X ) ( Y − μ Y ) ] σ X σ Y = ∑ i = 1 n ( x − μ X ) ( y − μ Y ) ∑ i = 1 n ( x − μ X ) 2 ∑ i = 1 n ( y − μ Y ) 2 \rho_{X Y}=\frac{\operatorname{cov}(X, Y)}{\sigma_{X} \sigma_{Y}}=\frac{E\left[\left(X-\mu_{X}\right)\left(Y-\mu_{Y}\right)\right]}{\sigma_{X} \sigma_{Y}}=\frac{\sum_{i=1}^{n}\left(x-\mu_{X}\right)\left(y-\mu_{Y}\right)}{\sqrt{\sum_{i=1}^{n}\left(x-\mu_{X}\right)^{2}} \sqrt{\sum_{i=1}^{n}\left(y-\mu_{Y}\right)^{2}}} ρXY=σXσYcov(X,Y)=σXσYE[(X−μX)(Y−μY)]=∑i=1n(x−μX)2∑i=1n(y−μY)2∑i=1n(x−μX)(y−μY)
K-均值算法
算法思想
K-均值,也叫做k-means算法,最常见的聚类算法,算法接受一个未标记的数据集,然后将数据聚类成不同的组。 假设将数据分成n个组,方法为:
- 随机选择K个点,称之为“聚类中心”
- 对于数据集中的每个数据,按照距离K个中心点的距离,将其和距离最近的中心点关联起来,与同个中心点关联的所有点聚成一类。
- 计算上面步骤中形成的类的平均值,将该组所关联的中心点移动到平均值的位置
- 重复上面两个步骤,直到中心点不再变化。
图解K-means
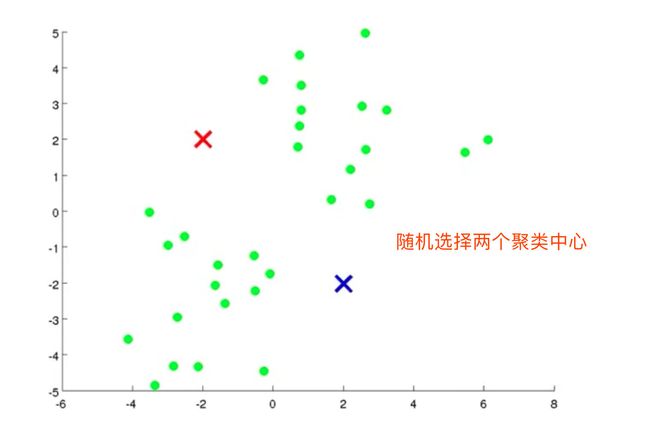
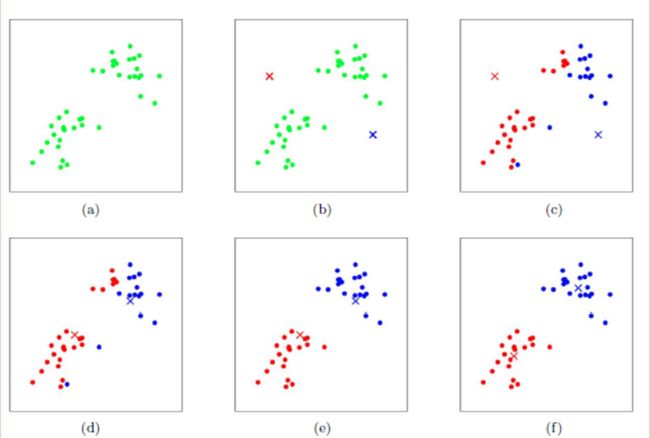
- 给定需要划分的数据,随机确定两个聚类中心点
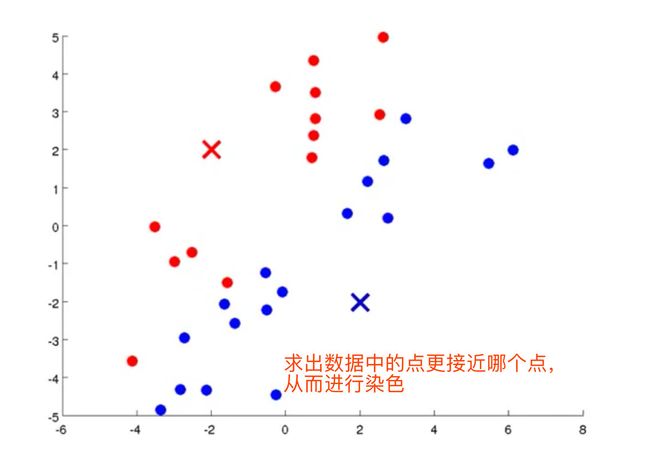
- 计算其他数据和这两个中心点的距离,划入距离小的类中,假设两个类是 C 1 , C 2 C_1,C_2 C1,C2
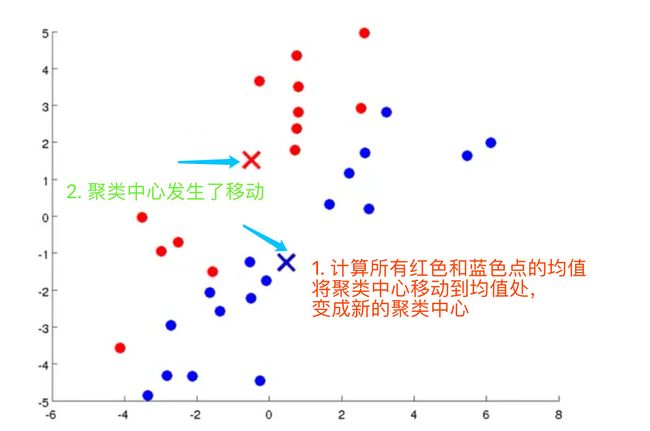
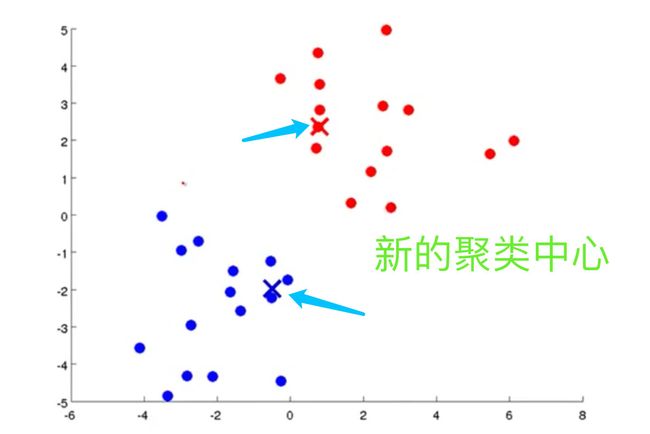
- 确定上述步骤中两个类是 C 1 , C 2 C_1,C_2 C1,C2的均值,这个均值就是新的聚类中心
- 重复:计算数据和这两个中心点的距离,划入距离小的类中,形成新的类;再确定新的聚类中心
- 直至中心点不再变化,结束
全过程
K-means算法过程
吴恩达视频的中的伪代码为
repeat {

  for i= to m
  #  计算每个样例属于的类
  c(i) := index (from 1 to K)  of cluster centroid closest to x(i)

 for k = 1 to K
  # 聚类中心的移动,重新计算该类的质心
 u(k) := average (mean) of points assigned to cluster K
}
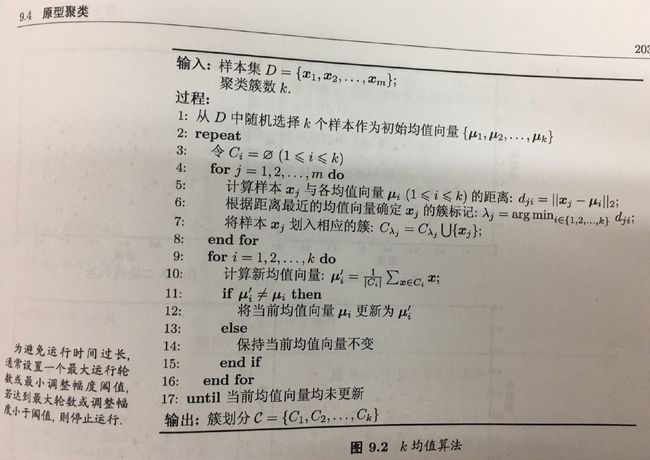
西瓜书中的伪代码
优化目标Optimization Objective
K-均值最小化问题,是要最小化所有的数据点与其所关联的聚类中心点之间的距离之和,因此 K-均值的代价函数(畸变函数Distortion function) :
J ( c ( 1 ) , … , c ( m ) , μ 1 , … , μ K ) = 1 m ∑ i = 1 m ∣ X ( i ) − μ c ( i ) ∣ 2 J\left(c^{(1)}, \ldots, c^{(m)}, \mu_{1}, \ldots, \mu_{K}\right)=\frac{1}{m} \sum_{i=1}^{m}\left|X^{(i)}-\mu_{c^{(i)}}\right|^{2} J(c(1),…,c(m),μ1,…,μK)=m1i=1∑m∣∣∣X(i)−μc(i)∣∣∣2
其中 u c ( i ) {u_{c^{(i)}}} uc(i)代表的是 x ( i ) {x^{(i)}} x(i)最近的聚类中心点。
优化目标就是找出使得代价函数最小的 c ( 1 ) , c ( 2 ) , … , c ( m ) {c^{(1)}},{c^{(2)}},…,{c^{(m)}} c(1),c(2),…,c(m)和 μ 1 , μ 2 , … , μ k {\mu}_1,{\mu}_2,…,{\mu}_k μ1,μ2,…,μk,即:
随机初始化
在运行K-均值算法的之前,首先要随机初始化所有的聚类中心点:
- 选择 K < m K < m K<m,即聚类中心的个数小于训练样本的实例数量
- 随机训练 K K K个训练实例,然后令K个聚类中心分别和这K个训练实例相等
关于K-means的局部最小值问题:
Scikit learn 实现K-means
make_blobs数据集
make_blobs聚类数据生成器make_blobs方法常被用来生成聚类算法的测试数据。它会根据用户指定的特征数量、中心点数量、范围等来生成几类数据。
主要参数
sklearn.datasets.make_blobs(n_samples=100, n_features=2,centers=3, cluster_std=1.0, center_box=(-10.0, 10.0), shuffle=True, random_state=None)[source]
n_samples是待生成的样本的总数n_features是每个样本的特征数centers表示类别数cluster_std表示每个类别的方差
import numpy as np
import matplotlib.pyplot as plt
# 导入 KMeans 模块和数据集
from sklearn.cluster import KMeans
from sklearn.datasets import make_blobs

# 定义画布
plt.figure(figsize=(12,12))

# 定义样本量和随机种子
n_samples = 1500
random_state = 170

# X是测试数据集,y是目标分类标签0,1,2
X, y = make_blobs(n_samples=n_samples, random_state=random_state)

X
array([[-5.19811282e+00,  6.41869316e-01],
       [-5.75229538e+00,  4.18627111e-01],
       [-1.08448984e+01, -7.55352273e+00],
       ...,
       [ 1.36105255e+00, -9.07491863e-01],
       [-3.54141108e-01,  7.12241630e-01],
       [ 1.88577252e+00,  1.41185693e-03]])

y
array([1, 1, 0, ..., 2, 2, 2])

# 预测值的簇类
y_pred = KMeans(n_clusters=2, random_state=random_state).fit_predict(X)
y_pred
array([0, 0, 1, ..., 0, 0, 0], dtype=int32)

X[:,0]  # 所有行的第1列数据
array([ -5.19811282,  -5.75229538, -10.84489837, ...,   1.36105255,
        -0.35414111,   1.88577252])

# 子图1的绘制
plt.subplot(221)
plt.scatter(X[:, 0], X[:, 1], c=y_pred)
plt.title("incorrrect Number of Blods")
transformation = [[0.60834549, -0.63667341],[-0.40887718, 0.85253229]]
X_aniso = np.dot(X, transformation)
y_pred = KMeans(n_clusters=3, random_state=random_state).fit_predict(X_aniso)
# 子图2的绘制
plt.subplot(222)
plt.scatter(X_aniso[:, 0], X_aniso[:, 1], c=y_pred)
plt.title("Anisotropicly Distributed Blobs")
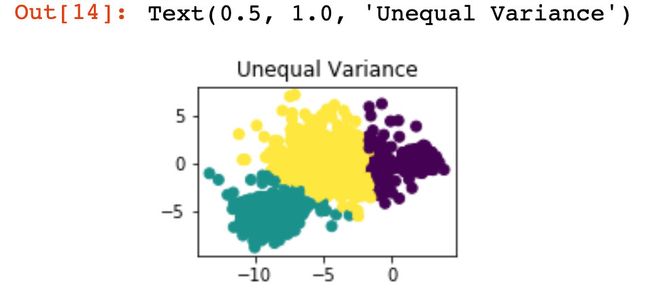
X_varied, y_varied = make_blobs(n_samples=n_samples,
                               cluster_std=[1.0,2.5,0.5],random_state=random_state)
y_pred = KMeans(n_clusters=3, random_state=random_state).fit_predict(X_varied)
plt.subplot(223)
plt.scatter(X_varied[:, 0], X_varied[:, 1], c=y_pred)
plt.title("Unequal Variance")
X_filtered = np.vstack((X[y == 0][:500],
                      X[y == 1][:100],
                      X[y == 2][:10]))
y_pred = KMeans(n_clusters=3,random_state=random_state).fit_predict(X_filtered)
plt.subplot(224)
plt.scatter(X_filtered[:, 0],
           X_filtered[:, 1],
           c=y_pred)
plt.title("Unevenly Sized Blobs")
plt.show()
python实现K-means算法
这是在网上找到的一个基于Python找到的`K-means实验算法,学习使用

