计算机视觉,基于skimage对图像阈值分割的学习
@Author:Runsen
文章目录
-
- 图像分割
- skimage的实现
- OSTU图像分割方法
-
- 基本原理
图像分割
阈值处理是图像分割的一种,在其中更改图像的像素以使图像更易于分析。在阈值化中,将图像从彩色或灰度转换为 二进制图像,即简单的黑白图像
skimage的实现
Scikit-image提供的阈值算法的功能
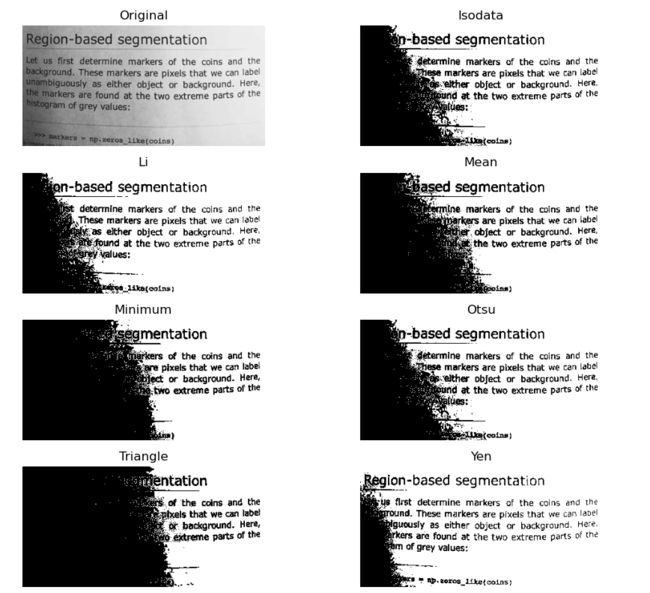
下面代码是尝试多种threshold的结果。
import matplotlib.pyplot as plt

from skimage import data
from skimage.filters import try_all_threshold

img = data.page()

fig, ax = try_all_threshold(img, figsize=(10, 8), verbose=False)
plt.show()
下面示例使用像素强度的平均值。作为阈值,有时用作猜测值。
import matplotlib.pyplot as plt

from skimage import data

from skimage.filters import threshold_mean

image = data.camera()
thresh = threshold_mean(image)
binary = image > thresh

fig, axes = plt.subplots(ncols=2, figsize=(8, 3))
ax = axes.ravel()

ax[0].imshow(image, cmap=plt.cm.gray)
ax[0].set_title('Original image')

ax[1].imshow(binary, cmap=plt.cm.gray)
ax[1].set_title('Result')

for a in ax:
    a.axis('off')

plt.show()

下面绘制图像阈值分割的双峰直方图
对于具有双峰直方图的图片,可以使用更具体的算法。例如,最小算法获取图像的直方图并对其进行重复平滑,直到直方图中只有两个峰为止。
import matplotlib.pyplot as plt

from skimage import data

from skimage.filters import threshold_minimum

image = data.camera()

thresh_min = threshold_minimum(image)
binary_min = image > thresh_min

fig, ax = plt.subplots(2, 2, figsize=(10, 10))

ax[0, 0].imshow(image, cmap=plt.cm.gray)
ax[0, 0].set_title('Original')

ax[0, 1].hist(image.ravel(), bins=256)
ax[0, 1].set_title('Histogram')

ax[1, 0].imshow(binary_min, cmap=plt.cm.gray)
ax[1, 0].set_title('Thresholded (min)')

ax[1, 1].hist(image.ravel(), bins=256)
ax[1, 1].axvline(thresh_min, color='r')

for a in ax[:, 0]:
    a.axis('off')
plt.show()

OSTU图像分割方法
Otsu(OTSU)是确定性的图像二值化分割阈值算法,也称为最大类间差异方法。有时称为Otsu算法,由Otsu在1979年提出,被认为是图像分割中阈值选择的最佳算法。计算简单,与图像亮度和对比度无关,因此,它已被广泛用于数字图像处理中。它是由图像灰度特性,将图像分为具有前景的背景两部分。
优点:计算简单快速,不受图像亮度和对比度的影响。
缺点:对图像噪声敏感;只能针对单一目标分割;当目标和背景大小比例悬殊、类间方差函数可能呈现双峰或者多峰,这个时候效果不好。
基本原理
由于一个图像的不同区域的差别较大,我们可以用这个原理来设计算法。图像不同区域的差别可以用方差来刻画。
假设有一个阈值TH能把图像分割成两个区域,均值分别为m1,m2。像素被分到两个区域的概率位p1,p2,则整个图像的均值可以被表示为:
m = p 1 m 1 + p 2 m 2 m = p_1m_1+p_2m_2 m=p1m1+p2m2
类间方差可以表示为:
σ 2 = p 1 ( m 1 − m ) 2 + p 2 ( m 2 − m ) 2 \sigma^2=p_1(m_1-m)^2+p_2(m_2-m)^2 σ2=p1(m1−m)2+p2(m2−m)2
化简得:
σ 2 = p 1 p 2 ( m 1 − m 2 ) 2 \sigma^2=p_1p_2(m_1-m_2)^2 σ2=p1p2(m1−m2)2
使上面这个式子最大化的TH即要求的阈值。
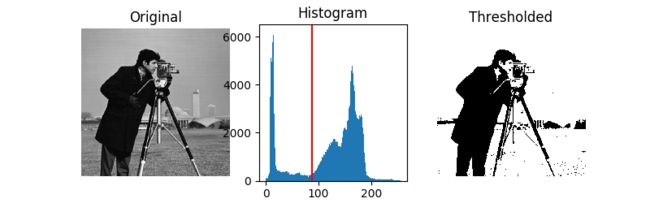
在skimage实现Otsu的方法,是通过最大化由阈值分隔的两类像素之间的方差来计算“最佳”阈值(在下面的直方图中用红线标记)。等效地,该阈值使组内差异最小化。
import matplotlib.pyplot as plt

from skimage import data

from skimage.filters import threshold_otsu

image = data.camera()
thresh = threshold_otsu(image)
binary = image > thresh

fig, axes = plt.subplots(ncols=3, figsize=(8, 2.5))
ax = axes.ravel()
ax[0] = plt.subplot(1, 3, 1, adjustable='box')
ax[1] = plt.subplot(1, 3, 2)
ax[2] = plt.subplot(1, 3, 3, sharex=ax[0], sharey=ax[0], adjustable='box')

ax[0].imshow(image, cmap=plt.cm.gray)
ax[0].set_title('Original')
ax[0].axis('off')

ax[1].hist(image.ravel(), bins=256)
ax[1].set_title('Histogram')
ax[1].axvline(thresh, color='r')

ax[2].imshow(binary, cmap=plt.cm.gray)
ax[2].set_title('Thresholded')
ax[2].axis('off')

plt.show()
参考:https://scikit-image.org/docs/0.13.x/auto_examples/xx_applications/plot_thresholding.html