- Winform工具箱、属性、事件
今天开心嘛_
Winformc#winform
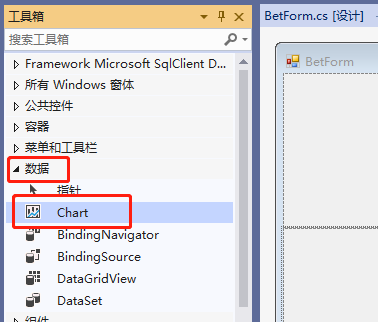
工具箱Button------按钮:用户可以点击的按钮控件。CheckBox------复选框:允许用户选择或取消选择选项的复选框。CheckedListBox:结合了ListBox和CheckBox的功能,允许多项选择。ColorDialog------颜色选择对话框:用户可以从中选择颜色。ComboBox-----下拉列表:下拉列表,用户可以从中选择一个选项。ContextMenuStrip:
- 使用 CefSharp 在 C# WinForms 应用程序中嵌入 Chromium 浏览器:全面指南
墨夶
C#学习资料2c#开发语言
亲爱的小伙伴们,今天我们要深入探讨如何在C#WinForms应用程序中使用CefSharp嵌入Chromium浏览器。CefSharp是一个开源的.NET绑定库,允许你在WindowsForms或WPF应用程序中轻松集成Chromium浏览器引擎。这使得你可以构建功能强大的桌面应用程序,拥有现代化的Web技术支持。本文将详细介绍如何在C#WinForms项目中安装和配置CefSharp,并通过一些
- 【Winform】深入理解C#中的异常处理:以WinForms应用程序为例
JosieBook
#WinForm案例c#winform
文章目录前言一、示例背景二、异常处理分析三、异常处理的重要性结论前言在编程过程中,异常处理是一项至关重要的技能。它能够帮助我们优雅地处理运行时错误,从而增强程序的健壮性和用户体验。今天,我们将通过一个简单的WinForms应用程序示例,深入探讨C#中的异常处理机制。一、示例背景假设我们正在开发一个简单的Windows窗体应用程序(WinForms),其中包含一个名为Form1的窗体。在Form1加
- WinForm开发核心基础之事件驱动设计
dotnet研习社
C#开发基础.netdotnet
引言在Windows窗体应用程序(WinForm)开发中,事件驱动设计是构建用户交互式应用的核心机制。无论是按钮点击、键盘输入还是窗口重绘,所有用户与程序的交互行为本质上都是通过事件来驱动执行的。理解事件驱动模型不仅能够帮助我们构建响应式的界面,更是深入GUI编程的关键一步。本文将深入解析WinForm中事件驱动设计的原理、实现方式及最佳实践。一、什么是事件驱动设计?1.1传统程序与事件驱动程序的
- ArcGIS二次开发之WPF中控件的使用
ShirmyMao
ArcGIS二次开发wpfc#arcgis
WPF中ArcGIS控件的使用WPF中插入ArcGIS控件Winform控件上嵌套使用WPF控件WPF中插入ArcGIS控件在WPF中引用ArcGIS的控件需要使用WindowsFromsHost,具体用法如下:添加引用:WindowsFormsIntegration和system.windows.formWpf.xaml中后台代码中:publicAxMapControlMapControl=ne
- c#编程:基于C#+Access的学生信息管理系统 课程设计报告撰写提纲
gu20
C#c#课程设计开发语言数据库开发
1.摘要简述系统目标、技术选型(C#+Access)、核心功能及数据库设计亮点。关键词:学生信息管理系统;数据库原理;C#;Access;事务处理。2.引言背景与意义:信息化管理需求、数据库技术在教育领域的应用价值。设计目标:实现学生信息的高效管理,体现数据库规范化、安全性等原理。技术路线:C#(WinForm)、Access数据库、ADO.NET数据访问技术。3.需求分析3.1功能需求:1.学生
- C# Winform DragDrop事件不触发问题
Yuanymoon
C#WinformClient
背景:研究拖放文件到Winform程序时发现在控件上设了允许拖放的属性(AllowDrop=true;)后,依然不能触发DragDrop事件的。现象:DragEnter能够正常触发。DragDrop无法触发。原因:DragEnter对于控件的意义主要在于识别拖放进来的对象是何种对象,需要在这里验证并判断是否需要接受及以何种方式接受拖放进来的对象。DragEnter通过参数(DragEventArg
- 一文熟练使用C#中的异步(async)编程实现WinForm UI界面进度条更新
零壹电子
uic#
目录一、创作背景二、WinForm程序遍历数据举例1、UI界面介绍2、对应的代码3、实际效果演示一、创作背景芯片测试过程中,常常需要在for循环中进行各种测试条件的遍历,需要在UI界面上查看当前运行到什么条件和总的进度,想尝试直接在阻塞的线程中进行WinFormUI界面的进度更新是不现实的。C#中有同步、异步和多线程几种方式能实现上述功能,本文采用异步方式实现UI界面的进度条实时更新。二、WinF
- winform中的mousemove事件,click与mouseup,mousedown事件的关系,
qq_43361844
button的事件处理c#winform
首先click是mousedown和mouseup的结合,只有两个事件都发生了才会产生click事件,我在做button移动的时候,遇到了移动事件mousemove过后就会发生click事件,但是我只是想移动button,只发生mousemove事件代码如下:usingSystem;usingSystem.Collections.Generic;usingSystem.ComponentModel
- 【C#】的WPF或是WinForm实现Ctrl+ 的快捷键组合使用
wangnaisheng
C#c#
在C#中,无论是WPF还是WinForms应用程序,处理快捷键(例如Ctrl+)通常涉及检测键盘输入并执行相应的命令或方法。WPF实现在WPF中,可以通过设置一个控件的InputBindings属性来绑定快捷键。在这个例子中,YourCommand应该是你在ViewModel中定义的一个ICommand,它将在用户按下Ctrl+时被执行。如果想要直接在后台代码中处理这个事件,可以使用Preview
- C#理论-新手学习.NET 8 指南:WPF 和 WinForms 怎么选
熊熊VR -每一行代码都有一段故事
c#技术文章c#基础知识c#学习.netwpf
引言随着.NET8的发布,许多新手开发者面临着一个重要的选择:应该学习WPF(WindowsPresentationFoundation)还是WinForms(WindowsForms)?这两种技术各有优缺点,适用于不同的场景。本文将深入分析WPF和WinForms的特性,帮助新手开发者在学习.NET8时做出明智的选择。WPF和WinForms简介什么是WPF?WPF是Microsoft推出的基于
- 【流程图】在 .NET (WPF 或 WinForms) 中实现流程图中的连线算法
de之梦-御风
.netWPF流程图流程图.netwpf
在.NET(WPF或WinForms)中实现流程图中的连线算法,通常涉及图形绘制和路径计算。常见的连线方式包括直线、折线和贝塞尔曲线。以下是几种方法的介绍和示例代码。1.直线连接(最简单)适用场景:两个节点之间没有障碍物时,最简单的方式。计算方式:直接用起点(x1,y1)和终点(x2,y2)画一条直线。WPF示例代码2.折线连接(适用于流程图)适用场景:流程图、状态机这类需要避开障碍的情况。计算方
- 修改winform textbox height 后界面并没有修改的问题
小张码农
开发语言
修改完height后需要修改对应的Locationtextbox1.Size=newSystem.Drawing.Size(200,rtbMSG.Height);textbox1.Location=newPoint(0,height);
- 关于Winform(.net6)使用efcore连接Oracle超时
灰熊怪
c#.net
记录一下开发时遇到的小问题usingOracle.ManagedDataAccess.Client;引用这个是没错的但是NuGet包要引用.Core结尾这个包
- C#对FTP服务器操作类
want fly
c#上位机学习服务器c#java
要在WinForms应用程序中像访问本地文件夹一样访问FTP服务器上的文件夹,可以通过以下步骤实现:1.使用FTP访问远程服务器你需要使用FtpWebRequest类来访问FTP服务器,并进行文件/文件夹的列表、上传和下载操作。2.显示目录结构可以使用TreeView控件来显示FTP服务器的目录结构,并使用ListView控件来显示文件。通过与FTP服务器的连接,可以列出文件夹和文件,就像浏览本地
- C# Winform--SerialPort串口通讯(ASCII码发送)
@Crazy Snail
随笔c#开发语言WinformSerialport通信
1.代码部分privateSerialPortserialPort=newSerialPort();privatevoidbutton1_Click(objectsender,EventArgse){serialPort.BaudRate=9600;serialPort.Parity=Parity.None;serialPort.StopBits=StopBits.One;serialPort.D
- cefsharp131升级132测试(WinForms.NETCore)
久爱物联网
久爱CefsharpCsharp久爱学习cefsharpcefsharp132.3WinForm.NetCorecef132
一、升级(Nuget)版本说明(readme):最低.NETCore3.1(NET5.0+)+VisualC++2019Redist二、试运行、兼容性测试三、后记说明支持H264版本推荐版本63,79,84,88,100,111,125(支持h264和pdf预览)其他H264版本109,124,126,128,131.0.x(支持h264,支持pdf预览有异常)私聊jiuailtd留言CefSha
- C# Winform用户管理系统:3层架构与加密实践
含老司开挖掘机
本文还有配套的精品资源,点击获取简介:本项目演示了如何使用C#语言和SQL数据库通过Winform界面设计实现一个具备用户登录注册功能的应用程序。该程序采用3层架构设计,包括数据访问层(DAL)、业务逻辑层(BLL)以及数据库层(DB),确保了系统的高内聚低耦合。为增强安全性,程序对用户密码进行了加密处理,采用了安全的加密算法。通过这一系统,用户可以安全地进行登录注册操作,而开发者可以掌握如何构建
- 基于C# winform实现简单流程图绘制工具
萌萌哒240
C#c#流程图开发语言
实现效果:开发环境:vs2019打开sln项目点击运行即可。实现功能有:保存绘制流程图加载绘制过的流程图文件导出图片画圆画矩形框画线段画曲线画菱形画数据库1.项目架构项目采用了典型的MVC模式:Model:FlowChart.Models命名空间View:FlowChart.Views.Default和FlowChart.Views.Grey两种视图实现Controller:FlowChart.C
- 虚表 —— 图标高级移动动画效果
卢光庆
aardioaardio
快来感受图标高级移动动画带来的震撼效果吧演示效果一:演示效果二:演示代码一:importwin.ui;importgodking.vlistEx;/*DSG{{*/varwinform=win.form(text="图标矩阵";right=600;bottom=400;bgcolor=16777215)winform.add(grid={cls="vlistEx";left=10;top=10;r
- Devexpress WinForm YAxis 如何设置Min,Max与实际显示一致
norsd
C#DevexpressDevexpress
xy.AxisY.VisualRange.Auto=false;xy.AxisY.WholeRange.Auto=false;xy.AxisY.VisualRange.AutoSideMargins=false;xy.AxisY.WholeRange.AutoSideMargins=false;xy.AxisY.WholeRange.SetMinMaxValues(display_min,disp
- aspose 换行写_利用Aspose.Word控件实现Word文档的操作
weixin_39974223
aspose换行写
Aspose系列的控件,功能都挺好,之前一直在我的Winform开发框架中用Aspose.Cell来做报表输出,可以实现多样化的报表设计及输出,由于一般输出的内容比较正规化或者多数是表格居多,所以一般使用Aspose.Cell来实现我想要的各种Excel报表输出。虽然一直也知道Aspose.Word是用来生成Word文档的,而且深信其也是一个很强大的控件,但一直没用用到,所以就不是很熟悉。偶然一次
- 代替Winform、Win32控件的一些界面框架Electron,QT等
专注VB编程开发20年
前端c++ui界面框架
以下是一些可以代替Winform、Win32控件,在VC++、VBA等EXE程序上用来做控件元素、表格数据绑定、窗口显示的WEBUI框架和工具:1.Electron特点:Electron是一个使用JavaScript、HTML和CSS构建跨平台桌面应用程序的框架。它允许开发者使用Web技术来创建桌面应用,具有良好的跨平台兼容性。适用场景:适用于需要快速开发跨平台桌面应用的场景,尤其是对UI灵活性和
- 如何在运行时切换WinForm程序使用的语言?
biyusr
.netc#
使用.net开发一个多语言支持的WinForm程序是很容易的,特别是在C#2.0中为资源文件提供了ResXFileCodeGenerator自定义工具就更方便了。然而好像不是很容易在运行时选择界面显示使用的语言(不知道是不是其实很简单,只是我不知道:)下面的东东就当是抛砖引玉吧)。就像常用的BT下载软件BitComet,可以方便得在菜单中设置界面显示使用不同的语言。在.net程序中,多语言的支持是
- 都是基于.NET平台,WPF能取代Winform吗?
zls365365
java编程语言python人工智能移动开发
学Winform还是WPF?很多winform的学者时常在我的技术群咨询要不要学习WPF?我一贯的观点是必须学啊!如果是搞工控做cs软件开发,WPF自然是首选。WPF优势在哪里?①前后端分离:WPF是数据驱动的而非Winform的事件驱动,可以通过属性bing的方式实现界面的数据更新,这样就可以很好地实现前后台的分离,在大型的开发项目中,后端开发人员只用编写VM相关的逻辑,界面视图部分可以去交给美
- WinForm 双屏幕应用开发:原理、实现与优化
zls365365
在当今的软件开发领域,多屏幕显示技术的应用越来越广泛。对于WinForm应用程序来说,能够支持双屏幕显示不仅可以提升用户体验,还能满足一些特定场景下的业务需求,比如在演示、监控或者多任务处理等场景中。本文将带你深入了解WinForm双屏幕应用开发的原理、实现方法以及优化技巧,通过通俗易懂的代码实例,让你快速掌握这一实用技能。一、双屏幕应用开发的原理在Windows操作系统中,多屏幕显示是通过扩展桌
- C#设置winform窗体自动适应不同分辨率的电脑
南华
c#电脑开发语言
C#设置winform窗体自动适应不同分辨率的电脑文章已被社区收录加入社区问题背景:用winform开发了一个上位机软件,本机的台式开发电脑是宽屏的,上位机软件的显示效果良好,而在笔记本电脑上使用上位机软件时,出现了界面超出屏幕,部分功能或内容无法显示完整的现象。探索之后,发现了一个规律:笔记本电脑的屏幕分辨率最大为1366×768,此时用vs2015中C#设计的winform窗体的size属性最
- C# 关于进程回收管理的一款工具设计与分享
初九之潜龙勿用
c#开发语言
目录设计初衷开发运行环境CraneofficeProcessGC运行主界面管理任务与策略其它设置移动存储设备管理核心代码-计时器监控小结设计初衷在使用COM模式操作OFFICE组件的开发过程中,当操作完相关文档后,在某些情况下仍然无法释放掉Word或EXCEL等应用进程,因此根据进程活动情况或时间点范围开发了一个强制杀掉指定进程名称的WinForm程序,做为一种辅助工具运行在云服务器上,命名为Cr
- 【C#】将信息输出到 Visual Studio 的输出窗口的几个方式
我不是程序猿儿
C#c#visualstudio开发语言
在WinForms项目中,可以通过使用System.Diagnostics.Debug或System.Diagnostics.Trace类将信息输出到VisualStudio的输出窗口。这两者之间的主要区别在于,Debug仅在调试模式下有效,而Trace则在调试模式和发布模式下都有效。方法1:使用System.Diagnostics.DebugDebug类允许你在调试时输出信息到VisualStu
- 引发类型为“System.Windows.Forms.AxHost+InvalidActiveXStateException”的异常 解决办法 .
旅行皮箱
asp.netwinformcam
这几天在做一个winForm功能时,因为引用了第三方的OCX控件,一般来说一个对象只要实例化就行了但是不知为什么引用这个控件时老是报引发类型为“System.Windows.Forms.AxHost+InvalidActiveXStateException”的异常错误,后经查,除了实例化,还要初始化该对象。AxJAVOLELib.AxJAVOlecam[i]=newAxJAVOLELib.AxJA
- 微信开发者验证接口开发
362217990
微信 开发者 token 验证
微信开发者接口验证。
Token,自己随便定义,与微信填写一致就可以了。
根据微信接入指南描述 http://mp.weixin.qq.com/wiki/17/2d4265491f12608cd170a95559800f2d.html
第一步:填写服务器配置
第二步:验证服务器地址的有效性
第三步:依据接口文档实现业务逻辑
这里主要讲第二步验证服务器有效性。
建一个
- 一个小编程题-类似约瑟夫环问题
BrokenDreams
编程
今天群友出了一题:
一个数列,把第一个元素删除,然后把第二个元素放到数列的最后,依次操作下去,直到把数列中所有的数都删除,要求依次打印出这个过程中删除的数。
&
- linux复习笔记之bash shell (5) 关于减号-的作用
eksliang
linux关于减号“-”的含义linux关于减号“-”的用途linux关于“-”的含义linux关于减号的含义
转载请出自出处:
http://eksliang.iteye.com/blog/2105677
管道命令在bash的连续处理程序中是相当重要的,尤其在使用到前一个命令的studout(标准输出)作为这次的stdin(标准输入)时,就显得太重要了,某些命令需要用到文件名,例如上篇文档的的切割命令(split)、还有
- Unix(3)
18289753290
unix ksh
1)若该变量需要在其他子进程执行,则可用"$变量名称"或${变量}累加内容
什么是子进程?在我目前这个shell情况下,去打开一个新的shell,新的那个shell就是子进程。一般状态下,父进程的自定义变量是无法在子进程内使用的,但通过export将变量变成环境变量后就能够在子进程里面应用了。
2)条件判断: &&代表and ||代表or&nbs
- 关于ListView中性能优化中图片加载问题
酷的飞上天空
ListView
ListView的性能优化网上很多信息,但是涉及到异步加载图片问题就会出现问题。
具体参看上篇文章http://314858770.iteye.com/admin/blogs/1217594
如果每次都重新inflate一个新的View出来肯定会造成性能损失严重,可能会出现listview滚动是很卡的情况,还会出现内存溢出。
现在想出一个方法就是每次都添加一个标识,然后设置图
- 德国总理默多克:给国人的一堂“震撼教育”课
永夜-极光
教育
http://bbs.voc.com.cn/topic-2443617-1-1.html德国总理默多克:给国人的一堂“震撼教育”课
安吉拉—默克尔,一位经历过社会主义的东德人,她利用自己的博客,发表一番来华前的谈话,该说的话,都在上面说了,全世界想看想传播——去看看默克尔总理的博客吧!
德国总理默克尔以她的低调、朴素、谦和、平易近人等品格给国人留下了深刻印象。她以实际行动为中国人上了一堂
- 关于Java继承的一个小问题。。。
随便小屋
java
今天看Java 编程思想的时候遇见一个问题,运行的结果和自己想想的完全不一样。先把代码贴出来!
//CanFight接口
interface Canfight {
void fight();
}
//ActionCharacter类
class ActionCharacter {
public void fight() {
System.out.pr
- 23种基本的设计模式
aijuans
设计模式
Abstract Factory:提供一个创建一系列相关或相互依赖对象的接口,而无需指定它们具体的类。 Adapter:将一个类的接口转换成客户希望的另外一个接口。A d a p t e r模式使得原本由于接口不兼容而不能一起工作的那些类可以一起工作。 Bridge:将抽象部分与它的实现部分分离,使它们都可以独立地变化。 Builder:将一个复杂对象的构建与它的表示分离,使得同
- 《周鸿祎自述:我的互联网方法论》读书笔记
aoyouzi
读书笔记
从用户的角度来看,能解决问题的产品才是好产品,能方便/快速地解决问题的产品,就是一流产品.
商业模式不是赚钱模式
一款产品免费获得海量用户后,它的边际成本趋于0,然后再通过广告或者增值服务的方式赚钱,实际上就是创造了新的价值链.
商业模式的基础是用户,木有用户,任何商业模式都是浮云.商业模式的核心是产品,本质是通过产品为用户创造价值.
商业模式还包括寻找需求
- JavaScript动态改变样式访问技术
百合不是茶
JavaScriptstyle属性ClassName属性
一:style属性
格式:
HTML元素.style.样式属性="值";
创建菜单:在html标签中创建 或者 在head标签中用数组创建
<html>
<head>
<title>style改变样式</title>
</head>
&l
- jQuery的deferred对象详解
bijian1013
jquerydeferred对象
jQuery的开发速度很快,几乎每半年一个大版本,每两个月一个小版本。
每个版本都会引入一些新功能,从jQuery 1.5.0版本开始引入的一个新功能----deferred对象。
&nb
- 淘宝开放平台TOP
Bill_chen
C++c物流C#
淘宝网开放平台首页:http://open.taobao.com/
淘宝开放平台是淘宝TOP团队的产品,TOP即TaoBao Open Platform,
是淘宝合作伙伴开发、发布、交易其服务的平台。
支撑TOP的三条主线为:
1.开放数据和业务流程
* 以API数据形式开放商品、交易、物流等业务;
&
- 【大型网站架构一】大型网站架构概述
bit1129
网站架构
大型互联网特点
面对海量用户、海量数据
大型互联网架构的关键指标
高并发
高性能
高可用
高可扩展性
线性伸缩性
安全性
大型互联网技术要点
前端优化
CDN缓存
反向代理
KV缓存
消息系统
分布式存储
NoSQL数据库
搜索
监控
安全
想到的问题:
1.对于订单系统这种事务型系统,如
- eclipse插件hibernate tools安装
白糖_
Hibernate
eclipse helios(3.6)版
1.启动eclipse 2.选择 Help > Install New Software...> 3.添加如下地址:
http://download.jboss.org/jbosstools/updates/stable/helios/ 4.选择性安装:hibernate tools在All Jboss tool
- Jquery easyui Form表单提交注意事项
bozch
jquery easyui
jquery easyui对表单的提交进行了封装,提交的方式采用的是ajax的方式,在开发的时候应该注意的事项如下:
1、在定义form标签的时候,要将method属性设置成post或者get,特别是进行大字段的文本信息提交的时候,要将method设置成post方式提交,否则页面会抛出跨域访问等异常。所以这个要
- Trie tree(字典树)的Java实现及其应用-统计以某字符串为前缀的单词的数量
bylijinnan
java实现
import java.util.LinkedList;
public class CaseInsensitiveTrie {
/**
字典树的Java实现。实现了插入、查询以及深度优先遍历。
Trie tree's java implementation.(Insert,Search,DFS)
Problem Description
Igna
- html css 鼠标形状样式汇总
chenbowen00
htmlcss
css鼠标手型cursor中hand与pointer
Example:CSS鼠标手型效果 <a href="#" style="cursor:hand">CSS鼠标手型效果</a><br/>
Example:CSS鼠标手型效果 <a href="#" style=&qu
- [IT与投资]IT投资的几个原则
comsci
it
无论是想在电商,软件,硬件还是互联网领域投资,都需要大量资金,虽然各个国家政府在媒体上都给予大家承诺,既要让市场的流动性宽松,又要保持经济的高速增长....但是,事实上,整个市场和社会对于真正的资金投入是非常渴望的,也就是说,表面上看起来,市场很活跃,但是投入的资金并不是很充足的......
- oracle with语句详解
daizj
oraclewithwith as
oracle with语句详解 转
在oracle中,select 查询语句,可以使用with,就是一个子查询,oracle 会把子查询的结果放到临时表中,可以反复使用
例子:注意,这是sql语句,不是pl/sql语句, 可以直接放到jdbc执行的
----------------------------------------------------------------
- hbase的简单操作
deng520159
数据库hbase
近期公司用hbase来存储日志,然后再来分析 ,把hbase开发经常要用的命令找了出来.
用ssh登陆安装hbase那台linux后
用hbase shell进行hbase命令控制台!
表的管理
1)查看有哪些表
hbase(main)> list
2)创建表
# 语法:create <table>, {NAME => <family&g
- C语言scanf继续学习、算术运算符学习和逻辑运算符
dcj3sjt126com
c
/*
2013年3月11日20:37:32
地点:北京潘家园
功能:完成用户格式化输入多个值
目的:学习scanf函数的使用
*/
# include <stdio.h>
int main(void)
{
int i, j, k;
printf("please input three number:\n"); //提示用
- 2015越来越好
dcj3sjt126com
歌曲
越来越好
房子大了电话小了 感觉越来越好
假期多了收入高了 工作越来越好
商品精了价格活了 心情越来越好
天更蓝了水更清了 环境越来越好
活得有奔头人会步步高
想做到你要努力去做到
幸福的笑容天天挂眉梢 越来越好
婆媳和了家庭暖了 生活越来越好
孩子高了懂事多了 学习越来越好
朋友多了心相通了 大家越来越好
道路宽了心气顺了 日子越来越好
活的有精神人就不显
- java.sql.SQLException: Value '0000-00-00' can not be represented as java.sql.Tim
feiteyizu
mysql
数据表中有记录的time字段(属性为timestamp)其值为:“0000-00-00 00:00:00”
程序使用select 语句从中取数据时出现以下异常:
java.sql.SQLException:Value '0000-00-00' can not be represented as java.sql.Date
java.sql.SQLException: Valu
- Ehcache(07)——Ehcache对并发的支持
234390216
并发ehcache锁ReadLockWriteLock
Ehcache对并发的支持
在高并发的情况下,使用Ehcache缓存时,由于并发的读与写,我们读的数据有可能是错误的,我们写的数据也有可能意外的被覆盖。所幸的是Ehcache为我们提供了针对于缓存元素Key的Read(读)、Write(写)锁。当一个线程获取了某一Key的Read锁之后,其它线程获取针对于同
- mysql中blob,text字段的合成索引
jackyrong
mysql
在mysql中,原来有一个叫合成索引的,可以提高blob,text字段的效率性能,
但只能用在精确查询,核心是增加一个列,然后可以用md5进行散列,用散列值查找
则速度快
比如:
create table abc(id varchar(10),context blog,hash_value varchar(40));
insert into abc(1,rep
- 逻辑运算与移位运算
latty
位运算逻辑运算
源码:正数的补码与原码相同例+7 源码:00000111 补码 :00000111 (用8位二进制表示一个数)
负数的补码:
符号位为1,其余位为该数绝对值的原码按位取反;然后整个数加1。 -7 源码: 10000111 ,其绝对值为00000111 取反加一:11111001 为-7补码
已知一个数的补码,求原码的操作分两种情况:
- 利用XSD 验证XML文件
newerdragon
javaxmlxsd
XSD文件 (XML Schema 语言也称作 XML Schema 定义(XML Schema Definition,XSD)。 具体使用方法和定义请参看:
http://www.w3school.com.cn/schema/index.asp
java自jdk1.5以上新增了SchemaFactory类 可以实现对XSD验证的支持,使用起来也很方便。
以下代码可用在J
- 搭建 CentOS 6 服务器(12) - Samba
rensanning
centos
(1)安装
# yum -y install samba
Installed:
samba.i686 0:3.6.9-169.el6_5
# pdbedit -a rensn
new password:123456
retype new password:123456
……
(2)Home文件夹
# mkdir /etc
- Learn Nodejs 01
toknowme
nodejs
(1)下载nodejs
https://nodejs.org/download/ 选择相应的版本进行下载 (2)安装nodejs 安装的方式比较多,请baidu下
我这边下载的是“node-v0.12.7-linux-x64.tar.gz”这个版本 (1)上传服务器 (2)解压 tar -zxvf node-v0.12.
- jquery控制自动刷新的代码举例
xp9802
jquery
1、html内容部分 复制代码代码示例: <div id='log_reload'>
<select name="id_s" size="1">
<option value='2'>-2s-</option>
<option value='3'>-3s-</option


