昨晚九时左右,我们的 EC2 集群的监控系统触发了一条报警:
Alert: Instance xxx has high steal CPU usage (> 20%) for over 15 minutes
在云服务主机中,CPU steal time 并不少见。如果宿主机上其他的租户正在贪婪地运行 CPU-intensive 的任务,可能会抢占一部分本来属于你的虚拟机的时间,这些被抢占的时间就被报告为 steal time。
对于 AWS EC2 来说,情况有一点不同。AWS 使用 CPU Credit 来限制 EC2 实例的 CPU 使用,当实例过于频繁地使用 CPU,以至于超过了自身的 CPU Credit 配额,这个时候 steal time 就出现了。
问题排查
第一步当然是查清楚故障实例是否正在疯狂使用 CPU。登录 CloudWatch,检查该实例的 CPU 资源使用情况。发现这台实例的 CPU 使用率并不高,其 CPU Credit 配额十分富余。
这就相当于,你在银行还有一亿元存款,银行却告诉你,你破产了!
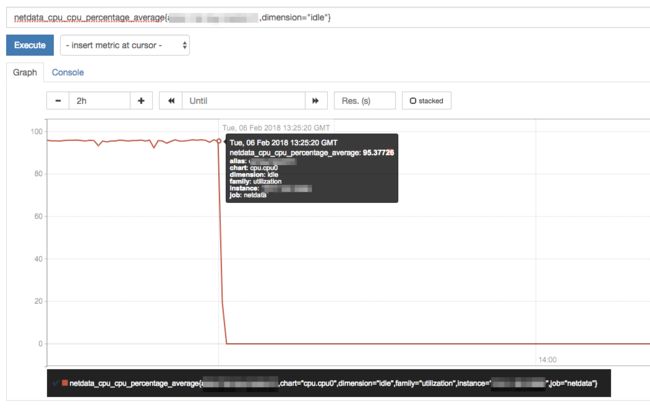
与此同时,我们的 Prometheus 监控系统给出了一些诡异的数据。
实例的 CPU idle time 直接掉到了 0(应该接近 100):
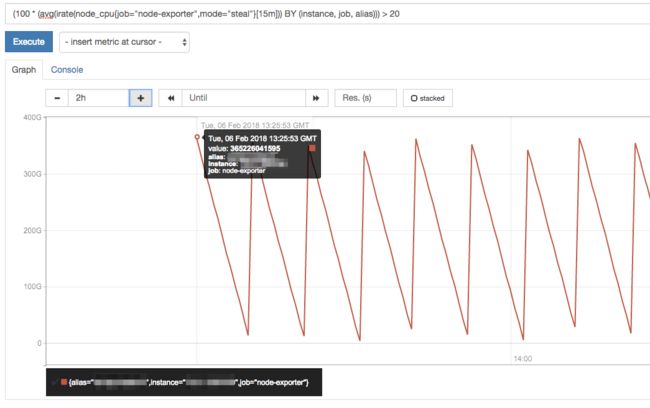
实例的 CPU steal time 升到了一个无法理解的巨大的数值(应该是 0):
通过远程 SSH 登录该机器,检查系统的状况。逐项检查了系统的各项资源的使用情况,并没有发现资源使用率饱合的情况。系统中的服务也都运行正常。在终端多次运行命令 vmstat 1,输出的结果似乎也没有什么问题:
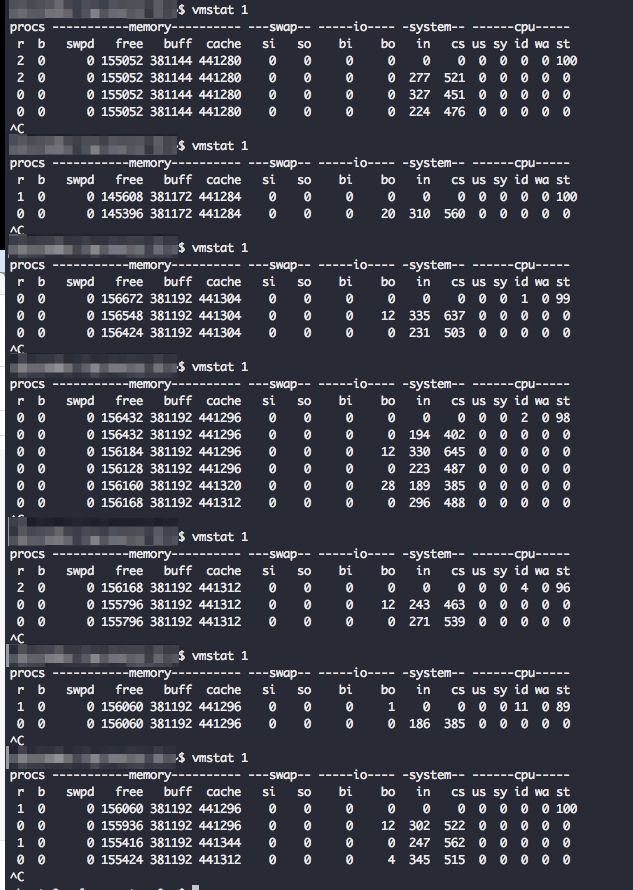
不过,等一等,上面的输出中有两个诡异的地方:
- 每次运行命令的第一行输出中,CPU steal time (st) 的值总是接近 100(应该是 0 才对);
- 第一行之后的输出中,CPU idle time (id) 的值总是 0(应该接近 100 才对)。
Hmmm,完全没有道理啊。
鉴于 vmstat 命令的 CPU 统计信息是从文件 /proc/stat 中读取的,下一步自然是检查这个文件。
这个文件的内容格式如下:
cpu  1085 316 940 770781 252 0 90 0 0 0
...
其中倒数第三项数字正是自系统启动以来的 CPU steal time 的累加值。
好,打印十次文件内容,每次间隔 0.1 秒钟:
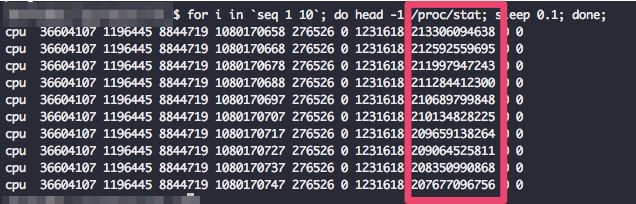
注意看倒数第三列:应该是累加值才对啊,为什么数字在递减呢。难倒时间正在倒流?
既然时间不能倒流,那就只能是 /proc/stat 中的数据破损了。这个文件是由内核维护的。也就是说,是不是内核中统计 CPU steal time 的代码存在 bug?
搜寻一下 bug 数据库,在这个代码路径中果然有 bug:https://bugs.debian.org/cgi-bin/bugreport.cgi?bug=871608。这篇文章 描述得很清楚。
简单总结一下,如果宿主机遇到了硬件故障或者云服务商对虚拟机执行过 VM migrating 操作,就有可能触发这个 bug,导致虚拟机中的 CPU 计数器失效。
重启系统就能解除目前遇到的问题。不过,我想确认一下,这个问题到底是不是由宿主机引起的。
问题确认
向 AWS 提交工单,描述了我们遇到的问题。
几个小时之后,收到了 AWS 客服的回复,下面是回复内容:
Problem Description:
You find a wrong idle and stolen metrics in monitoring report, you want to know the reason and solution.Diagnostic Analysis:
- Based on your description, I searched the instance details in our tool and the specific time (2018-02-06 13:25 UTC). I found there was a underlying hardware issue at the matched time and the issue has been fixed timely.
- Based on our back-end team's response, when the hardware issue happened, they had seen the abnormal stolen time happening on instances running kernel 4.9.XXX and above versions. I also checked instance xxx and found its kernel is 4.10.X.
- I am not sure whether the abnormal behavior is still exist in your instance. If the instance still meet the issue, please reboot the instance to recover. Since these are kernel counters after all, a reboot would reset everything and they will be back on track.
...
这就印证了我的猜测,确实是宿主机出现了问题。
问题解决
重启系统,问题解决。