比特币下跌与加密货币的联动效应(附代码)
作者:Pawel Lachowicz
前言
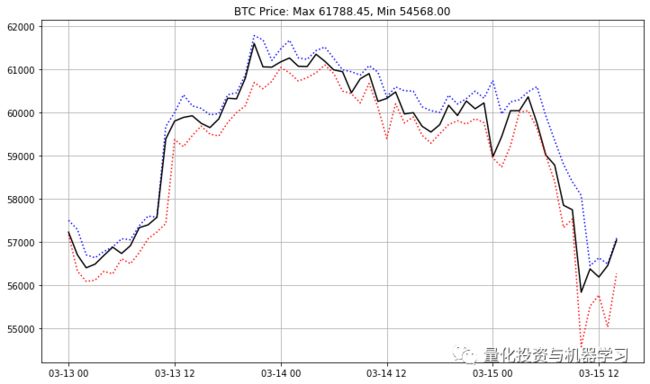
比特币价格突然下跌经常导致相关加密货币也随之波动。在今天的文章中,我们将对这一现象进行定量的研究分析。具体来说,我们将分析比特币在2021年3月13日达到61788美元之后进行抛售的市场情况,根据Coinbase Pro的数据,仅仅两天后,比特币价格就跌至54568美元。
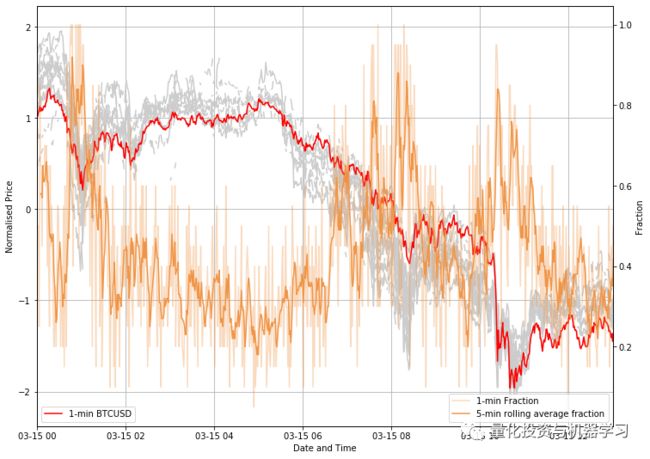
我们通过编程来计算加密资产的时间依赖fraction,1分钟收盘价格的反应方式与比特币完全相同。这种方法与经典的线性相关方法不同,因为它捕捉的是瞬时价格运动,而不是价格点之间的长期关系。在最后我们得出结论,在某些交易时段,跟随比特币的资产比例可能高达95%至100%。我们还假设计算的平均瞬时相关性5分钟滚动均值可以用作加密资产的短期(滞后)抛售风险度量。
数据整理
import ccrypto as cc
import numpy as np
import pandas as pd
import pickle
import matplotlib.pyplot as plt

grey = (.8,.8,.8)

# 下载 BTC OHLC
b = cc.getCryptoSeries('BTC', 'USD', freq='h', ohlc=True, exch='Coinbase', \
                            start_date='2021-03-13 00:00')

fig, ax1 = plt.subplots(1,1, figsize=(12,7))
ax1.plot(b.BTCUSD_H, 'b:')
ax1.plot(b.BTCUSD_C, 'k')
ax1.plot(b.BTCUSD_L, 'r:')
ax1.grid()
plt.title('BTC Price: Max %.2f, Min %.2f' % (b.BTCUSD_H.max(), b.BTCUSD_L.min()))
接下来,我们在Coinbase上获取一些当下热点的加密货币收盘价时间序列(1分钟)。我们希望通过1分钟的价格时间序列来了解价格变动的原因,尽可能准确地测量特定加密资产价格对比特币本身的最直接或间接的反馈。
ccys = ['BTC', 'ETH', 'LTC', 'LINK', 'BCH', 'XLM', 'WBTC', 'AAVE', 'EOS', 'ATOM',
        'XTZ', 'DASH', 'GRT', 'MKR', 'SNX', 'ALGO', 'COMP', 'ZEC', 'ETC', 'YFI',
        'CGLD', 'OMG', 'UNI', 'UMA']
timeseries = {}
fi = True
plt.figure(figsize=(12,7))
for ccy in ccys:
timeseries[ccy] = cc.getCryptoSeries(ccy, 'USD', freq='m', exch='Coinbase', \
start_date='2021-03-15 00:00')
if fi:
df = timeseries[ccy]
fi = False
else:
df = pd.merge(left=df, right=timeseries[ccy], how='left',
left_index=True, right_index=True)
plt.plot((timeseries[ccy]-timeseries[ccy].mean())/timeseries[ccy].std(), color=grey)
plt.plot((timeseries['BTC']-timeseries['BTC'].mean())/timeseries['BTC'].std(),
color='r', label='Bitcoin')
plt.legend(loc=3)
plt.grid()
plt.ylabel('Standardised Price')
plt.xlabel('Date/Time')
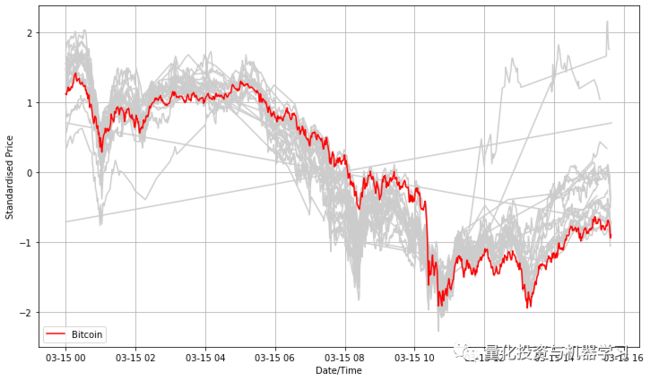
plt.savefig("/Users/pawel/Desktop/trig2.png", bbox_inches='tight')对价格序列进行标准化:
从上图直观感受,不是每一种加密货币都像比特币那样频繁交易。有趣的是,交易方向与比特币模式非常一致。
将数据转换为1分钟收益序列:
df_ret = df.pct_change(periods=1)

mask = df_ret.isna()
df_ret[mask] = np.nan

df_ret.dropna(how='all', axis=0, inplace=True)

del df_ret['GRTUSD']
del df_ret['ALGOUSD']
del df_ret['CGLDUSD']
del df_ret['UMAUSD']
通过人工查看收益矩阵表,我们去除了4个资产。由于缺乏足够的数据而导致时间序列为0。
瞬时相关性
df_ret_dir = df_ret.copy()

display(df_ret_dir.head(10))
接下来进行数据转换,这是最重要的一部分!我们逐行移动存储1分钟收益率的DataFrame。对于每一行,我们读出第一个单元格的值。如果小于0,则将btc_sign赋值为负,否则赋值为正。接下来,覆盖整行,对给定加密货币的收益率和比特币的收益率进行符号比较。
for i in range(0, df_ret.shape[0]):
    row = df_ret.iloc[i]
    btc_sign = -1 if df_ret.iloc[i][0] < 0.0 else 1
    df_ret_dir.iloc[i] = np.sign(row) == btc_sign
我们可以看到给定的资产是否遵循比特币显示的交易方向。我们可以将其称为加密货币收益率与比特币之间的瞬时相关性。
最后,我们得到df_ret_dir DataFrame转换成如下形式:
display(df_ret_dir.head(10))3、研究结论
对df_ret_dir DataFrame的每一个时间戳(行)进行如下计算:
fraction = df_ret_dir.astype(int).sum(axis=1) / df_ret_dir.shape[1]

display(pd.DataFrame(fraction, columns=['Fraction']))
fig, ax1 = plt.subplots(1,1, figsize=(12,9))
for ccy in ret.columns.tolist():
ax1.plot((df[ccy]-df[ccy].mean())/df[ccy].std(), color=grey)
ax1.plot((df['BTCUSD']-df['BTCUSD'].mean())/df['BTCUSD'].std(), 'r-', label='1-min BTCUSD')
ax1.grid()
ax1.set_ylabel('Normalised Price')
ax1.set_xlabel('Date and Time')
ax2 = ax1.twinx()
ax2.plot(ratio.iloc[1:], '-', color='#f09547', alpha=0.35, label='1-min Fraction')
ax2.plot(fraction.rolling(5).mean(), color='#f09547', label='5-min rolling average fraction')
ax2.set_ylabel('Fraction')
ax2.legend(loc=4)
ax1.legend(loc=3)
ax1.set_xlim([pd.to_datetime('2021-03-15 00:00'), pd.to_datetime('2021-03-15 13:00')])
plt.savefig("/Users/pawel/Desktop/trig6.png", bbox_inches='tight')大家看上图比特币突然抛售期间。在某些交易时段,BTC的资产比例可能高达95%甚至100%(橙色曲线)。我们假设计算的平均瞬时相关性5分钟滚动均值可以用作加密资产的短期(滞后)抛售风险度量。
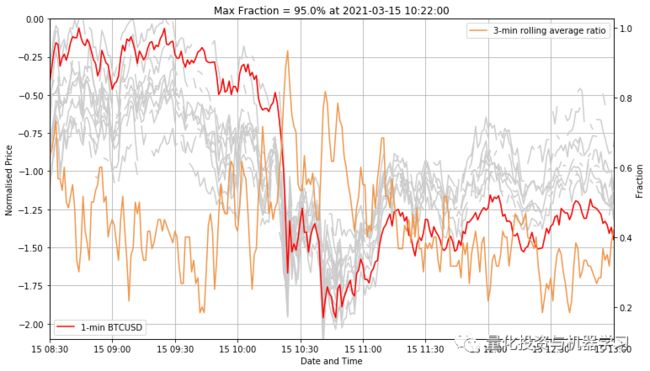
2021年3月15日10:20,3分钟滚动平均fraction:
fig, ax1 = plt.subplots(1,1, figsize=(12,7))

for ccy in ret.columns.tolist():
    ax1.plot((df[ccy]-df[ccy].mean())/df[ccy].std(), color=grey)

ax1.plot((df['BTCUSD']-df['BTCUSD'].mean())/df['BTCUSD'].std(), 'r-', label='1-min BTCUSD')
ax1.grid()
ax1.set_ylabel('Normalised Price')
ax1.set_xlabel('Date and Time')
ax2 = ax1.twinx()
ax2.plot(fraction.rolling(3).mean(), color='#f09547', label='3-min rolling average ratio')
ax2.set_ylabel('Fraction')
ax2.legend(loc=1)
ax1.legend(loc=3)
ax1.set_ylim([-2.1, 0])
ax1.set_xlim([pd.to_datetime('2021-03-15 08:30'), pd.to_datetime('2021-03-15 13:00')])
plt.title('Max Fraction = %.1f%% at %s' %
          (100*(fraction[fraction.index > '2021-03-15 08:30']).max(),
           fraction[fraction.index > '2021-03-15 08:30'].index[fraction[fraction.index >
                                                               '2021-03-15 08:30'].argmax()]))
95%的资产同时(或者可能是)受比特币影响:
最可能的解释可能是与紧跟BTC/XXX空间价格波动的高频交易算法有关,并在不到60秒的时间尺度上做出反应。
量化投资与机器学习微信公众号,是业内垂直于量化投资、对冲基金、Fintech、人工智能、大数据等领域的主流自媒体。公众号拥有来自公募、私募、券商、期货、银行、保险、高校等行业20W+关注者,连续2年被腾讯云+社区评选为“年度最佳作者”。


