章节3:分类
本章节将介绍分类问题,我们将使用最简单的最近邻分类法(k-Nearest)完成。分类是监督学习中最基础的任务。
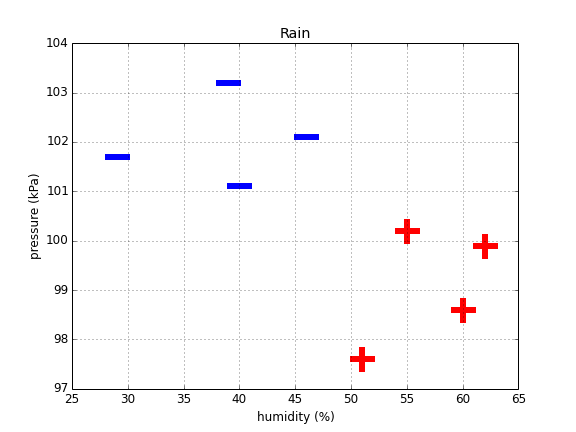
分类
考虑以下数据集:
import numpy as np
from IPython.display import HTML, display
import tabulate
import matplotlib.pyplot as plt

# toy datast of whether or not it will be rainy or sunny
feature_names = ["Humidity (%)", "Pressure (kPa)"]
data = [[29, 101.7], [60, 98.6], [40, 101.1], [62, 99.9], [39, 103.2], [51, 97.6], [46, 102.1], [55, 100.2]]
labels = ["Sun","Rain","Sun","Rain","Sun","Rain","Sun","Rain"]

# display table
table_labels = np.array(['class']+feature_names).reshape((1, 1+len(feature_names)))
table_data = np.concatenate([np.array(labels).reshape(len(data), 1), data], axis=1)
table_full = np.concatenate([table_labels, table_data], axis=0)
display(HTML(tabulate.tabulate(table_full, tablefmt='html')))

K最近邻分类法
我们将介绍一个简单的用于分类问题的算法——K最近邻分类法(KNN)。首先,我们通过导入一个更实际的数据集Iris来扩大我们的问题。Iris是一个包含150个鸢尾花基因样本的数据,分为3个不同的种类山鸢尾(Iris setosa)、维吉尼亚鸢尾(Iris virginica)、杂色鸢尾(Iris versicolor)。每个数据包含4个属性。可通过花萼长度,花萼宽度,花瓣长度,花瓣宽度4个属性预测鸢尾花卉属于三个种类中的哪一类。
接下来,我们导入数据集并随机化,
import numpy as np
from sklearn.datasets import load_iris

# load iris and grab our data and labels
iris = load_iris()
labels, data = iris.target, iris.data

num_samples = len(labels)  # size of our dataset
num_features = len(iris.feature_names)  # number of columns/variables

# shuffle the dataset
shuffle_order = np.random.permutation(num_samples)
data = data[shuffle_order, :]
labels = labels[shuffle_order]
让我们用一个表格展示下前20个数据,
label_names = np.array([iris.target_names[l] for l in labels])
table_labels = np.array(['class']+iris.feature_names).reshape((1, 1+num_features))
class_names = iris.target_names
table_data = np.concatenate([np.array(label_names).reshape(num_samples, 1), data], axis=1)[0:20]

# display table
table_full = np.concatenate([table_labels, table_data], axis=0)
display(HTML(tabulate.tabulate(table_full, tablefmt='html')))

为了简单起见,我们只使用两个特征花萼长度和花萼宽度来标记我们的数据,
# plot the original data
x, y, lab = data[:, 0], data[:, 1], labels

plt.figure(figsize=(8, 6))
plt.scatter(x, y, c=lab)
plt.xlabel('Sepal length')
plt.ylabel('Sepal width')
plt.title('Iris dataset')

假如给定一组关于花萼长度(x)和花萼宽度(y)的新的数据,
new_x, new_y = 6.5, 3.7
让我们将它绘制在散点图中,看看它属于哪一类?
# plot the original data
x, y, lab = data[:, 0], data[:, 1], labels

plt.figure(figsize=(8, 6))
plt.scatter(x, y, c=lab)
plt.xlabel('Sepal length')
plt.ylabel('Sepal width')
plt.title('Iris dataset')

# put the new point on top
plt.scatter(new_x, new_y, c='grey', cmap=None, edgecolor='k')
plt.annotate('?', (new_x+0.45, new_y+0.25), fontsize=20, horizontalalignment='center', verticalalignment='center')
plt.annotate("", xytext=(new_x+0.4, new_y+0.2), xy=(new_x+0.05, new_y), arrowprops=dict(arrowstyle="->"))

最简单的一个预测该数据标签的方法是寻找数据集中距离该数据点最近的一个数据,并复制其标签给新的数据。
# calculate the distance between the new point and each of the points in our labeled dataset# calcu
distances = np.sum((data[:,0:2] - [new_x, new_y])**2, axis=1)

# find the index of the point whose distance is lowest
closest_point = np.argmin(distances)

# take its label
new_label = labels[closest_point]

print('Predicted label: %d'%new_label)
Predicted label: 2
这就是K最近邻算法,这里的k设置为1。当k>1时,我们找最近的k个点,并进行排序。现在我们可以将新标记好的数据绘制在散点图中,
# append the newly labeled point in our dataset
x = np.append(x, new_x)
y = np.append(y, new_y)
lab = np.append(lab, new_label)

# scatter plot as before
plt.figure(figsize=(8, 6))
plt.scatter(x, y, c=lab)
plt.xlabel('Sepal length')
plt.ylabel('Sepal width')
plt.title('Iris dataset')
plt.annotate("", xytext=(x[closest_point]+0.02, y[closest_point]+0.02), xy=(new_x-0.02, new_y-0.02), arrowprops=dict(arrowstyle="->"))
