matplotlib.pyplot绘图API
主要是4类图表
plot-折线:
plt.plot(random_data)
fig, subplot_arr = plt.subplots(2, 2, figsize=(8, 8))
data = np.random.randn(20)
subplot_arr[0, 0].plot(data, '--r.')
subplot_arr[0, 1].plot(data, 'gv:')
subplot_arr[1, 0].plot(data, 'b<-')
subplot_arr[1, 1].plot(data, 'ys-.')
scatter - 散点图:
plt.scatter(x, y1, s=100, c='r', marker='x')
bar-柱状
plt.bar(x2, data2, color='g')
hist - 直方图:
plt.hist(population_ages, bins, histtype='bar', rwidth=0.8)
imshow-热力图:
plt.imshow(m, cmap=plt.cm.gnuplot)
plt.colorbar()
可以画子图 - plt.subplots()
# 共享y轴
fig, subplot_arr = plt.subplots(2, 2, figsize=(8, 8), sharey=True)
subplot_arr[0, 0].scatter(np.random.randn(50), np.random.randn(50) * 2)
subplot_arr[0, 1].bar([1, 2, 3, 4, 5], [5, 2, 7, 8, 2])
subplot_arr[1, 0].hist(np.random.randn(50), bins=10, rwidth=0.8)
subplot_arr[1, 1].imshow(np.random.rand(5, 5))
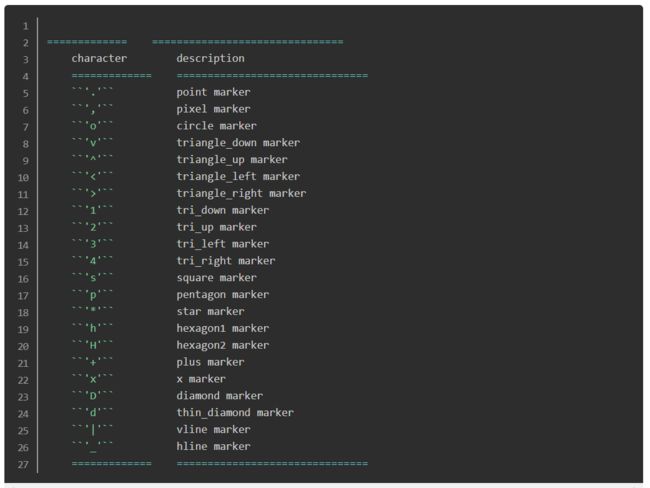
颜色,标记,线形
fig, subplot_arr = plt.subplots(2, 2, figsize=(8, 8))
data = np.random.randn(20)
subplot_arr[0, 0].plot(data, '--r.')
subplot_arr[0, 1].plot(data, 'gv:')
subplot_arr[1, 0].plot(data, 'b<-')
subplot_arr[1, 1].plot(data, 'ys-.')
刻度,标签,图例,标题
matplotlib.rcParams['font.sans-serif'] = ['SimHei'] # 指定默认字体matplotlib.rcParams['axes.unicode_minus'] = False # 解决保存图像是负号'-'显示为方块的问题
fig, ax = plt.subplots(1)ax.plot(data1, label='线1')
ax.plot(data2, label='线2')ax.plot(data3, label='线3')# 设置刻度
ax.set_xlim([0, 800])# 设置显示的刻度
ax.set_xticks([0, 100, 200, 300, 400, 500])# 设置刻度标签
ax.set_xticklabels(['一', '二', '三', '四', '五'])# 设置坐标轴标签
ax.set_xlabel('数据个数')ax.set_ylabel('随机数')# 设置标题
ax.set_title('示例3')# 图例
ax.legend(loc='best')plt.show()
Seaborn 绘图API
单变量分布、双变量分布
kdeplot, distplot
参数
kde=False, hist=False, rug=True,color=
jointplot
参数
x='x',y='y', data=df, kind='hex'|’kde’
变量关系可视化
pairplot
参数
hue=, vars=, kind=’reg’, diag_kind
类别散布图、类别内数据分布、类别内统计图
stripplot
swarmplot
boxplot
(2020.2.5)关于箱体图,有个比较关键的信息是 - 1. 中位数的横线两侧,表示数字是一样多的;2. 不同高度,表示数值差,面积小的说明密度大。意味着,箱体图中,如果中位数横线偏下,则说明序列中小数字比较多;否则就是大数字比较多。
一个实用小技巧,seaborn的箱体图可以和 matplotlib.pyplot 组合是使用
fig, plots = plt.subplots(2,4, figsize=(16,8))
for i, ax in enumerate(plots.flatten()):
if i < len(features):
sns.boxplot(x=features[i], y='tip', data=tips_df, ax=ax)
violinplot
barplot
pointplot
参数– x=,y=, data=,hue=,


