
项目全部代码 & 数据集都可以访问我的KLab --【Pyecharts】奥运会数据集可视化分析~获取,点击Fork即可~
受疫情影响,2020东京奥运会将延期至2021年举行;
虽然延期,但此次奥运会依旧会沿用「2020东京奥运会」这个名称;
这也将是奥运会历史上首次延期(1916年、1940年、1944年曾因一战,二战停办);
既然奥运会延期了,那我们就来回顾下整个奥运会的历史吧~
本项目将会从以下角度来呈现奥运会历史:
各国累计奖牌数;
⚽️各项运动产生金牌数
-
⛳️运动员层面
参赛人数趋势
女性参赛比例趋势
获得金牌最多的运动员
获得奖牌/金牌比例
各项目运动员平均体质数据
-
主要国家表现
中国表现
美国表现
被单个国家统治的奥运会项目
导入库 & 数据
import pandas as pd
import numpy as np
import pyecharts
from pyecharts.charts import *
from pyecharts import options as opts
from pyecharts.commons.utils import JsCode
athlete_data = pd.read_csv('/home/kesci/input/olympic/athlete_events.csv')
noc_region = pd.read_csv('/home/kesci/input/olympic/noc_regions.csv')

# 关联代表国家
data = pd.merge(athlete_data, noc_region, on='NOC', how='left')
data.head()
累计奖牌数
夏季奥运会 & 冬季奥运会分别统计
️夏季奥运会开始于1896年雅典奥运会;
❄️冬季奥运会开始于1924年慕尼黑冬奥会;
medal_data = data.groupby(['Year', 'Season', 'region',
                                        'Medal'])['Event'].nunique().reset_index()
medal_data.columns = ['Year', 'Season', 'region', 'Medal', 'Nums']
medal_data = medal_data.sort_values(by="Year" , ascending=True)

medal_data = data.groupby(['Year', 'Season', 'region',
                                        'Medal'])['Event'].nunique().reset_index()
medal_data.columns = ['Year', 'Season', 'region', 'Medal', 'Nums']
medal_data = medal_data.sort_values(by="Year" , ascending=True)
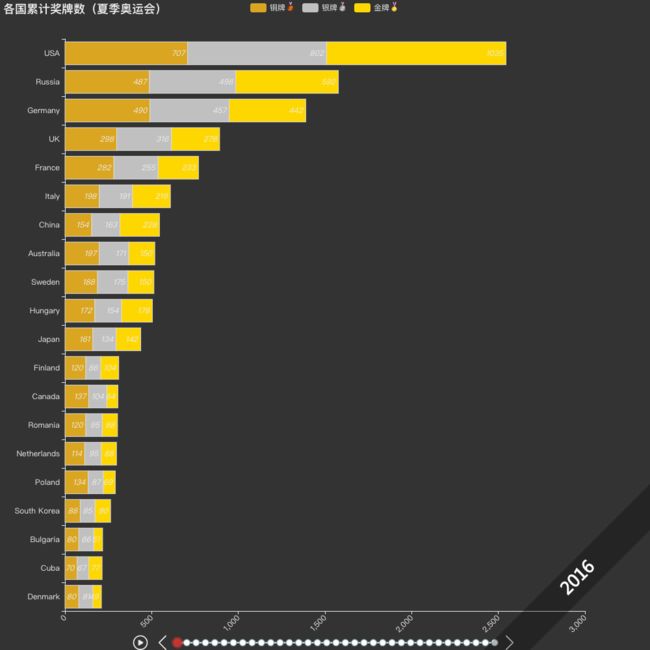
各国夏奥会累计奖牌数
截止2016年夏季奥运会,美俄分别获得了2544和1577枚奖牌,位列一二位;
中国由于参加奥运会时间较晚,截止2016年累计获得了545枚奖牌,位列第七位;
year_list = sorted(list(set(medal_data['Year'].to_list())), reverse=True)

tl = Timeline(init_opts=opts.InitOpts(theme='dark', width='1000px', height='1000px'))
tl.add_schema(is_timeline_show=True,is_rewind_play=True, is_inverse=False,
             label_opts=opts.LabelOpts(is_show=False))

for year in year_list:
    t_data = medal_stat(year)[::-1]
    bar = (
        Bar(init_opts=opts.InitOpts())
            .add_xaxis([x[0] for x in t_data])
           .add_yaxis("铜牌", [x[3] for x in t_data],
                        stack='stack1',
                        itemstyle_opts=opts.ItemStyleOpts(border_color='rgb(220,220,220)',color='rgb(218,165,32)'))
            .add_yaxis("银牌", [x[2] for x in t_data],
                        stack='stack1',
                        itemstyle_opts=opts.ItemStyleOpts(border_color='rgb(220,220,220)',color='rgb(192,192,192)'))
            .add_yaxis("金牌️", [x[1] for x in t_data],
                        stack='stack1',
                        itemstyle_opts=opts.ItemStyleOpts(border_color='rgb(220,220,220)',color='rgb(255,215,0)'))
            .set_series_opts(label_opts=opts.LabelOpts(is_show=True,
                                                       position='insideRight',
                                                       font_style='italic'),)
            .set_global_opts(
                title_opts=opts.TitleOpts(title="各国累计奖牌数(夏季奥运会)"),
                xaxis_opts=opts.AxisOpts(axislabel_opts=opts.LabelOpts(rotate=45)),
                legend_opts=opts.LegendOpts(is_show=True),
                graphic_opts=[opts.GraphicGroup(graphic_item=opts.GraphicItem(
                                                   rotation=JsCode("Math.PI / 4"),
                                                   bounding="raw",
                                                   right=110,
                                                   bottom=110,
                                                   z=100),
                                               children=[
                                                   opts.GraphicRect(
                                                       graphic_item=opts.GraphicItem(
                                                           left="center", top="center", z=100
                                                       ),
                                                       graphic_shape_opts=opts.GraphicShapeOpts(
                                                           width=400, height=50
                                                       ),
                                                       graphic_basicstyle_opts=opts.GraphicBasicStyleOpts(
                                                           fill="rgba(0,0,0,0.3)"
                                                       ),
                                                   ),
                                                   opts.GraphicText(
                                                       graphic_item=opts.GraphicItem(
                                                           left="center", top="center", z=100
                                                       ),
                                                       graphic_textstyle_opts=opts.GraphicTextStyleOpts(
                                                           text=year,
                                                           font="bold 26px Microsoft YaHei",
                                                           graphic_basicstyle_opts=opts.GraphicBasicStyleOpts(
                                                               fill="#fff"
                                                           ),
                                                       ),
                                                   ),
                                               ],
                                            )
                                    ],)
        .reversal_axis())
    tl.add(bar, year)

tl.render_notebook()
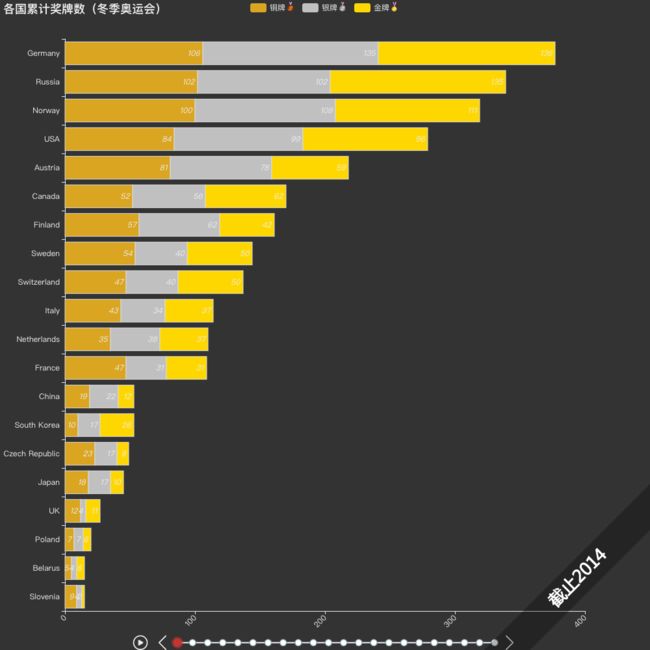
各国冬奥会累计奖牌数
year_list = sorted(list(set(medal_data['Year'][medal_data.Season=='Winter'].to_list())), reverse=True)

tl = Timeline(init_opts=opts.InitOpts(theme='dark', width='1000px', height='1000px'))
tl.add_schema(is_timeline_show=True,is_rewind_play=True, is_inverse=False,
             label_opts=opts.LabelOpts(is_show=False))

for year in year_list:
    t_data = medal_stat(year, 'Winter')[::-1]
    bar = (
        Bar(init_opts=opts.InitOpts(theme='dark'))
            .add_xaxis([x[0] for x in t_data])
            .add_yaxis("铜牌", [x[3] for x in t_data],
                        stack='stack1',
                        itemstyle_opts=opts.ItemStyleOpts(border_color='rgb(220,220,220)',color='rgb(218,165,32)'))
            .add_yaxis("银牌", [x[2] for x in t_data],
                        stack='stack1',
                        itemstyle_opts=opts.ItemStyleOpts(border_color='rgb(220,220,220)',color='rgb(192,192,192)'))
            .add_yaxis("金牌️", [x[1] for x in t_data],
                        stack='stack1',
                        itemstyle_opts=opts.ItemStyleOpts(border_color='rgb(220,220,220)',color='rgb(255,215,0)'))
            .set_series_opts(label_opts=opts.LabelOpts(is_show=True,
                                                       position='insideRight',
                                                       font_style='italic'),)
            .set_global_opts(
                title_opts=opts.TitleOpts(title="各国累计奖牌数(冬季奥运会)"),
                xaxis_opts=opts.AxisOpts(axislabel_opts=opts.LabelOpts(rotate=45)),
                legend_opts=opts.LegendOpts(is_show=True),
                graphic_opts=[opts.GraphicGroup(graphic_item=opts.GraphicItem(
                                                   rotation=JsCode("Math.PI / 4"),
                                                   bounding="raw",
                                                   right=110,
                                                   bottom=110,
                                                   z=100),
                                               children=[
                                                   opts.GraphicRect(
                                                       graphic_item=opts.GraphicItem(
                                                           left="center", top="center", z=100
                                                       ),
                                                       graphic_shape_opts=opts.GraphicShapeOpts(
                                                           width=400, height=50
                                                       ),
                                                       graphic_basicstyle_opts=opts.GraphicBasicStyleOpts(
                                                           fill="rgba(0,0,0,0.3)"
                                                       ),
                                                   ),
                                                   opts.GraphicText(
                                                       graphic_item=opts.GraphicItem(
                                                           left="center", top="center", z=100
                                                       ),
                                                       graphic_textstyle_opts=opts.GraphicTextStyleOpts(
                                                           text='截止{}'.format(year),
                                                           font="bold 26px Microsoft YaHei",
                                                           graphic_basicstyle_opts=opts.GraphicBasicStyleOpts(
                                                               fill="#fff"
                                                           ),
                                                       ),
                                                   ),
                                               ],
                                            )
                                    ],)
            .reversal_axis())
    tl.add(bar, year)

tl.render_notebook()
各项运动产生金牌数
基于2016年夏奥会和2014年冬奥会统计;
- 田径 & 游泳是大项,在2016年夏奥会上分别产生了47和34枚金牌;
background_color_js = """new echarts.graphic.RadialGradient(0.5, 0.5, 1, [{
                                        offset: 0,
                                        color: '#696969'
                                    }, {
                                        offset: 1,
                                        color: '#000000'
                                    }])"""

tab = Tab()
temp = data[(data['Medal']=='Gold') & (data['Year']==2016) & (data['Season']=='Summer')]

event_medal = temp.groupby(['Sport'])['Event'].nunique().reset_index()
event_medal.columns = ['Sport', 'Nums']
event_medal = event_medal.sort_values(by="Nums" , ascending=False)


pie = (Pie(init_opts=opts.InitOpts(bg_color=JsCode(background_color_js), width='1000px', height='800px'))
       .add('金牌️', [(row['Sport'], row['Nums']) for _, row in event_medal.iterrows()],
            radius=["30%", "75%"],
            rosetype="radius")
       .set_global_opts(title_opts=opts.TitleOpts(title="2016年夏季奥运会各项运动产生金牌占比",
                                                  pos_left="center",
                                                  title_textstyle_opts=opts.TextStyleOpts(color="white", font_size=20),     ),
                        legend_opts=opts.LegendOpts(is_show=False))
       .set_series_opts(label_opts=opts.LabelOpts(formatter="{b}: {d}%"),
                        tooltip_opts=opts.TooltipOpts(trigger="item", formatter="{a}
{b}: {c} ({d}%)"),)
      )
tab.add(pie, '2016年夏奥会')

temp = data[(data['Medal']=='Gold') & (data['Year']==2014) & (data['Season']=='Winter')]

event_medal = temp.groupby(['Sport'])['Event'].nunique().reset_index()
event_medal.columns = ['Sport', 'Nums']
event_medal = event_medal.sort_values(by="Nums" , ascending=False)


pie = (Pie(init_opts=opts.InitOpts(bg_color=JsCode(background_color_js), width='1000px', height='800px'))
       .add('金牌️', [(row['Sport'], row['Nums']) for _, row in event_medal.iterrows()],
            radius=["30%", "75%"],
            rosetype="radius")
       .set_global_opts(title_opts=opts.TitleOpts(title="2014年冬季奥运会各项运动产生金牌占比",
                                                  pos_left="center",
                                                  title_textstyle_opts=opts.TextStyleOpts(color="white", font_size=20),     ),
                        legend_opts=opts.LegendOpts(is_show=False))
       .set_series_opts(label_opts=opts.LabelOpts(formatter="{b}: {d}%"),
                        tooltip_opts=opts.TooltipOpts(trigger="item", formatter="{a}
{b}: {c} ({d}%)"
        ),)
      )
tab.add(pie, '2014年冬奥会')
tab.render_notebook()

运动员层面
历年参赛人数趋势
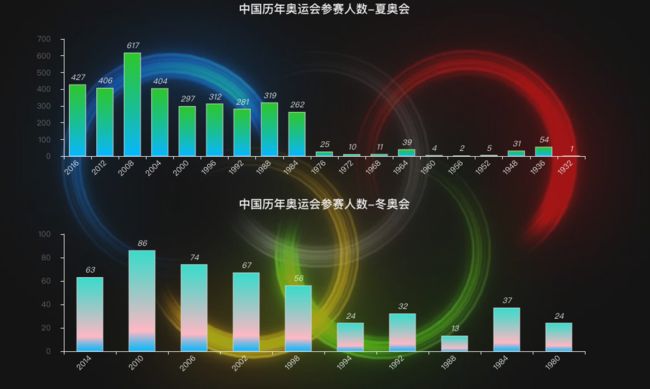
从人数来看,每届夏奥会参赛人数都是冬奥会的4-5倍;
整体参赛人数是上涨趋势,但由于历史原因也出现过波动,如1980年莫斯科奥运会层遭遇65个国家抵制;
athlete = data.groupby(['Year', 'Season'])['Name'].nunique().reset_index()
athlete.columns = ['Year', 'Season', 'Nums']
athlete = athlete.sort_values(by="Year" , ascending=True)

x_list, y1_list, y2_list = [], [], []

for _, row in athlete.iterrows():
    x_list.append(str(row['Year']))
    if row['Season'] == 'Summer':
        y1_list.append(row['Nums'])
        y2_list.append(None)
    else:
        y2_list.append(row['Nums'])
        y1_list.append(None)

background_color_js = (
    "new echarts.graphic.LinearGradient(1, 1, 0, 0, "
    "[{offset: 0, color: '#008B8B'}, {offset: 1, color: '#FF6347'}], false)"
)


line = (
    Line(init_opts=opts.InitOpts(bg_color=JsCode(background_color_js), width='1000px', height='600px'))
    .add_xaxis(x_list)
    .add_yaxis("夏季奥运会",
        y1_list,
        is_smooth=True,
        is_connect_nones=True,
        symbol="circle",
        symbol_size=6,
        linestyle_opts=opts.LineStyleOpts(color="#fff"),
        label_opts=opts.LabelOpts(is_show=False, position="top", color="white"),
        itemstyle_opts=opts.ItemStyleOpts(
            color="green", border_color="#fff", border_width=3),
        tooltip_opts=opts.TooltipOpts(is_show=True))
    .add_yaxis("冬季季奥运会",
        y2_list,
        is_smooth=True,
        is_connect_nones=True,
        symbol="circle",
        symbol_size=6,
        linestyle_opts=opts.LineStyleOpts(color="#FF4500"),
        label_opts=opts.LabelOpts(is_show=False, position="top", color="white"),
        itemstyle_opts=opts.ItemStyleOpts(
            color="red", border_color="#fff", border_width=3),
        tooltip_opts=opts.TooltipOpts(is_show=True))
    .set_series_opts(
        markarea_opts=opts.MarkAreaOpts(
            label_opts=opts.LabelOpts(is_show=True, position="bottom", color="white"),
            data=[
                opts.MarkAreaItem(name="第一次世界大战", x=(1914, 1918)),
                opts.MarkAreaItem(name="第二次世界大战", x=(1939, 1945)),
            ]
        )
    )
    .set_global_opts(title_opts=opts.TitleOpts(title="历届奥运会参赛人数",
                                                pos_left="center",
                                                title_textstyle_opts=opts.TextStyleOpts(color="white", font_size=20),),
                     legend_opts=opts.LegendOpts(is_show=True, pos_top='5%',
                                                 textstyle_opts=opts.TextStyleOpts(color="white", font_size=12)),
                     xaxis_opts=opts.AxisOpts(type_="value",
                                                min_=1904,
                                                max_=2016,
                                                boundary_gap=False,
                                                axislabel_opts=opts.LabelOpts(margin=30, color="#ffffff63",
                                                                              formatter=JsCode("""function (value)
                                                                               {return value+'年';}""")),
                                                axisline_opts=opts.AxisLineOpts(is_show=False),
                                                axistick_opts=opts.AxisTickOpts(
                                                    is_show=True,
                                                    length=25,
                                                    linestyle_opts=opts.LineStyleOpts(color="#ffffff1f"),
                                                ),
                                                splitline_opts=opts.SplitLineOpts(
                                                    is_show=True, linestyle_opts=opts.LineStyleOpts(color="#ffffff1f")
                                                ),
                                            ),
                    yaxis_opts=opts.AxisOpts(
                                            type_="value",
                                            position="right",
                                            axislabel_opts=opts.LabelOpts(margin=20, color="#ffffff63"),
                                            axisline_opts=opts.AxisLineOpts(
                                                linestyle_opts=opts.LineStyleOpts(width=2, color="#fff")
                                            ),
                                            axistick_opts=opts.AxisTickOpts(
                                                is_show=True,
                                                length=15,
                                                linestyle_opts=opts.LineStyleOpts(color="#ffffff1f"),
                                            ),
                                            splitline_opts=opts.SplitLineOpts(
                                                is_show=True, linestyle_opts=opts.LineStyleOpts(color="#ffffff1f")
                                            ),
                                        ),)
)

line.render_notebook()

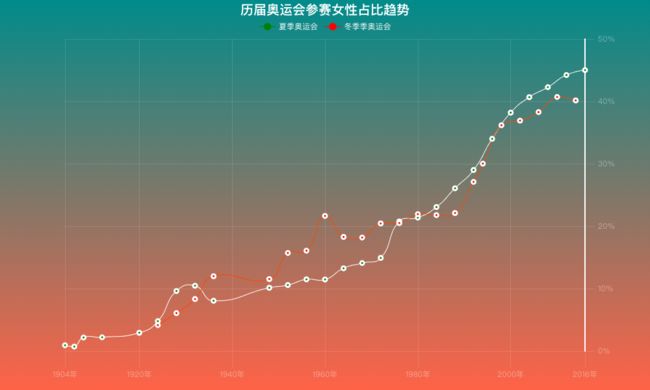
历年女性运动员占比趋势
一开始奥运会基本是「男人的运动」,女性运动员仅为个位数,到近几届奥运会男女参赛人数基本趋于相等;
# 历年男性运动员人数
m_data = data[data.Sex=='M'].groupby(['Year', 'Season'])['Name'].nunique().reset_index()
m_data.columns = ['Year', 'Season', 'M-Nums']
m_data = m_data.sort_values(by="Year" , ascending=True)

# 历年女性运动员人数
f_data = data[data.Sex=='F'].groupby(['Year', 'Season'])['Name'].nunique().reset_index()
f_data.columns = ['Year', 'Season', 'F-Nums']
f_data = f_data.sort_values(by="Year" , ascending=True)

t_data = pd.merge(m_data, f_data, on=['Year', 'Season'])
t_data['F-rate'] = round(t_data['F-Nums'] / (t_data['F-Nums']  + t_data['M-Nums'] ), 4)


x_list, y1_list, y2_list = [], [], []

for _, row in t_data.iterrows():
    x_list.append(str(row['Year']))
    if row['Season'] == 'Summer':
        y1_list.append(row['F-rate'])
        y2_list.append(None)
    else:
        y2_list.append(row['F-rate'])
        y1_list.append(None)

background_color_js = (
    "new echarts.graphic.LinearGradient(0, 0, 0, 1, "
    "[{offset: 0, color: '#008B8B'}, {offset: 1, color: '#FF6347'}], false)"
)


line = (
    Line(init_opts=opts.InitOpts(bg_color=JsCode(background_color_js), width='1000px', height='600px'))
    .add_xaxis(x_list)
    .add_yaxis("夏季奥运会",
        y1_list,
        is_smooth=True,
        is_connect_nones=True,
        symbol="circle",
        symbol_size=6,
        linestyle_opts=opts.LineStyleOpts(color="#fff"),
        label_opts=opts.LabelOpts(is_show=False, position="top", color="white"),
        itemstyle_opts=opts.ItemStyleOpts(color="green", border_color="#fff", border_width=3),
        tooltip_opts=opts.TooltipOpts(is_show=True),)
    .add_yaxis("冬季季奥运会",
        y2_list,
        is_smooth=True,
        is_connect_nones=True,
        symbol="circle",
        symbol_size=6,
        linestyle_opts=opts.LineStyleOpts(color="#FF4500"),
        label_opts=opts.LabelOpts(is_show=False, position="top", color="white"),
        itemstyle_opts=opts.ItemStyleOpts(color="red", border_color="#fff", border_width=3),
        tooltip_opts=opts.TooltipOpts(is_show=True),)
    .set_series_opts(tooltip_opts=opts.TooltipOpts(trigger="item", formatter=JsCode("""function (params)
                                                                           {return params.data[0]+ '年: ' + Number(params.data[1])*100 +'%';}""")),)
    .set_global_opts(title_opts=opts.TitleOpts(title="历届奥运会参赛女性占比趋势",
                                                pos_left="center",
                                                title_textstyle_opts=opts.TextStyleOpts(color="white", font_size=20),),
                     legend_opts=opts.LegendOpts(is_show=True, pos_top='5%',
                                                 textstyle_opts=opts.TextStyleOpts(color="white", font_size=12)),
                     xaxis_opts=opts.AxisOpts(type_="value",
                                                min_=1904,
                                                max_=2016,
                                                boundary_gap=False,
                                                axislabel_opts=opts.LabelOpts(margin=30, color="#ffffff63",
                                                                              formatter=JsCode("""function (value)
                                                                               {return value+'年';}""")),
                                                axisline_opts=opts.AxisLineOpts(is_show=False),
                                                axistick_opts=opts.AxisTickOpts(
                                                    is_show=True,
                                                    length=25,
                                                    linestyle_opts=opts.LineStyleOpts(color="#ffffff1f"),
                                                ),
                                                splitline_opts=opts.SplitLineOpts(
                                                    is_show=True, linestyle_opts=opts.LineStyleOpts(color="#ffffff1f")
                                                ),
                                            ),
                    yaxis_opts=opts.AxisOpts(
                                            type_="value",
                                            position="right",
                                            axislabel_opts=opts.LabelOpts(margin=20, color="#ffffff63",
                                                                          formatter=JsCode("""function (value)
                                                                           {return Number(value *100)+'%';}""")),
                                            axisline_opts=opts.AxisLineOpts(
                                                linestyle_opts=opts.LineStyleOpts(width=2, color="#fff")
                                            ),
                                            axistick_opts=opts.AxisTickOpts(
                                                is_show=True,
                                                length=15,
                                                linestyle_opts=opts.LineStyleOpts(color="#ffffff1f"),
                                            ),
                                            splitline_opts=opts.SplitLineOpts(
                                                is_show=True, linestyle_opts=opts.LineStyleOpts(color="#ffffff1f")
                                            ),
                                        ),)
)

line.render_notebook()
获得金牌最多的运动员
排在第一的是美国泳坛名将「菲尔普斯」,截止2016年奥运会总共获得了23枚金牌;
博尔特累计获得8枚奥运会金牌;
temp = data[(data['Medal']=='Gold')]

athlete = temp.groupby(['Name'])['Medal'].count().reset_index()
athlete.columns = ['Name', 'Nums']
athlete = athlete.sort_values(by="Nums" , ascending=True)


background_color_js = (
    "new echarts.graphic.LinearGradient(0, 0, 1, 1, "
    "[{offset: 0, color: '#008B8B'}, {offset: 1, color: '#FF6347'}], false)"
)

pb = (
    PictorialBar(init_opts=opts.InitOpts(bg_color=JsCode(background_color_js), width='1000px', height='800px'))
    .add_xaxis([x.replace(' ','\n') for x in athlete['Name'].tail(10).tolist()])
    .add_yaxis(
        "",
        athlete['Nums'].tail(10).tolist(),
        label_opts=opts.LabelOpts(is_show=False),
        symbol_size=25,
        symbol_repeat='fixed',
        symbol_offset=[0, 0],
        is_symbol_clip=True,
        symbol='image://https://cdn.kesci.com/upload/image/q8f8otrlfc.png')
    .reversal_axis()
    .set_global_opts(
        title_opts=opts.TitleOpts(title="获得金牌数量最多的运动员", pos_left='center',
                                  title_textstyle_opts=opts.TextStyleOpts(color="white", font_size=20),),
        xaxis_opts=opts.AxisOpts(is_show=False,),
        yaxis_opts=opts.AxisOpts(
            axistick_opts=opts.AxisTickOpts(is_show=False),
            axisline_opts=opts.AxisLineOpts(
                linestyle_opts=opts.LineStyleOpts(opacity=0)
            ),
        ),
    ))

pb.render_notebook()

获得金牌/奖牌比例
看菲尔普斯拿金牌拿到手软,但实际上想获得一块金牌的难度高吗?
整个奥运会(包括夏季,冬季奥运会)历史上参赛人数为134732,获得过金牌的运动员只有10413,占比7.7%;
获得过奖牌(包括金银铜)的运动员有28202人,占比20.93%;
total_athlete = len(set(data['Name']))
medal_athlete = len(set(data['Name'][data['Medal'].isin(['Gold', 'Silver', 'Bronze'])]))
gold_athlete = len(set(data['Name'][data['Medal']=='Gold']))


l1 = Liquid(init_opts=opts.InitOpts(theme='dark', width='1000px', height='800px'))
l1.add("获得奖牌", [medal_athlete/total_athlete],
            center=["70%", "50%"],
            label_opts=opts.LabelOpts(font_size=50,
                formatter=JsCode(
                    """function (param) {
                            return (Math.floor(param.value * 10000) / 100) + '%';
                        }"""),
                position="inside",
            ))
l1.set_global_opts(title_opts=opts.TitleOpts(title="获得过奖牌比例", pos_left='62%', pos_top='8%'))
l1.set_series_opts(tooltip_opts=opts.TooltipOpts(is_show=False))

l2 = Liquid(init_opts=opts.InitOpts(theme='dark', width='1000px', height='800px'))
l2.add("获得金牌",
        [gold_athlete/total_athlete],
        center=["25%", "50%"],
        label_opts=opts.LabelOpts(font_size=50,
            formatter=JsCode(
                """function (param) {
                        return (Math.floor(param.value * 10000) / 100) + '%';
                    }"""),
            position="inside",
        ),)
l2.set_global_opts(title_opts=opts.TitleOpts(title="获得过金牌比例", pos_left='17%', pos_top='8%'))
l2.set_series_opts(tooltip_opts=opts.TooltipOpts(is_show=False))


grid = Grid().add(l1, grid_opts=opts.GridOpts()).add(l2, grid_opts=opts.GridOpts())
grid.render_notebook()

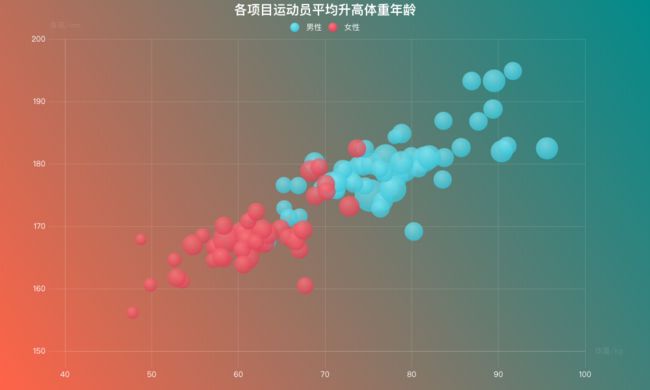
运动员平均体质数据
根据不同的运动项目进行统计
运动员平均身高最高的项目是篮球,女子平均身高达182cm,男子平均身高达到194cm;
在男子项目中,运动员平均体重最大的项目是拔河,平均体重达到96kg(拔河自第七届奥运会后已取消);
运动员平均年龄最大的项目是Art competition(自行百度这奇怪的项目),平均年龄46岁,除此之外便是马术和射击,男子平均年龄分别为34.4岁和34.2岁,女子平均年龄34.22岁和29.12s岁;
tool_js = """function (param) {return param.data[2] +'
'
            +'平均体重: '+Number(param.data[0]).toFixed(2)+' kg
'
            +'平均身高: '+Number(param.data[1]).toFixed(2)+' cm
'
            +'平均年龄: '+Number(param.data[3]).toFixed(2);}"""

background_color_js = (
    "new echarts.graphic.LinearGradient(1, 0, 0, 1, "
    "[{offset: 0, color: '#008B8B'}, {offset: 1, color: '#FF6347'}], false)"
)


temp_data = data[data['Sex']=='M'].groupby(['Sport'])['Age', 'Height', 'Weight'].mean().reset_index().dropna(how='any')

scatter = (Scatter(init_opts=opts.InitOpts(bg_color=JsCode(background_color_js), width='1000px', height='600px'))
           .add_xaxis(temp_data['Weight'].tolist())
           .add_yaxis("男性", [[row['Height'], row['Sport'], row['Age']] for _, row in temp_data.iterrows()],
                      # 渐变效果实现部分
                      color=JsCode("""new echarts.graphic.RadialGradient(0.4, 0.3, 1, [{
                                        offset: 0,
                                        color: 'rgb(129, 227, 238)'
                                    }, {
                                        offset: 1,
                                        color: 'rgb(25, 183, 207)'
                                    }])"""))
           .set_series_opts(label_opts=opts.LabelOpts(is_show=False))
           .set_global_opts(
               title_opts=opts.TitleOpts(title="各项目运动员平均升高体重年龄",pos_left="center",
                                         title_textstyle_opts=opts.TextStyleOpts(color="white", font_size=20)),
               legend_opts=opts.LegendOpts(is_show=True, pos_top='5%',
                                           textstyle_opts=opts.TextStyleOpts(color="white", font_size=12)),
               tooltip_opts = opts.TooltipOpts(formatter=JsCode(tool_js)),
               xaxis_opts=opts.AxisOpts(
                   name='体重/kg',
                   # 设置坐标轴为数值类型
                   type_="value",
                   is_scale=True,
                   # 显示分割线
                   axislabel_opts=opts.LabelOpts(margin=30, color="white"),
                   axisline_opts=opts.AxisLineOpts(is_show=True, linestyle_opts=opts.LineStyleOpts(color="#ffffff1f")),
                   axistick_opts=opts.AxisTickOpts(is_show=True, length=25,
                                                   linestyle_opts=opts.LineStyleOpts(color="#ffffff1f")),
                   splitline_opts=opts.SplitLineOpts(is_show=True, linestyle_opts=opts.LineStyleOpts(color="#ffffff1f")
                                                )),
               yaxis_opts=opts.AxisOpts(
                   name='身高/cm',
                   # 设置坐标轴为数值类型
                   type_="value",
                   # 默认为False表示起始为0
                   is_scale=True,
                   axislabel_opts=opts.LabelOpts(margin=30, color="white"),
                   axisline_opts=opts.AxisLineOpts(is_show=True, linestyle_opts=opts.LineStyleOpts(color="#ffffff1f")),
                   axistick_opts=opts.AxisTickOpts(is_show=True, length=25,
                                                   linestyle_opts=opts.LineStyleOpts(color="#ffffff1f")),
                   splitline_opts=opts.SplitLineOpts(is_show=True, linestyle_opts=opts.LineStyleOpts(color="#ffffff1f")
                                                )),
               visualmap_opts=opts.VisualMapOpts(is_show=False, type_='size', range_size=[5,50], min_=10, max_=40)
    ))

temp_data = data[data['Sex']=='F'].groupby(['Sport'])['Age', 'Height', 'Weight'].mean().reset_index().dropna(how='any')

scatter1 = (Scatter()
           .add_xaxis(temp_data['Weight'].tolist())
           .add_yaxis("女性", [[row['Height'], row['Sport'], row['Age']] for _, row in temp_data.iterrows()],
                     itemstyle_opts=opts.ItemStyleOpts(
                         color=JsCode("""new echarts.graphic.RadialGradient(0.4, 0.3, 1, [{
                                        offset: 0,
                                        color: 'rgb(251, 118, 123)'
                                    }, {
                                        offset: 1,
                                        color: 'rgb(204, 46, 72)'
                                    }])""")))
           .set_series_opts(label_opts=opts.LabelOpts(is_show=False))
        )
scatter.overlap(scatter1)
scatter.render_notebook()
中国奥运会表现
CN_data = data[data.region=='China']
CN_data.head()
历届奥运会参赛人数
background_color_js = (
    "new echarts.graphic.LinearGradient(1, 0, 0, 1, "
    "[{offset: 0, color: '#008B8B'}, {offset: 1, color: '#FF6347'}], false)"
)


athlete = CN_data.groupby(['Year', 'Season'])['Name'].nunique().reset_index()
athlete.columns = ['Year', 'Season', 'Nums']
athlete = athlete.sort_values(by="Year" , ascending=False)


s_bar = (
        Bar(init_opts=opts.InitOpts(theme='dark', width='1000px', height='300px'))
        .add_xaxis([row['Year'] for _, row in athlete[athlete.Season=='Summer'].iterrows()])
        .add_yaxis("参赛人数", [row['Nums'] for _, row in athlete[athlete.Season=='Summer'].iterrows()],
                  category_gap='40%',
                  itemstyle_opts=opts.ItemStyleOpts(
                                border_color='rgb(220,220,220)',
                                color=JsCode("""new echarts.graphic.LinearGradient(0, 0, 0, 1,
                                             [{
                                                 offset: 1,
                                                 color: '#00BFFF'
                                             }, {
                                                 offset: 0,
                                                 color: '#32CD32'
                                             }])""")))
        .set_series_opts(label_opts=opts.LabelOpts(is_show=True,
                                                position='top',
                                                font_style='italic'))
        .set_global_opts(
            title_opts=opts.TitleOpts(title="中国历年奥运会参赛人数-夏奥会", pos_left='center'),
            xaxis_opts=opts.AxisOpts(axislabel_opts=opts.LabelOpts(rotate=45)),
            legend_opts=opts.LegendOpts(is_show=False),
            yaxis_opts=opts.AxisOpts(axislabel_opts=opts.LabelOpts(margin=20, color="#ffffff63")),
            graphic_opts=[
            opts.GraphicImage(
                graphic_item=opts.GraphicItem(
                    id_="logo", right=0, top=0, z=-10, bounding="raw", origin=[75, 75]
                ),
                graphic_imagestyle_opts=opts.GraphicImageStyleOpts(
                    image="https://timgsa.baidu.com/timg?image&quality=80&size=b9999_10000&sec=1586619952245&di=981a36305048f93eec791980acc99cf7&imgtype=0&src=http%3A%2F%2Fimg5.mtime.cn%2Fmg%2F2017%2F01%2F06%2F172210.42721559.jpg",
                    width=1000,
                    height=600,
                    opacity=0.6,),
            )
        ],)
        )


w_bar = (
        Bar(init_opts=opts.InitOpts(theme='dark',width='1000px', height='300px'))
        .add_xaxis([row['Year'] for _, row in athlete[athlete.Season=='Winter'].iterrows()])
        .add_yaxis("参赛人数", [row['Nums'] for _, row in athlete[athlete.Season=='Winter'].iterrows()],
                  category_gap='50%',
                  itemstyle_opts=opts.ItemStyleOpts(
                                border_color='rgb(220,220,220)',
                                color=JsCode("""new echarts.graphic.LinearGradient(0, 0, 0, 1,
                                             [{
                                                 offset: 1,
                                                 color: '#00BFFF'
                                             }, {
                                                 offset: 0.8,
                                                 color: '#FFC0CB'
                                             }, {
                                                 offset: 0,
                                                 color: '#40E0D0'
                                             }])""")))
        .set_series_opts(label_opts=opts.LabelOpts(is_show=True,
                                                position='top',
                                                font_style='italic'))
        .set_global_opts(
            title_opts=opts.TitleOpts(title="中国历年奥运会参赛人数-冬奥会", pos_left='center'),
            xaxis_opts=opts.AxisOpts(axislabel_opts=opts.LabelOpts(rotate=45)),
            legend_opts=opts.LegendOpts(is_show=False),
            yaxis_opts=opts.AxisOpts(axislabel_opts=opts.LabelOpts(margin=20, color="#ffffff63")),
            graphic_opts=[
            opts.GraphicImage(
                graphic_item=opts.GraphicItem(
                    id_="logo", right=0, top=-300, z=-10, bounding="raw", origin=[75, 75]
                ),
                graphic_imagestyle_opts=opts.GraphicImageStyleOpts(
                    image="https://timgsa.baidu.com/timg?image&quality=80&size=b9999_10000&sec=1586619952245&di=981a36305048f93eec791980acc99cf7&imgtype=0&src=http%3A%2F%2Fimg5.mtime.cn%2Fmg%2F2017%2F01%2F06%2F172210.42721559.jpg",
                    width=1000,
                    height=600,
                    opacity=0.6,),
            )
        ],)
        )


page = (
    Page()
    .add(s_bar,)
    .add(w_bar,)
)
page.render_notebook()
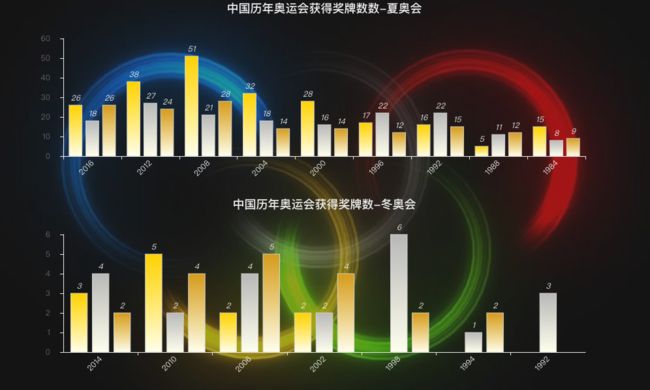
历届奥运会奖牌数
background_color_js = (
    "new echarts.graphic.LinearGradient(1, 0, 0, 1, "
    "[{offset: 0, color: '#008B8B'}, {offset: 1, color: '#FF6347'}], false)"
)


CN_medals = CN_data.groupby(['Year', 'Season', 'Medal'])['Event'].nunique().reset_index()
CN_medals.columns = ['Year', 'Season', 'Medal', 'Nums']
CN_medals = CN_medals.sort_values(by="Year" , ascending=False)


s_bar = (
        Bar(init_opts=opts.InitOpts(theme='dark', width='1000px', height='300px'))
        .add_xaxis(sorted(list(set([row['Year'] for _, row in CN_medals[CN_medals.Season=='Summer'].iterrows()])), reverse=True))
        .add_yaxis("金牌", [row['Nums'] for _, row in CN_medals[(CN_medals.Season=='Summer') & (CN_medals.Medal=='Gold')].iterrows()],
                  category_gap='20%',
                  itemstyle_opts=opts.ItemStyleOpts(
                                border_color='rgb(220,220,220)',
                                color=JsCode("""new echarts.graphic.LinearGradient(0, 0, 0, 1,
                                             [{
                                                 offset: 0,
                                                 color: '#FFD700'
                                             }, {
                                                 offset: 1,
                                                 color: '#FFFFF0'
                                             }])""")))
        .add_yaxis("银牌", [row['Nums'] for _, row in CN_medals[(CN_medals.Season=='Summer') & (CN_medals.Medal=='Silver')].iterrows()],
                  category_gap='20%',
                  itemstyle_opts=opts.ItemStyleOpts(
                                border_color='rgb(220,220,220)',
                                color=JsCode("""new echarts.graphic.LinearGradient(0, 0, 0, 1,
                                             [{
                                                 offset: 0,
                                                 color: '#C0C0C0'
                                             }, {
                                                 offset: 1,
                                                 color: '#FFFFF0'
                                             }])""")))
        .add_yaxis("铜牌", [row['Nums'] for _, row in CN_medals[(CN_medals.Season=='Summer') & (CN_medals.Medal=='Bronze')].iterrows()],
                  category_gap='20%',
                  itemstyle_opts=opts.ItemStyleOpts(
                                border_color='rgb(220,220,220)',
                                color=JsCode("""new echarts.graphic.LinearGradient(0, 0, 0, 1,
                                             [{
                                                 offset: 0,
                                                 color: '#DAA520'
                                             }, {
                                                 offset: 1,
                                                 color: '#FFFFF0'
                                             }])""")))
        .set_series_opts(label_opts=opts.LabelOpts(is_show=True,
                                                position='top',
                                                font_style='italic'))
        .set_global_opts(
            title_opts=opts.TitleOpts(title="中国历年奥运会获得奖牌数数-夏奥会", pos_left='center'),
            xaxis_opts=opts.AxisOpts(axislabel_opts=opts.LabelOpts(rotate=45)),
            legend_opts=opts.LegendOpts(is_show=False),
            yaxis_opts=opts.AxisOpts(axislabel_opts=opts.LabelOpts(margin=20, color="#ffffff63")),
            graphic_opts=[
            opts.GraphicImage(
                graphic_item=opts.GraphicItem(
                    id_="logo", right=0, top=0, z=-10, bounding="raw", origin=[75, 75]
                ),
                graphic_imagestyle_opts=opts.GraphicImageStyleOpts(
                    image="https://timgsa.baidu.com/timg?image&quality=80&size=b9999_10000&sec=1586619952245&di=981a36305048f93eec791980acc99cf7&imgtype=0&src=http%3A%2F%2Fimg5.mtime.cn%2Fmg%2F2017%2F01%2F06%2F172210.42721559.jpg",
                    width=1000,
                    height=600,
                    opacity=0.6,),
            )
        ],)
        )


w_bar = (
        Bar(init_opts=opts.InitOpts(theme='dark', width='1000px', height='300px'))
        .add_xaxis(sorted(list(set([row['Year'] for _, row in CN_medals[CN_medals.Season=='Winter'].iterrows()])), reverse=True))
        .add_yaxis("金牌", [row['Nums'] for _, row in CN_medals[(CN_medals.Season=='Winter') & (CN_medals.Medal=='Gold')].iterrows()],
                  category_gap='20%',
                  itemstyle_opts=opts.ItemStyleOpts(
                                border_color='rgb(220,220,220)',
                                color=JsCode("""new echarts.graphic.LinearGradient(0, 0, 0, 1,
                                             [{
                                                 offset: 0,
                                                 color: '#FFD700'
                                             }, {
                                                 offset: 1,
                                                 color: '#FFFFF0'
                                             }])""")))
        .add_yaxis("银牌", [row['Nums'] for _, row in CN_medals[(CN_medals.Season=='Winter') & (CN_medals.Medal=='Silver')].iterrows()],
                  category_gap='20%',
                  itemstyle_opts=opts.ItemStyleOpts(
                                border_color='rgb(220,220,220)',
                                color=JsCode("""new echarts.graphic.LinearGradient(0, 0, 0, 1,
                                             [{
                                                 offset: 0,
                                                 color: '#C0C0C0'
                                             }, {
                                                 offset: 1,
                                                 color: '#FFFFF0'
                                             }])""")))
        .add_yaxis("铜牌", [row['Nums'] for _, row in CN_medals[(CN_medals.Season=='Winter') & (CN_medals.Medal=='Bronze')].iterrows()],
                  category_gap='20%',
                  itemstyle_opts=opts.ItemStyleOpts(
                                border_color='rgb(220,220,220)',
                                color=JsCode("""new echarts.graphic.LinearGradient(0, 0, 0, 1,
                                             [{
                                                 offset: 0,
                                                 color: '#DAA520'
                                             }, {
                                                 offset: 1,
                                                 color: '#FFFFF0'
                                             }])""")))
        .set_series_opts(label_opts=opts.LabelOpts(is_show=True,
                                                position='top',
                                                font_style='italic'))
        .set_global_opts(
            title_opts=opts.TitleOpts(title="中国历年奥运会获得奖牌数-冬奥会", pos_left='center'),
            xaxis_opts=opts.AxisOpts(axislabel_opts=opts.LabelOpts(rotate=45)),
            legend_opts=opts.LegendOpts(is_show=False),
            yaxis_opts=opts.AxisOpts(axislabel_opts=opts.LabelOpts(margin=20, color="#ffffff63")),
            graphic_opts=[
            opts.GraphicImage(
                graphic_item=opts.GraphicItem(
                    id_="logo", right=0, top=-300, z=-10, bounding="raw", origin=[75, 75]
                ),
                graphic_imagestyle_opts=opts.GraphicImageStyleOpts(
                    image="https://timgsa.baidu.com/timg?image&quality=80&size=b9999_10000&sec=1586619952245&di=981a36305048f93eec791980acc99cf7&imgtype=0&src=http%3A%2F%2Fimg5.mtime.cn%2Fmg%2F2017%2F01%2F06%2F172210.42721559.jpg",
                    width=1000,
                    height=600,
                    opacity=0.6,),
            )
        ],)
        )


page = (
    Page()
    .add(s_bar,)
    .add(w_bar,)
)
page.render_notebook()
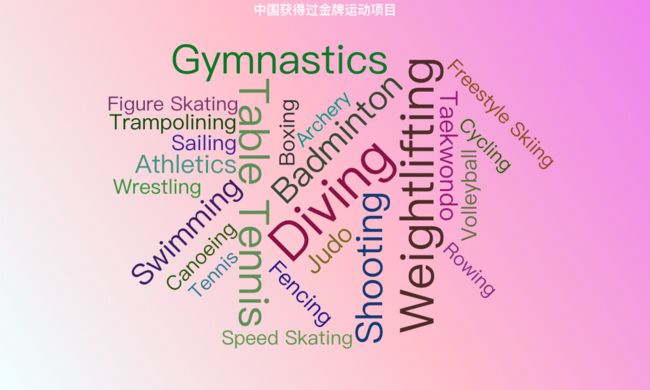
优势项目
跳水,体操,射击,举重,乒乓球,羽毛球
background_color_js = (
    "new echarts.graphic.LinearGradient(1, 0, 0, 1, "
    "[{offset: 0.5, color: '#FFC0CB'}, {offset: 1, color: '#F0FFFF'}, {offset: 0, color: '#EE82EE'}], false)"
)


CN_events = CN_data[CN_data.Medal=='Gold'].groupby(['Year', 'Sport'])['Event'].nunique().reset_index()
CN_events = CN_events.groupby(['Sport'])['Event'].sum().reset_index()
CN_events.columns = ['Sport', 'Nums']

data_pair = [(row['Sport'], row['Nums']) for _, row in CN_events.iterrows()]

wc = (WordCloud(init_opts=opts.InitOpts(bg_color=JsCode(background_color_js), width='1000px', height='600px'))
     .add("", data_pair,word_size_range=[30, 80])
     .set_global_opts(title_opts=opts.TitleOpts(title="中国获得过金牌运动项目",pos_left="center",
                                         title_textstyle_opts=opts.TextStyleOpts(color="white", font_size=20)))
)

wc.render_notebook()
美国奥运会表现
USA_data = data[data.region=='USA']
USA_data.head()
历届奥运会参加人数
background_color_js = (
    "new echarts.graphic.LinearGradient(1, 0, 0, 1, "
    "[{offset: 0, color: '#008B8B'}, {offset: 1, color: '#FF6347'}], false)"
)


athlete = USA_data.groupby(['Year', 'Season'])['Name'].nunique().reset_index()
athlete.columns = ['Year', 'Season', 'Nums']
athlete = athlete.sort_values(by="Year" , ascending=False)


s_bar = (
        Bar(init_opts=opts.InitOpts(theme='dark', width='1000px', height='300px'))
        .add_xaxis([row['Year'] for _, row in athlete[athlete.Season=='Summer'].iterrows()])
        .add_yaxis("参赛人数", [row['Nums'] for _, row in athlete[athlete.Season=='Summer'].iterrows()],
                  category_gap='40%',
                  itemstyle_opts=opts.ItemStyleOpts(
                                border_color='rgb(220,220,220)',
                                color=JsCode("""new echarts.graphic.LinearGradient(0, 0, 0, 1,
                                             [{
                                                 offset: 1,
                                                 color: '#00BFFF'
                                             }, {
                                                 offset: 0,
                                                 color: '#32CD32'
                                             }])""")))
        .set_series_opts(label_opts=opts.LabelOpts(is_show=True,
                                                position='top',
                                                font_style='italic'))
        .set_global_opts(
            title_opts=opts.TitleOpts(title="美国历年奥运会参赛人数-夏奥会", pos_left='center'),
            xaxis_opts=opts.AxisOpts(axislabel_opts=opts.LabelOpts(rotate=45)),
            legend_opts=opts.LegendOpts(is_show=False),
            yaxis_opts=opts.AxisOpts(axislabel_opts=opts.LabelOpts(margin=20, color="#ffffff63")),
            graphic_opts=[
            opts.GraphicImage(
                graphic_item=opts.GraphicItem(
                    id_="logo", right=0, top=0, z=-10, bounding="raw", origin=[75, 75]
                ),
                graphic_imagestyle_opts=opts.GraphicImageStyleOpts(
                    image="https://timgsa.baidu.com/timg?image&quality=80&size=b9999_10000&sec=1586619952245&di=981a36305048f93eec791980acc99cf7&imgtype=0&src=http%3A%2F%2Fimg5.mtime.cn%2Fmg%2F2017%2F01%2F06%2F172210.42721559.jpg",
                    width=1000,
                    height=600,
                    opacity=0.6,),
            )
        ],)
        )


w_bar = (
        Bar(init_opts=opts.InitOpts(theme='dark',width='1000px', height='300px'))
        .add_xaxis([row['Year'] for _, row in athlete[athlete.Season=='Winter'].iterrows()])
        .add_yaxis("参赛人数", [row['Nums'] for _, row in athlete[athlete.Season=='Winter'].iterrows()],
                  category_gap='50%',
                  itemstyle_opts=opts.ItemStyleOpts(
                                border_color='rgb(220,220,220)',
                                color=JsCode("""new echarts.graphic.LinearGradient(0, 0, 0, 1,
                                             [{
                                                 offset: 1,
                                                 color: '#00BFFF'
                                             }, {
                                                 offset: 0.8,
                                                 color: '#FFC0CB'
                                             }, {
                                                 offset: 0,
                                                 color: '#40E0D0'
                                             }])""")))
        .set_series_opts(label_opts=opts.LabelOpts(is_show=True,
                                                position='top',
                                                font_style='italic'))
        .set_global_opts(
            title_opts=opts.TitleOpts(title="美国历年奥运会参赛人数-冬奥会", pos_left='center'),
            xaxis_opts=opts.AxisOpts(axislabel_opts=opts.LabelOpts(rotate=45)),
            legend_opts=opts.LegendOpts(is_show=False),
            yaxis_opts=opts.AxisOpts(axislabel_opts=opts.LabelOpts(margin=20, color="#ffffff63")),
            graphic_opts=[
            opts.GraphicImage(
                graphic_item=opts.GraphicItem(
                    id_="logo", right=0, top=-300, z=-10, bounding="raw", origin=[75, 75]
                ),
                graphic_imagestyle_opts=opts.GraphicImageStyleOpts(
                    image="https://timgsa.baidu.com/timg?image&quality=80&size=b9999_10000&sec=1586619952245&di=981a36305048f93eec791980acc99cf7&imgtype=0&src=http%3A%2F%2Fimg5.mtime.cn%2Fmg%2F2017%2F01%2F06%2F172210.42721559.jpg",
                    width=1000,
                    height=600,
                    opacity=0.6,),
            )
        ],)
        )


page = (
    Page()
    .add(s_bar,)
    .add(w_bar,)
)
page.render_notebook()
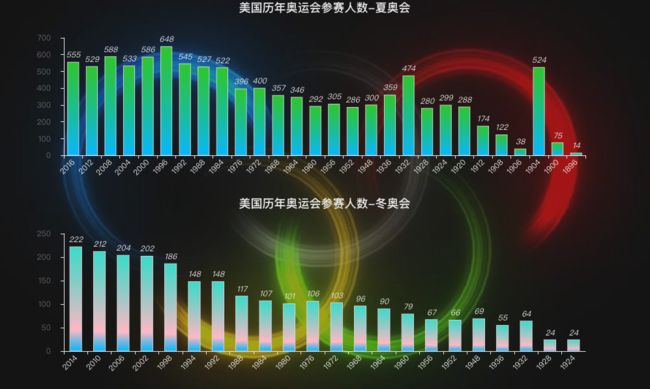
历届奥运会获得奖牌数
background_color_js = (
    "new echarts.graphic.LinearGradient(1, 0, 0, 1, "
    "[{offset: 0, color: '#008B8B'}, {offset: 1, color: '#FF6347'}], false)"
)


medals = USA_data.groupby(['Year', 'Season', 'Medal'])['Event'].nunique().reset_index()
medals.columns = ['Year', 'Season', 'Medal', 'Nums']
medals = medals.sort_values(by="Year" , ascending=False)


s_bar = (
        Bar(init_opts=opts.InitOpts(theme='dark', width='1000px', height='300px'))
        .add_xaxis(sorted(list(set([row['Year'] for _, row in medals[medals.Season=='Summer'].iterrows()])), reverse=True))
        .add_yaxis("金牌", [row['Nums'] for _, row in medals[(medals.Season=='Summer') & (medals.Medal=='Gold')].iterrows()],
                  category_gap='20%',
                  itemstyle_opts=opts.ItemStyleOpts(
                                border_color='rgb(220,220,220)',
                                color=JsCode("""new echarts.graphic.LinearGradient(0, 0, 0, 1,
                                             [{
                                                 offset: 0,
                                                 color: '#FFD700'
                                             }, {
                                                 offset: 1,
                                                 color: '#FFFFF0'
                                             }])""")))
        .add_yaxis("银牌", [row['Nums'] for _, row in medals[(medals.Season=='Summer') & (medals.Medal=='Silver')].iterrows()],
                  category_gap='20%',
                  itemstyle_opts=opts.ItemStyleOpts(
                                border_color='rgb(220,220,220)',
                                color=JsCode("""new echarts.graphic.LinearGradient(0, 0, 0, 1,
                                             [{
                                                 offset: 0,
                                                 color: '#C0C0C0'
                                             }, {
                                                 offset: 1,
                                                 color: '#FFFFF0'
                                             }])""")))
        .add_yaxis("铜牌", [row['Nums'] for _, row in medals[(medals.Season=='Summer') & (medals.Medal=='Bronze')].iterrows()],
                  category_gap='20%',
                  itemstyle_opts=opts.ItemStyleOpts(
                                border_color='rgb(220,220,220)',
                                color=JsCode("""new echarts.graphic.LinearGradient(0, 0, 0, 1,
                                             [{
                                                 offset: 0,
                                                 color: '#DAA520'
                                             }, {
                                                 offset: 1,
                                                 color: '#FFFFF0'
                                             }])""")))
        .set_series_opts(label_opts=opts.LabelOpts(is_show=True,
                                                position='top',
                                                font_style='italic'))
        .set_global_opts(
            title_opts=opts.TitleOpts(title="美国历年奥运会获得奖牌数数-夏奥会", pos_left='center'),
            xaxis_opts=opts.AxisOpts(axislabel_opts=opts.LabelOpts(rotate=45)),
            legend_opts=opts.LegendOpts(is_show=False),
            yaxis_opts=opts.AxisOpts(axislabel_opts=opts.LabelOpts(margin=20, color="#ffffff63")),
            graphic_opts=[
            opts.GraphicImage(
                graphic_item=opts.GraphicItem(
                    id_="logo", right=0, top=0, z=-10, bounding="raw", origin=[75, 75]
                ),
                graphic_imagestyle_opts=opts.GraphicImageStyleOpts(
                    image="https://timgsa.baidu.com/timg?image&quality=80&size=b9999_10000&sec=1586619952245&di=981a36305048f93eec791980acc99cf7&imgtype=0&src=http%3A%2F%2Fimg5.mtime.cn%2Fmg%2F2017%2F01%2F06%2F172210.42721559.jpg",
                    width=1000,
                    height=600,
                    opacity=0.6,),
            )
        ],)
        )


w_bar = (
        Bar(init_opts=opts.InitOpts(theme='dark', width='1000px', height='300px'))
        .add_xaxis(sorted(list(set([row['Year'] for _, row in medals[medals.Season=='Winter'].iterrows()])), reverse=True))
        .add_yaxis("金牌", [row['Nums'] for _, row in medals[(medals.Season=='Winter') & (medals.Medal=='Gold')].iterrows()],
                  category_gap='20%',
                  itemstyle_opts=opts.ItemStyleOpts(
                                border_color='rgb(220,220,220)',
                                color=JsCode("""new echarts.graphic.LinearGradient(0, 0, 0, 1,
                                             [{
                                                 offset: 0,
                                                 color: '#FFD700'
                                             }, {
                                                 offset: 1,
                                                 color: '#FFFFF0'
                                             }])""")))
        .add_yaxis("银牌", [row['Nums'] for _, row in medals[(medals.Season=='Winter') & (medals.Medal=='Silver')].iterrows()],
                  category_gap='20%',
                  itemstyle_opts=opts.ItemStyleOpts(
                                border_color='rgb(220,220,220)',
                                color=JsCode("""new echarts.graphic.LinearGradient(0, 0, 0, 1,
                                             [{
                                                 offset: 0,
                                                 color: '#C0C0C0'
                                             }, {
                                                 offset: 1,
                                                 color: '#FFFFF0'
                                             }])""")))
        .add_yaxis("铜牌", [row['Nums'] for _, row in medals[(medals.Season=='Winter') & (medals.Medal=='Bronze')].iterrows()],
                  category_gap='20%',
                  itemstyle_opts=opts.ItemStyleOpts(
                                border_color='rgb(220,220,220)',
                                color=JsCode("""new echarts.graphic.LinearGradient(0, 0, 0, 1,
                                             [{
                                                 offset: 0,
                                                 color: '#DAA520'
                                             }, {
                                                 offset: 1,
                                                 color: '#FFFFF0'
                                             }])""")))
        .set_series_opts(label_opts=opts.LabelOpts(is_show=True,
                                                position='top',
                                                font_style='italic'))
        .set_global_opts(
            title_opts=opts.TitleOpts(title="美国历年奥运会获得奖牌数-冬奥会", pos_left='center'),
            xaxis_opts=opts.AxisOpts(axislabel_opts=opts.LabelOpts(rotate=45)),
            legend_opts=opts.LegendOpts(is_show=False),
            yaxis_opts=opts.AxisOpts(axislabel_opts=opts.LabelOpts(margin=20, color="#ffffff63")),
            graphic_opts=[
            opts.GraphicImage(
                graphic_item=opts.GraphicItem(
                    id_="logo", right=0, top=-300, z=-10, bounding="raw", origin=[75, 75]
                ),
                graphic_imagestyle_opts=opts.GraphicImageStyleOpts(
                    image="https://timgsa.baidu.com/timg?image&quality=80&size=b9999_10000&sec=1586619952245&di=981a36305048f93eec791980acc99cf7&imgtype=0&src=http%3A%2F%2Fimg5.mtime.cn%2Fmg%2F2017%2F01%2F06%2F172210.42721559.jpg",
                    width=1000,
                    height=600,
                    opacity=0.6,),
            )
        ],)
        )


page = (
    Page()
    .add(s_bar,)
    .add(w_bar,)
)
page.render_notebook()

优势项目
田径,游泳
background_color_js = (
    "new echarts.graphic.LinearGradient(1, 0, 0, 1, "
    "[{offset: 0.5, color: '#FFC0CB'}, {offset: 1, color: '#F0FFFF'}, {offset: 0, color: '#EE82EE'}], false)"
)


events = USA_data[USA_data.Medal=='Gold'].groupby(['Year', 'Sport'])['Event'].nunique().reset_index()
events = events.groupby(['Sport'])['Event'].sum().reset_index()
events.columns = ['Sport', 'Nums']

data_pair = [(row['Sport'], row['Nums']) for _, row in events.iterrows()]

wc = (WordCloud(init_opts=opts.InitOpts(bg_color=JsCode(background_color_js), width='1000px', height='600px'))
     .add("", data_pair,word_size_range=[30, 80])
     .set_global_opts(title_opts=opts.TitleOpts(title="美国获得过金牌运动项目",pos_left="center",
                                         title_textstyle_opts=opts.TextStyleOpts(color="white", font_size=20)))
)

wc.render_notebook()

被单个国家统治的奥运会项目
很多运动长期以来一直是被某个国家统治,譬如我们熟知的中国的乒乓球,美国的篮球;
此次筛选了近5届奥运会(2000年悉尼奥运会之后)上累计产生10枚金牌以上且存在单个国家「夺金率」超过50%的项目;
俄罗斯包揽了2000年以后花样游泳 & 艺术体操两个项目上所有的20枚金牌;
中国在乒乓球项目上获得了2000年之后10枚金牌中的9枚,丢失金牌的一次是在04年雅典奥运会男单项目上;
美国在篮球项目上同样获得了过去10枚金牌中的9枚,丢失金牌的一次同样在04年,男篮半决赛中输给了阿根廷,最终获得铜牌;
跳水项目上,中国获得了过去40枚金牌中的31枚,梦之队名不虚传;
射箭项目上,韩国获得了过去20枚金牌中的15枚;
羽毛球项目上,中国获得了过去25枚金牌中的17枚;
沙滩排球项目上,美国获得了过去10枚金牌中的5枚;
f1 = lambda x:max(x['Event']) / sum(x['Event'])
f2 = lambda x: x.sort_values('Event', ascending=False).head(1)

t_data = data[(data.Medal=='Gold') & (data.Year>=2000) &(data.Season=='Summer')].groupby(['Year', 'Sport', 'region'])['Event'].nunique().reset_index()
t_data = t_data.groupby(['Sport', 'region'])['Event'].sum().reset_index()
t1 = t_data.groupby(['Sport']).apply(f2).reset_index(drop=True)
t2 = t_data.groupby(['Sport'])['Event'].sum().reset_index()
t_data = pd.merge(t1, t2, on='Sport', how='inner')
t_data['gold_rate'] = t_data.Event_x/ t_data.Event_y
t_data = t_data.sort_values('gold_rate', ascending=False).reset_index(drop=True)

t_data = t_data[(t_data.gold_rate>=0.5) & (t_data.Event_y>=10)]


background_color_js = (
    "new echarts.graphic.LinearGradient(1, 0, 0, 1, "
    "[{offset: 0, color: '#008B8B'}, {offset: 1, color: '#FF6347'}], false)"
)

fn = """
    function(params) {
        if(params.name == '其他国家')
            return '\\n\\n\\n' + params.name + ' : ' + params.value ;
        return params.seriesName+ '\\n' + params.name + ' : ' + params.value;
    }
    """


def new_label_opts():
    return opts.LabelOpts(formatter=JsCode(fn), position="center")


pie = Pie(init_opts=opts.InitOpts(theme='dark', width='1000px', height='1000px'))
idx = 0

for _, row in t_data.iterrows():

    if idx % 2 == 0:
        x = 30
        y = int(idx/2) * 22 + 18
    else:
        x = 70
        y = int(idx/2) * 22 + 18
    idx += 1
    pos_x = str(x)+'%'
    pos_y = str(y)+'%'
    pie.add(
            row['Sport'],
            [[row['region'], row['Event_x']], ['其他国家', row['Event_y']-row['Event_x']]],
            center=[pos_x, pos_y],
            radius=[70, 100],
            label_opts=new_label_opts(),)

pie.set_global_opts(
        title_opts=opts.TitleOpts(title="被单个国家统治的项目",
                                  subtitle='统计周期:2000年悉尼奥运会起',
                                  pos_left="center",
                                  title_textstyle_opts=opts.TextStyleOpts(color="white", font_size=20)),
        legend_opts=opts.LegendOpts(is_show=False),
    )


pie.render_notebook()

欢迎点赞支持❤️