用ggplot2绘图的时候,数据太多,图形很乱,有时候想增强显示一部分图形。比如着重显示一部分点、线...,操作起来比较繁琐。所以就有了gghighlight包,困的时候给大家递一个枕头,哈哈!
创建数据集
d <- purrr::map_dfr(
  letters,
  ~ data.frame(
      idx = 1:400,
      value = cumsum(runif(400, -1, 1)),
      type = .,
      flag = sample(c(TRUE, FALSE), size = 400, replace = TRUE),
      stringsAsFactors = FALSE
    )
)
先画个基本图(眼花缭乱啊)
library(ggplot2)

ggplot(d) +
  geom_line(aes(idx, value, colour = type))
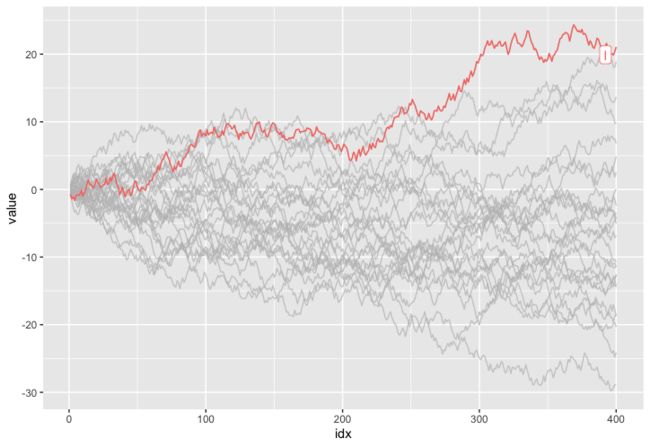
gghighlight包只显示最大值大于20的线
library(gghighlight)

ggplot(d) +
  geom_line(aes(idx, value, colour = type)) +
  gghighlight(max(value) > 20)
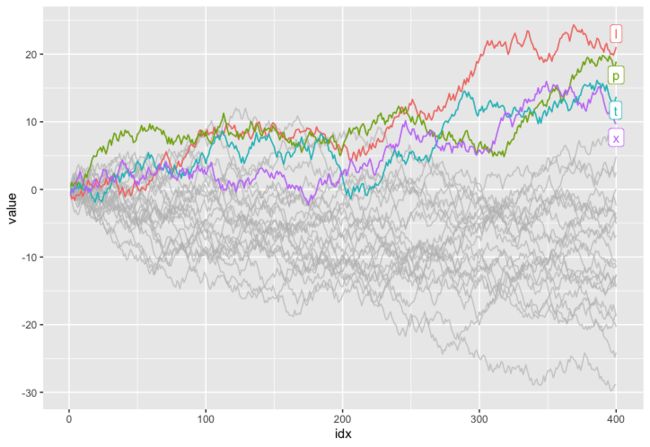
gghighlight包可以同时设定两个条件,比如value最大值和flag平均值
ggplot(d) +
  geom_line(aes(idx, value, colour = type)) +
  gghighlight(max(value) > 15, mean(flag) > 0.25)
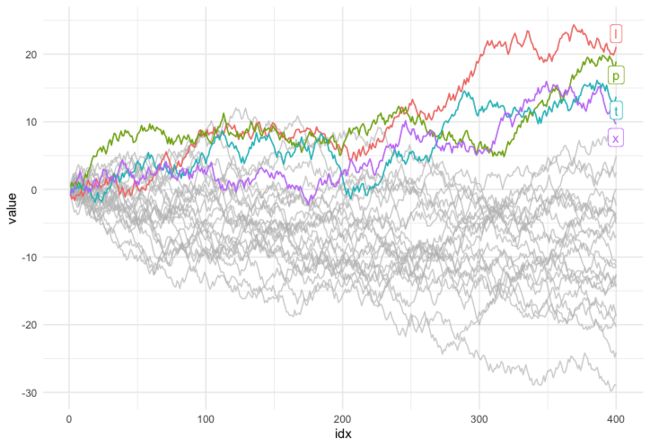
自定义一下图形
ggplot(d) +
  geom_line(aes(idx, value, colour = type)) +
  gghighlight(max(value) > 15, mean(flag) > 0.25) +
  theme_minimal()
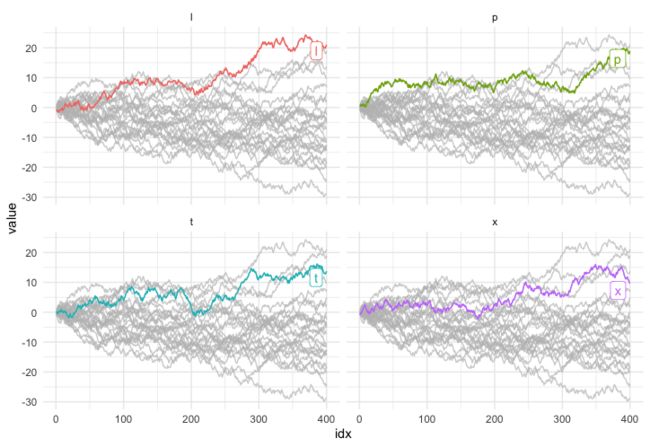
当然ggplot所有的功能都能用,比如分面
ggplot(d) +
    geom_line(aes(idx, value, colour = type)) +
    gghighlight(max(value) > 15,mean(flag)>0.25) +
    theme_minimal() +
    facet_wrap(~ type)
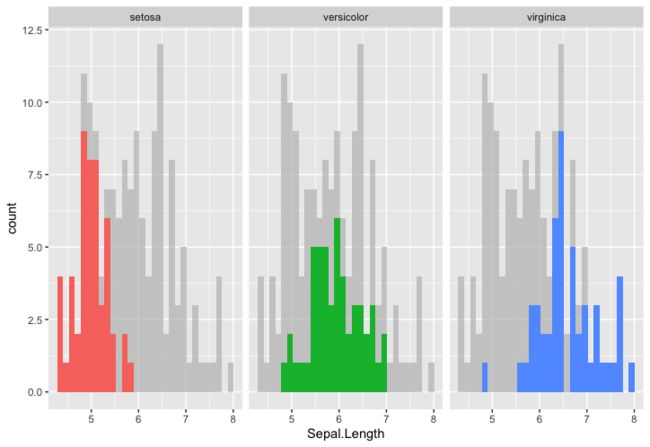
柱状图也不在话下
ggplot(iris, aes(Sepal.Length, fill = Species)) +
  geom_histogram() +
  gghighlight()+
  facet_wrap(~ Species)
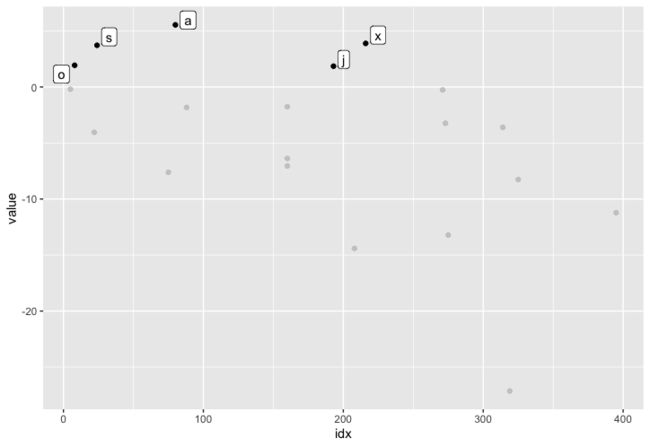
散点图
d2 <- dplyr::sample_n(d, 20)

ggplot(d2, aes(idx, value)) +
  geom_point() +
  gghighlight(value > 0, label_key = type)
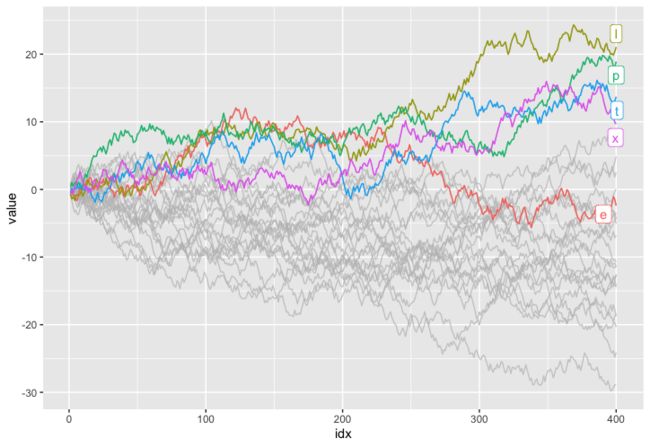
有时候不知道数值大小,只想突出显示排名前几的图形,也没有问题。下面突出显示前五条线。
ggplot(d, aes(idx, value, colour = type)) +
  geom_line() +
  gghighlight(max(value), max_highlight = 5L)
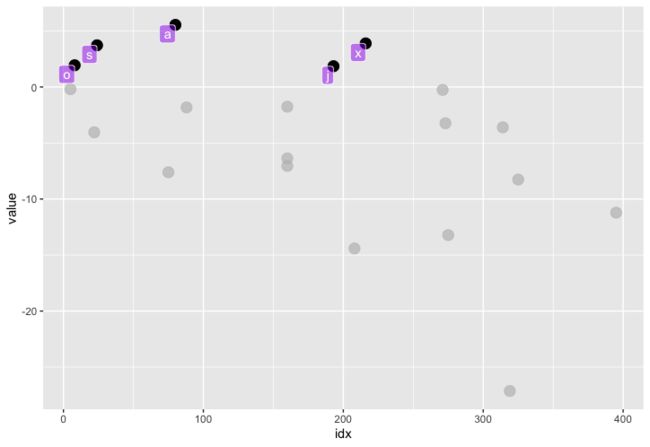
散点图手动添加标记(这个很有用)
p <- ggplot(d2, aes(idx, value)) +
  geom_point(size = 4) +
  gghighlight(value > 0, use_direct_label = FALSE)
p + geom_label(aes(label = type),
               hjust = 1, vjust = 1, fill = "purple", colour = "white", alpha= 0.5)
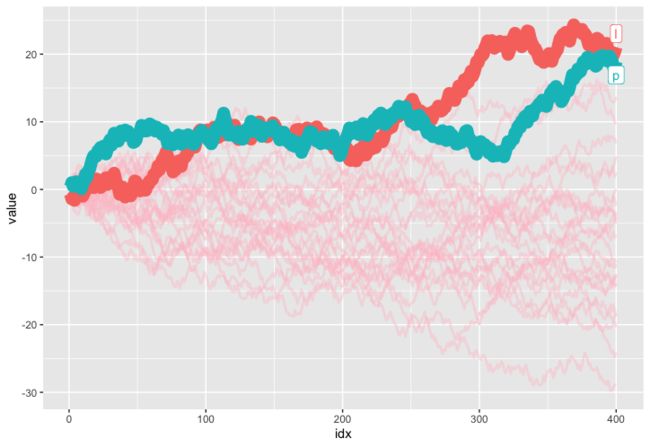
不突出的图形样式也可以修改
ggplot(d) +
  geom_line(aes(idx, value, colour = type), size = 5) +
  gghighlight(max(value) > 19,
              unhighlighted_params = list(size = 1, colour = alpha("pink", 0.4)))
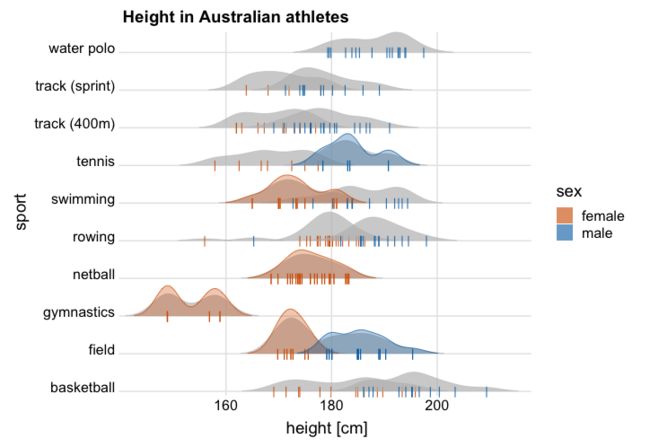
其它图形
library(ggplot2)
library(gghighlight)
library(ggridges)

p <- ggplot(Aus_athletes, aes(x = height, y = sport, color = sex, point_color = sex, fill = sex)) +
  geom_density_ridges(
    jittered_points = TRUE, scale = .95, rel_min_height = .01,
    point_shape = "|", point_size = 3, size = 0.25,
    position = position_points_jitter(height = 0)
  ) +
  scale_y_discrete(expand = c(0, 0)) +
  scale_x_continuous(expand = c(0, 0), name = "height [cm]") +
  scale_fill_manual(values = c("#D55E0050", "#0072B250"), labels = c("female", "male")) +
  scale_color_manual(values = c("#D55E00", "#0072B2"), guide = "none") +
  scale_discrete_manual("point_color", values = c("#D55E00", "#0072B2"), guide = "none") +
  coord_cartesian(clip = "off") +
  guides(fill = guide_legend(
    override.aes = list(
      fill = c("#D55E00A0", "#0072B2A0"),
      color = NA, point_color = NA)
    )
  ) +
  ggtitle("Height in Australian athletes") +
  theme_ridges(center = TRUE)

p +
  gghighlight(sd(height) < 5.5)
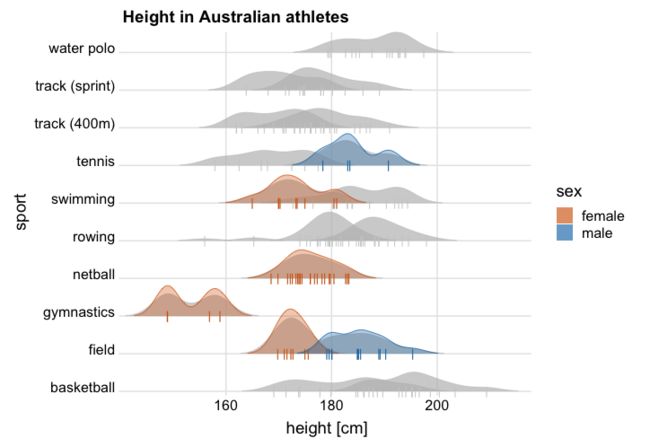
p +
  gghighlight(sd(height) < 5.5,
              unhighlighted_params = list(point_colour = "grey80"))

