开始
在流程图中我们需要通过拖拽交互往画布中添加节点,X6 不仅内置了强大的拖拽功能,还内置了很多常用的图形,接下来我们一起实现基础的流程图图形以及图形拖拽功能。
实现
图形定义
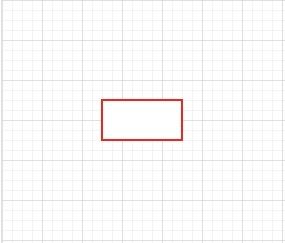
首先来看下一个简单的矩形节点的基础配置:
graph.addNode({
  shape: 'rect',
  x: 100,
  y: 100,
  width: 80,
  height: 40,
  attrs: {
    body: {
      stroke: 'red'
    }
  }
})
shape:定义图形的形状,X6 内置了 rect、circle、ellipse、polygon、polyline、image、html 等基础形状
x/y:定义图形的左上角坐标
width/height:定义图形的尺寸
看到 attrs 大家可能比较奇怪,这是什么东西?其实可以将 attrs 看做 css 样式集合,其中 body 类似于 css 选择器,body 的值是被选中元素的属性。那 body 又是哪来的呢?这里就要说的另一个重要的配置项markup,markup 表示的是图形的 DOM 结构,内置的 rect 的默认 markup 为:
[
  {
    tagName: 'rect',
    selector: 'body',
  },
  {
    tagName: 'text',
    selector: 'label',
  },
]
渲染完成后,实际生效的 DOM 为:
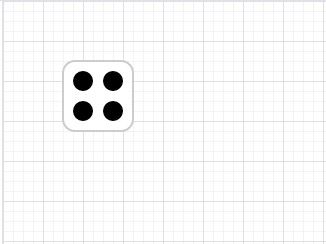
所以说一个图形是由 markup 和 attrs 来决定结构和样式,我们可以通过设置 markup 和 attrs 来定义自己业务中的图形,看下面的例子:
graph.addNode({
  shape: 'rect',
  x: 60,
  y: 60,
  width: 70,
  height: 70,
  markup: [
    {
      tagName: 'rect',
      selector: 'r1'
    },
    {
      tagName: 'circle',
      selector: 'c1'
    },
    {
      tagName: 'circle',
      selector: 'c2'
    },
    {
      tagName: 'circle',
      selector: 'c3'
    },
    {
      tagName: 'circle',
      selector: 'c4'
    }
  ],
  attrs: {
    r1: {
      width: 70,
      height: 70,
      stroke: '#ccc',
      rx: 12,
      ry: 12,
    },
    c1: {
      r: 10,
      cx: 20,
      cy: 20,
      fill: '#000'
    },
    c2: {
      r: 10,
      cx: 50,
      cy: 20,
      fill: '#000'
    },
    c3: {
      r: 10,
      cx: 20,
      cy: 50,
      fill: '#000'
    },
    c4: {
      r: 10,
      cx: 50,
      cy: 50,
      fill: '#000'
    },
  }
})
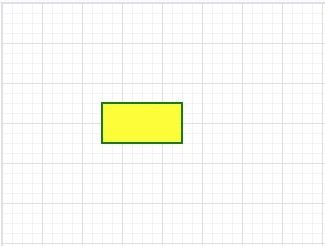
上面可以看到定义图形的时候,属性是固定写死的,在业务场景中,经常需要动态修改节点的样式,X6 中也提供了非常便利的方法:
const node = graph.addNode({
    shape: 'rect',
  x: 100,
  y: 100,
  width: 80,
  height: 40,
  attrs: {
    body: {
      stroke: 'red'
    }
  }
})
node.attr('body/stroke', 'green')
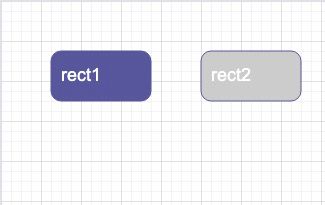
node.attr('body/fill', 'yellow')那么问题来了,如果多个图形的结构和样式相似度很高,每次定义图形都要写很多类似的代码,有没有一种方式可以将图形之间的公共属性抽象出来呢?X6 提供了很优雅的方式来解决这个问题,首先注册自定义的节点类型,在这里配置公共的属性,然后在添加节点的时候指定 shape 值为刚才注册的节点类型。
Graph.registerNode('custom-rect', {
  inherit: 'rect', // 继承自 Shape.Rect
  width: 300, // 默认宽度
  height: 40, // 默认高度
  attrs: {
    body: {
      rx: 10, // 圆角矩形
      ry: 10,
      strokeWidth: 1,
      fill: '#5755a1',
      stroke: '#5755a1',
    },
    label: {
      fill: '#fff',
      fontSize: 18,
      refX: 10, // x 轴偏移,类似 css 中的 margin-left
      textAnchor: 'left', // 左对齐
    }
  },
})

graph.addNode({
  shape: 'custom-rect',
  x: 50,
  y: 50,
  width: 100,
  height: 50,
  label: 'rect1'
})
graph.addNode({
  shape: 'custom-rect',
  x: 200,
  y: 50,
  width: 100,
  height: 50,
  label: 'rect2',
  attrs: {
    body: {
      fill: '#ccc'
    }
  }
})
图形拖拽
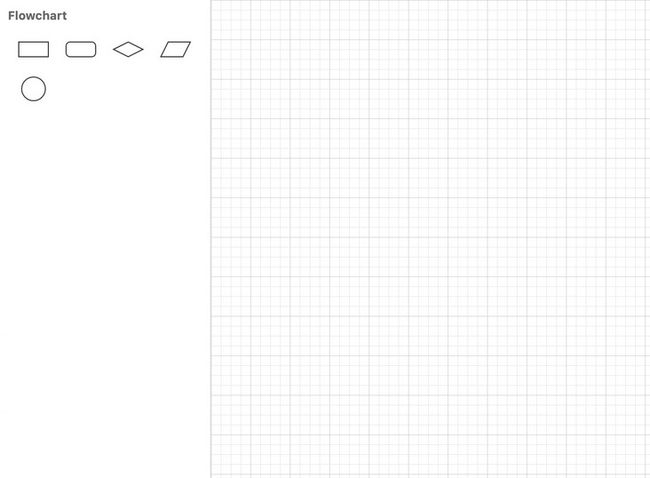
图形定义好了,接下来我们要实现图形拖拽功能,X6 提供了 Dnd 插件来提供基础的拖拽能力,并在 Dnd 基础上的进一步封装,提供了一个类似侧边栏的 UI 组件 Stencil,支持分组、折叠、搜索等能力。
首先提供一个 Stencil 的容器:
然后进行初始化(具体配置见官网):
const stencil = new Addon.Stencil({
  title: 'Flowchart',
  target: this.graph,
  stencilGraphWidth: 214,
  stencilGraphHeight: document.body.offsetHeight - 105,
  layoutOptions: {
    columns: 4,
    columnWidth: 48,
    rowHeight: 30,
    marginY: 30,
  },
})
const stencilContainer = document.querySelector('#stencil')
if (stencilContainer) {
  stencilContainer.appendChild(stencil.container)
}
然后将我们定义的图形加载到 stencil 中:
const r1 = graph.createNode({
  shape: 'rect',
  width: 30,
  height: 15,
})
stencil.load([r1])
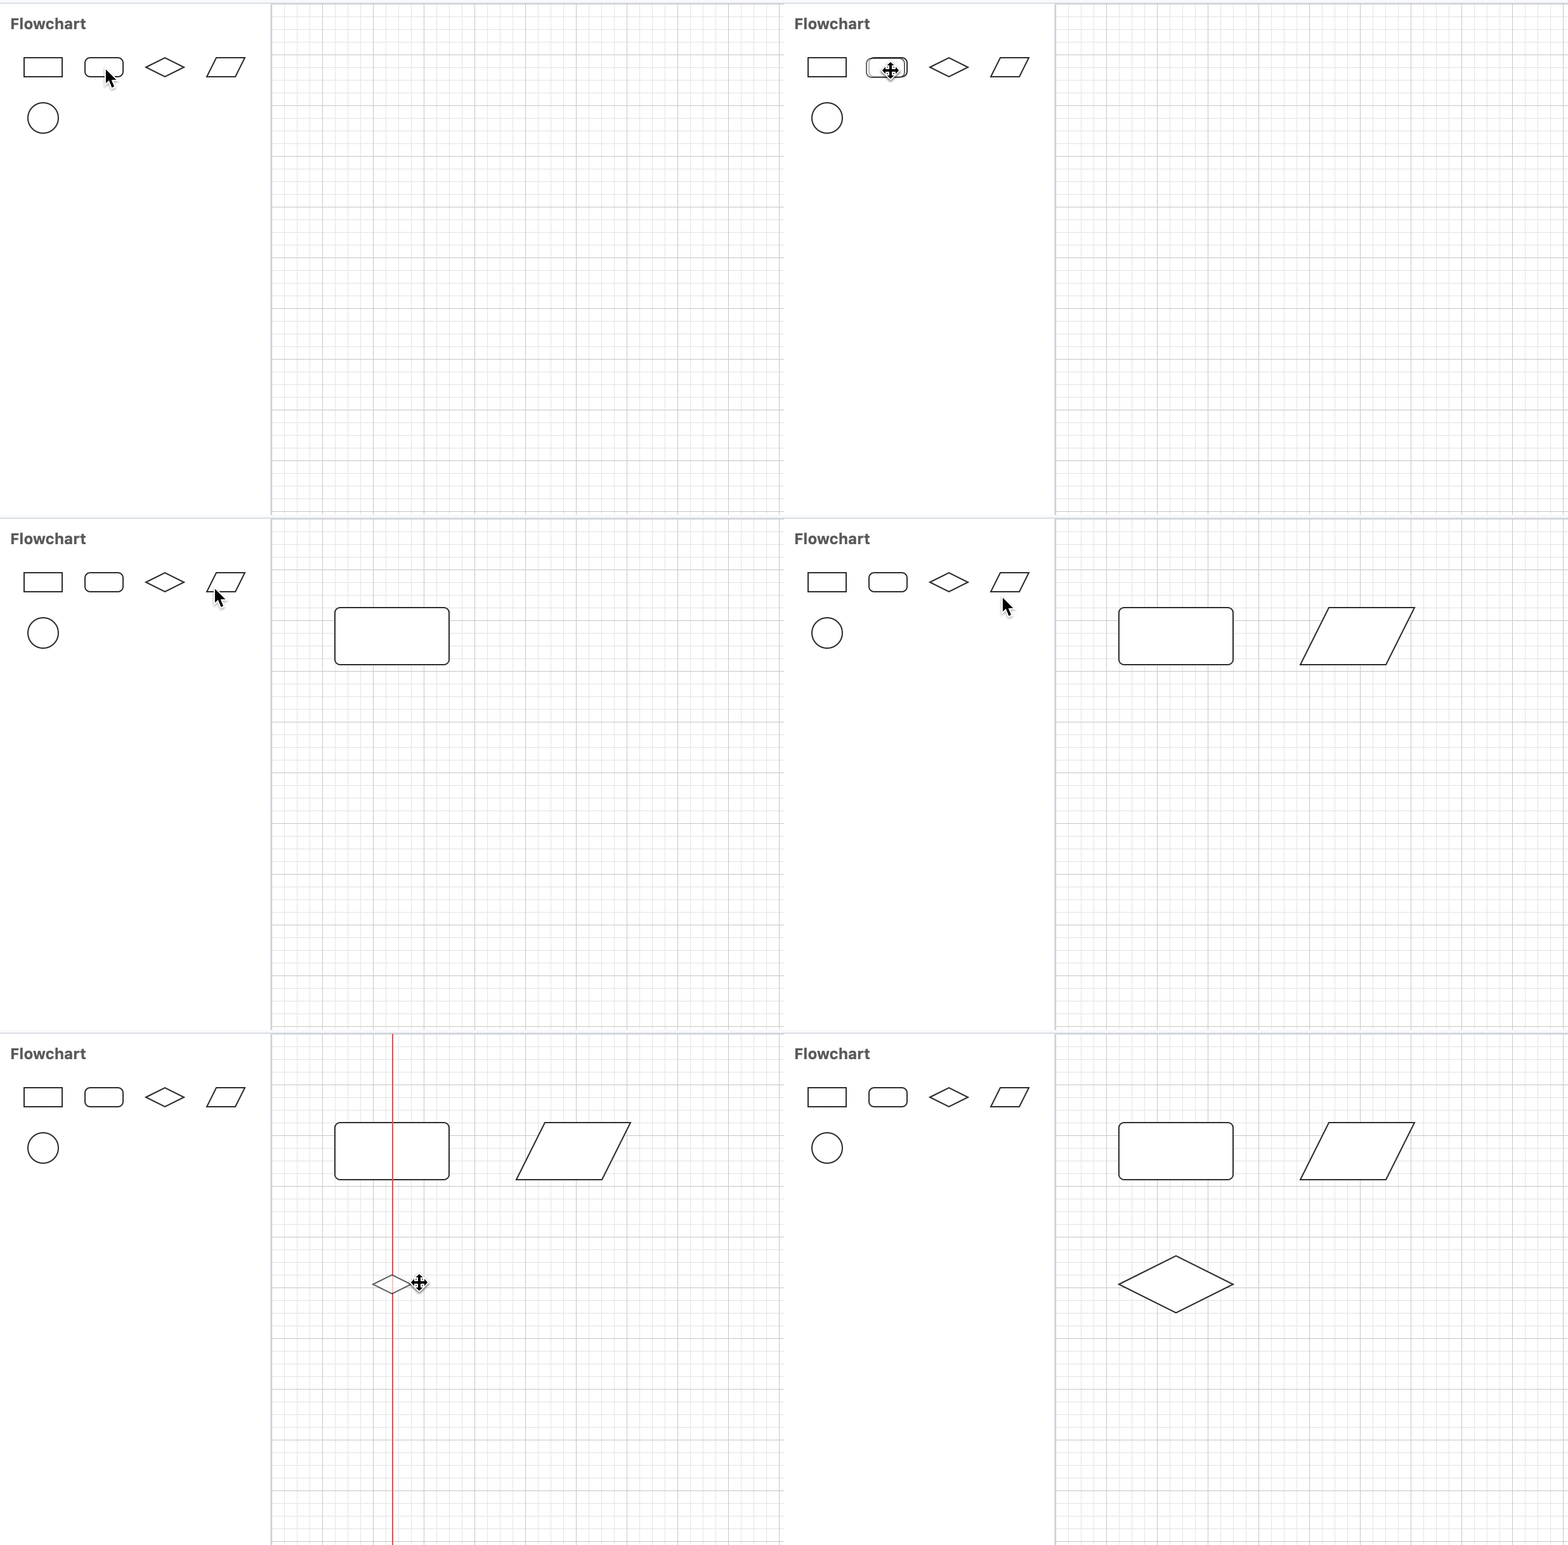
当我们将图形拖拽到画布的时候,想将 Stencil 中的图形等比例放大。查看官网,拖拽的流程为:
- 拖拽过程中可以在 getDragNode 中返回新的节点来自定义拖拽节点样式
- 拖拽结束可以在 getDropNode 中返回新的节点来自定义放置在画布中节点样式
下面的代码就是将拖拽节点等比例放大 3 倍后放置到画布中:
const stencil = new Addon.Stencil({
  getDropNode(node) {
    const size = node.size()
    return node.clone().size(size.width * 3, size.height * 3)
  }
})最后
X6 不仅支持上文提到的基础的 SVG 节点,还具备在节点中渲染 React、Vue 组件的能力。在实际业务场景中,如果对 SVG 不熟悉或者节点内容复杂,我们可以根据技术栈选择 React/Vue 渲染,这样在节点内部,我们可以用熟悉的方式绘制各种复杂的内容,可谓为所欲为。
