13. 富集气泡图绘制
清除当前环境中的变量
rm(list=ls())
设置工作目录
setwd("C:/Users/Dell/Desktop/R_Plots/13bubble/")
读取示例数据
data <- read.table("demo_bubble.tsv",header = T,
                   check.names = F,sep="\t")
head(data)
Pathway R0vsR3 All_Unigene      Pvalue   Qvalue
1 Plant hormone signal transduction     70         254 3.94000e-09 4.33e-07
2      Phenylpropanoid biosynthesis     49         163 5.07000e-08 2.79e-06
3          Phenylalanine metabolism     38         126 1.53000e-06 4.20e-05
4        Plant-pathogen interaction     45         159 1.21000e-06 4.20e-05
5            Flavonoid biosynthesis     11          22 5.86000e-05 1.29e-03
6          Linoleic acid metabolism     11          24 1.58824e-04 2.50e-03
  richFactor Pathway ID
1  0.2755906    ko04075
2  0.3006135    ko00940
3  0.3015873    ko00360
4  0.2830189    ko04626
5  0.5000000    ko00941
6  0.4583333    ko00591
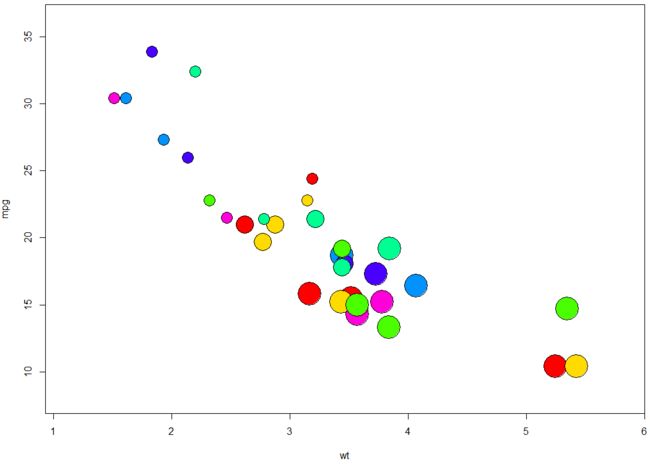
基础symbols函数绘制气泡图
head(mtcars)
                   mpg cyl disp  hp drat    wt  qsec vs am gear carb
Mazda RX4         21.0   6  160 110 3.90 2.620 16.46  0  1    4    4
Mazda RX4 Wag     21.0   6  160 110 3.90 2.875 17.02  0  1    4    4
Datsun 710        22.8   4  108  93 3.85 2.320 18.61  1  1    4    1
Hornet 4 Drive    21.4   6  258 110 3.08 3.215 19.44  1  0    3    1
Hornet Sportabout 18.7   8  360 175 3.15 3.440 17.02  0  0    3    2
Valiant           18.1   6  225 105 2.76 3.460 20.22  1  0    3    1

attach(mtcars)
symbols(wt,mpg,circles=cyl,
        inches=0.2,
        bg=rainbow(7))
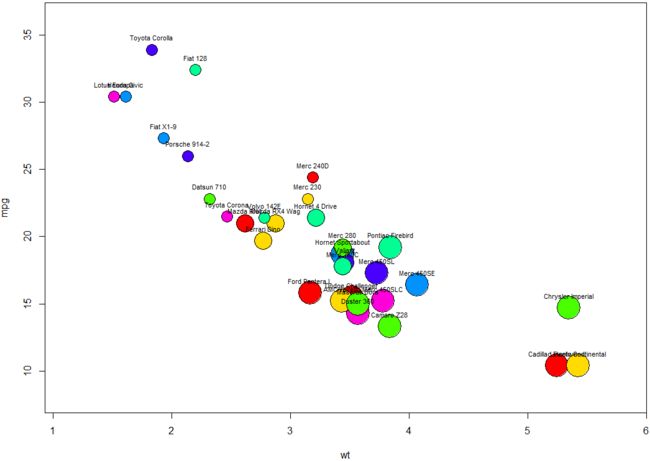
# 添加文本标签
text(wt,mpg,labels = row.names(mtcars),cex=0.7,pos = 3,offset = 0.8)
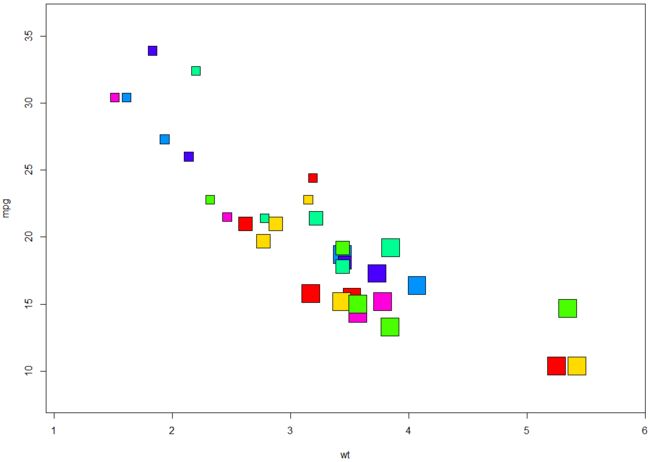
# 将圆圈换成正方形
symbols(wt,mpg,squares=cyl,
        inches=0.3,
        bg=rainbow(7))
detach(mtcars)
ggplot2包绘制富集气泡图
library(ggplot2)
head(data)
Pathway R0vsR3 All_Unigene      Pvalue   Qvalue
1 Plant hormone signal transduction     70         254 3.94000e-09 4.33e-07
2      Phenylpropanoid biosynthesis     49         163 5.07000e-08 2.79e-06
3          Phenylalanine metabolism     38         126 1.53000e-06 4.20e-05
4        Plant-pathogen interaction     45         159 1.21000e-06 4.20e-05
5            Flavonoid biosynthesis     11          22 5.86000e-05 1.29e-03
6          Linoleic acid metabolism     11          24 1.58824e-04 2.50e-03
  richFactor Pathway ID
1  0.2755906    ko04075
2  0.3006135    ko00940
3  0.3015873    ko00360
4  0.2830189    ko04626
5  0.5000000    ko00941
6  0.4583333    ko00591

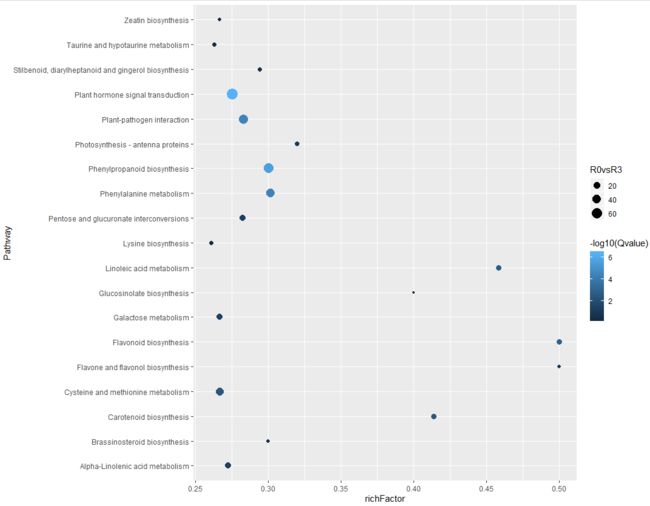
# 基础富集气泡图
ggplot(data,aes(x=richFactor,y=Pathway,size=R0vsR3,color=-log10(Qvalue))) + geom_point()
# 更改颜色,主题,坐标轴标题
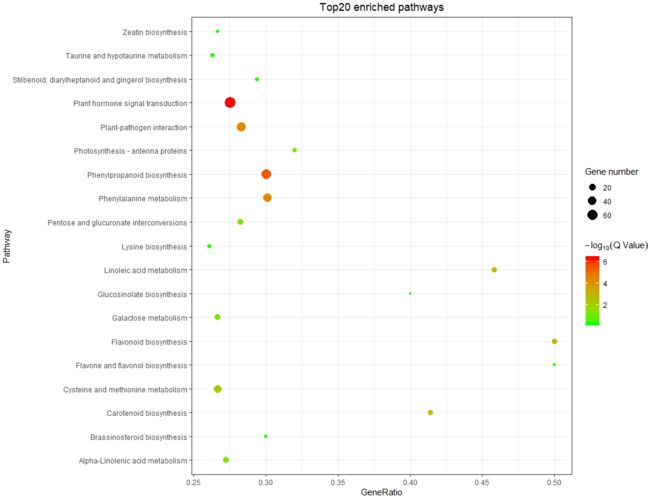
ggplot(data,aes(x=richFactor,y=Pathway,size=R0vsR3,color=-log10(Qvalue))) +
  geom_point() + theme_bw() +
  scale_colour_gradient(low="green",high="red") +
  labs(x="GeneRatio",y="Pathway",title="Top20 enriched pathways",
       colour=expression(-log[10]("QValue")),size="Gene number") +
  theme(plot.title = element_text(hjust = 0.5))
ggpubr包绘制富集气泡图
library(ggpubr)
data$`-log10(Qvalue)` <- -log10(data$Qvalue)

# 基础富集气泡图
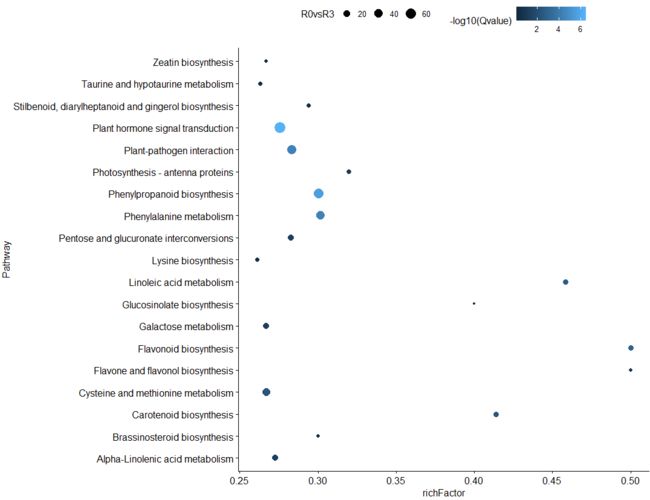
ggscatter(data,x="richFactor",y="Pathway",
          size = "R0vsR3",color = "-log10(Qvalue)")
# 更改颜色,主题,坐标轴标题
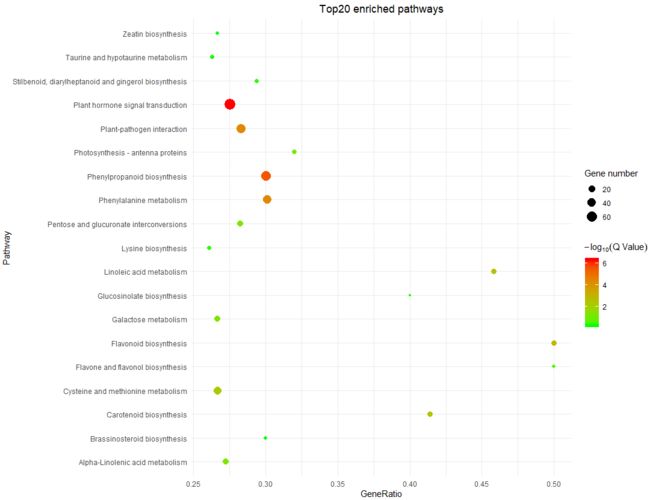
ggscatter(data,x="richFactor",y="Pathway",
          size = "R0vsR3",color = "-log10(Qvalue)",
          xlab="GeneRatio",ylab="Pathway",
          title="Top20 enriched pathways") +
  theme_minimal() +
  scale_colour_gradient(low="green",high="red") +
  labs(colour=expression(-log[10]("QValue")),size="Gene number") +
  theme(plot.title = element_text(hjust = 0.5),legend.position = "right")
sessionInfo()
R version 3.6.0 (2019-04-26)
Platform: x86_64-w64-mingw32/x64 (64-bit)
Running under: Windows 10 x64 (build 18363)

Matrix products: default

locale:
[1] LC_COLLATE=Chinese (Simplified)_China.936
[2] LC_CTYPE=Chinese (Simplified)_China.936
[3] LC_MONETARY=Chinese (Simplified)_China.936
[4] LC_NUMERIC=C
[5] LC_TIME=Chinese (Simplified)_China.936

attached base packages:
[1] stats     graphics  grDevices utils     datasets  methods   base

other attached packages:
[1] ggpubr_0.2.1  magrittr_1.5  ggplot2_3.2.0

loaded via a namespace (and not attached):
 [1] Rcpp_1.0.5       rstudioapi_0.10  knitr_1.23       tidyselect_0.2.5
 [5] munsell_0.5.0    colorspace_1.4-1 R6_2.4.0         rlang_0.4.7
 [9] dplyr_0.8.3      tools_3.6.0      grid_3.6.0       gtable_0.3.0
[13] xfun_0.8         withr_2.1.2      htmltools_0.3.6  yaml_2.2.0
[17] lazyeval_0.2.2   assertthat_0.2.1 digest_0.6.20    tibble_2.1.3
[21] ggsignif_0.5.0   crayon_1.3.4     purrr_0.3.2      evaluate_0.14
[25] glue_1.3.1       rmarkdown_1.13   labeling_0.3     compiler_3.6.0
[29] pillar_1.4.2     scales_1.0.0     pkgconfig_2.0.2
